
MANIPULATING RECOMMENDATION LISTS BY GLOBAL
CONSIDERATIONS
Alon Grubshtein, Nurit Gal-Oz, Tal Grinshpoun, Amnon Meisels
Dept. of Computer Science and Deutsche Telekom Laboratories at Ben-Gurion University, Beer-Sheva, 84105, Israel
Roie Zivan
Dept. of Industrial Engineering and Management at Ben-Gurion University, Beer-Sheva, 84105, Israel
Keywords:
Recommender systems, Rating manipulations.
Abstract:
The designers of trust and reputation systems attempt to provide a rich setting for interacting users. While
most research is focused on the validity of recommendations in such settings, we study means of introducing
system requirements and secondary goals which we term Global Considerations.
Recommendation systems are assumed to be based on a framework which includes two types of entities:
service providers and users seeking services (e.g. eBay (eba, )). The present paper formulates a basis for
manipulation of information in a manner which does not harm either. These manipulations must be carefully
devised: an administrator attempting to manipulate ratings, even for the benefit of most participants, may
dampen the gain of service providers, users or both. On the other hand, such changes may produce a more
efficient and user friendly system, allow for the improved initialization of new service providers or upgrade
existing features. The present paper formulates threshold values which define the limits of our manipulation,
propose different concepts for manipulation and evaluates by simulation the performance of systems which
employ our manipulations.
1 INTRODUCTION
A key objective of reputation systems is to provide
users with means for selecting the best candidate for
interaction based on their preferences. It is often the
case that relaxation of users’ expressed preferences,
results in better meeting their needs both individually
and as a group. For example, when a user is in need of
medical aid, she will often search for the most trusted,
or best recommended, service provider. If that service
is currently not available by the system then the user
will be left waiting until the service is made available
(alternatively the user may decide to forgo her request
and sign out of the system).
On the other hand, some (intrusive) measures de-
signed to force users to a certain action or state are
often introduced to better suit the designer’s goals.
In the context of the previous example, the system
may recommend a medical service to the user that are
based on the availability of the recommended service
providers and the constraints imposed on the system,
and do not adhere only to the user’s preferences. We
refer to such goals and ideas as Global Considera-
tions.
There are many benefits to introducing global con-
siderations. Some examples are the following:
• Improve the starting point of new services, users
or items.
• Control waiting queues of systems in which
shorter waiting queues, better serve the interests
of users. This, in turn, increases user’s satisfac-
tion and usually leads to a higher number of users
(cf. (F.Bruner et al., 2002)).
• Upgrade existing features, for example: promote
users through banners and ads.
When aiming to provide the best service to the
users, global considerations should be introduced into
the system with great care. One can formulate this
idea as a criteria for the introduction of changes: “Ad-
ministrators interests should be allowed, as long as
these do not harm the quality of service”. Simply
put - don’t let users of the system pay the price of
changes. In our medical aid scenario this means that
the system should move the user between different
135
Grubshtein A., Gal-Oz N., Grinshpoun T., Meisels A. and Zivan R. (2010).
MANIPULATING RECOMMENDATION LISTS BY GLOBAL CONSIDERATIONS.
In Proceedings of the 2nd International Conference on Agents and Artificial Intelligence - Agents, pages 135-142
DOI: 10.5220/0002702901350142
Copyright
c
SciTePress

service providers as long as that user’s trust in the new
provider is sufficiently high.
It is not obvious that adding global considerations
without degrading the user’s service is possible. To
the best of our knowledge no such manipulations were
considered in previous works in the field of recom-
mendation systems. Other fields of research, on the
other hand, deal with somewhat similar problems. For
example, excessive waiting by users in a medical sce-
nario (Silvester et al., 2004) such as the one described
above. Questions relating to the capacity of health
organizations and the waiting queue of patients are
examined, but the main focus is the adaptation of an
organization’s management system to accommodate
patients (users) flow through them.
A reputation-based QoS estimation approach has
been studied in (Vu et al., 2005). The QoS-based
web service selection and rating algorithm presented
in this paper, returns a list of services meeting qual-
ity criteria set by the requesting user. Users reports
on QoS of all services are collected over time to pre-
dict their future quality. This prediction is also based
on the quality promised by the service providers and
considers trust and reputation issues as well. The au-
thors demonstrate the efficiency of the algorithms un-
der various cheating behaviors of users. A later study
presented a framework for the autonomous discovery
of semantic web services based on their QoS proper-
ties (Vu et al., ). The framework addresses various
aspects such as semantic modeling of QoS, personal-
ized matchmaking and rating of services, and the use
of services QoS reputation in the discovery process.
However, non of these papers attempt to manipulate
the rating for achieving a community-wide benefit.
An interesting approach uses Game Theory to in-
troduce an interested party which may not enforce be-
havior and payments or redesign the system (Mon-
derer and Tennenholtz, 2004). The interested party
directs users’ behavior by committing to non negative
monetary transfers, and it is not clear that this is pos-
sible in our scenario.
The remainder of this paper deals with a proposed
method for the introduction of the system’s interests.
Before any administrator intervention can take place,
each user should provide a service level threshold.
As long as this condition is met, the user will not be
harmed by the changes. This provides a motivational
basis for the system, often termed Individual Ratio-
nality.
Our ideas are applied to a virtual community of
users and service providers. Members of the commu-
nity interact with each other based on the trust level
they have in each other. When a member desires some
service, she queries the system for it. The system out-
puts a recommendation in the form of an ordered list
of service providers matching the query and the user,
along with their respective ratings. These ratings rep-
resent the aggregated rating of the service providers
with respect to the user and her trust level in her peers.
Our proposed approach manipulates the list of rec-
ommended services. For example, a service provider
can be promoted or demoted according to her avail-
ability. This effectively shortens waiting queues. In
a different scenario one may wish to manipulate the
services list according to seniority. This may better
reflect notions of “hospitality” or “hostility” toward
new service providers.
The proposed manipulation is by no means mis-
leading to the users or service providers. All partici-
pants must agree to this form of manipulation before
joining the service. Moreover, users explicitly pro-
vide the level of manipulation threshold they are will-
ing to accept.
2 A THRESHOLD FOR SERVICE
PROVIDERS
Let us first define the condition for satisfaction of a
service provider. The gain of a service provider from
using the system is a sum of all gains from every inter-
action with a user. When the service provider is over
burdened with incoming requests, not all requests will
be treated by the service provider within a given time
unit. These requests will be processed at a later time.
More formally, we use the following notation:
Definition 1. Queue size - The queue size of a service
provider e at a given Time Unit (TU) t is e
q
(t).
Definition 2. Capacity - A service provider e can han-
dle e
c
requests in a given TU.
Definition 3. Payment - The gain of a service
provider e from processing a single user request is e
p
.
The total profit of e is the sum of payments made
to her. This means that the profit of a service provider
is only dependent upon the number of requests she
handles. As mentioned before this profit is limited
due to capacity constraints: in a given TU, a service
provider may handle up to e
c
requests from her queue.
Hence, the profit of a service provider e is:
e
pro f it
(t) =
e
p
· e
q
(t) if her queue size is not
larger than her capacity,
e
p
· e
c
otherwise.
(1)
Following Eq. 1 we conclude that a service
provider will not be harmed by the system, as long
ICAART 2010 - 2nd International Conference on Agents and Artificial Intelligence
136

as the rate of incoming pending requests to her is not
lower than the number of requests she can handle in
a time unit.
3 A THRESHOLD FOR USERS
In the previous section we have shown that it is rather
straightforward to define the conditions under which
a service provider is not harmed by manipulations of
the system. Unfortunately, defining a user’s threshold
may not be done in a similar manner.
The main problem with defining a user’s threshold
is that she may react differently to waiting in differ-
ent queues. For example, consider a user in need of
a knee surgery. This user may be willing to wait for
a long period of time for the best orthopedic surgeon.
On the other hand, that same user will not tolerate a
delay of any kind whenever she has a plumbing prob-
lem.
Understanding the user’s entire set of priorities
and preferences is not always possible (or desired).
Hence we propose a user centric, or rather a user ori-
ented, solution: allow the user to manually set limits
to the manipulations made by the system. In partic-
ular, allow her to set limits to the manipulations of
waiting queues.
4 MANIPULATING QUEUES
Let u
i
be a user which requests a list of recommended
service providers by submitting some query. We de-
note the generated list by L
i
(s). This list is an ordered
list of k service providers e
j
,0 ≤ j ≤ k, and their re-
spective ratings, r
u
i
(e
j
). These will serve as the basis
for our manipulations. We assume that:
1. The number of incoming requests made to service
provider j at time t, e
j,in
(t), are known to the sys-
tem. This can easily be accomplished by monitor-
ing the system’s behavior.
2. The capacity of service provider j, e
j,c
is also
known - declared (truthfully) by her upon joining
the system.
The goal of the present study is to change the rat-
ing r
u
i
(e
j
) of a service provider in the list, so that
e
j,in
(t) does not exceed e
j,c
. The basic premise of our
manipulations is that users select a service provider
based on her rating. In other words, a service provider
j will be selected by a user i with the following prob-
ability
1
:
1
While this simple distribution function is assumed in
the present study, our methods can easily be adjusted to han-
Pr(r
u
i
(e
j
)) =
r
u
i
(e
j
)
∑
k
m=1
r
u
i
(e
m
)
(2)
Ideally, one would like to change the probability
in the following manner:
Pr
0
(r
u
i
(e
j
)) =
(
e
j,c
e
j,in
(t)
· Pr(r
u
i
(e
j
)) if
e
j,c
e
j,in
(t)
< 1
Pr(r
u
i
(e
j
)) otherwise
(3)
This modified probability represents the largest re-
duction the system can make without harming the ser-
vice provider. Put in words, it reduces the rating of
a service provider if the number of requests made to
her is higher than her capacity, or leaves the rating un-
changed if that is not the case. Any service provider
whose probability to be selected by a user drops be-
low Pr
0
may suffer a potential loss of clients.
This solution, however, suffers from a serious
drawback: the function Pr
0
can no longer be used as a
probability function. This drawback is demonstrated
in the following example:
Table 1: Example of modifying the probability of selecting
a service provider.
E1 capacity: 2, Pr(r
u
i
(e
j
)) = 0.3
incoming: 5 ↓
Pr
0
(r
u
i
(e
j
)) = 0.12
E2 capacity: 3, Pr(r
u
i
(e
j
)) = 0.6
incoming: 4 ↓
Pr
0
(r
u
i
(e
j
)) = 0.45
E3 capacity: 3, Pr(r
u
i
(e
j
)) = 0.1
incoming: 1 ↓
Pr
0
(r
u
i
(e
j
)) = 0.1
The three service providers E1,E2, and E3 pre-
sented in Table 1 comprise a recommendation list
of some user. Each has a different capacity and an
incoming requests rate attributed to her. Their re-
spectable ratings are 3, 6 and 1 which define their
probability values to be 0.3, 0.6 and 0.1 respectively.
Applying our desired manipulation results in the up-
dated values 0.12, 0.45 and 0.1. However, the sum
of these values is lower than unit: 0.12+ 0.45+0.1 =
0.67 meaning that they can no longer be used as prob-
ability values for the election of a service provider by
a user.
This example illustrates a serious problem: how
should one distribute the remaining probability be-
tween the service providers once such a manipulation
is made?
dle other distribution function (e.g. Pareto’s “vital few”).
MANIPULATING RECOMMENDATION LISTS BY GLOBAL CONSIDERATIONS
137

4.1 Solution 1: Normalize
Normalization of the modified probabilities may seem
like the best candidate solution for this problem. Nor-
malization is a linear transformation in which all val-
ues are multiplied by a constant factor (the sum of all
results). The problem with this multiplication is that
the ratio between Pr
0
values remains the same. As
a result, the relative order of the service providers in
the list is also maintained. This means that the service
provider that was most likely the one to be elected by
the user, before the normalization remains the same.
Even worse, a service provider may be promoted in-
stead of demoted. If we normalize the results in our
example, the new probability values will roughly be
0.18, 0.67 and 0.15. E2 is promoted although it can
no longer handle new requests. Finally, such a ma-
nipulation may not be applicable at all if it results in
promoting a service provider above the user’s thresh-
old (for example, if a user prohibits a promotion of
over 130%, E
3
’s updated rating will exceed that user’s
threshold).
4.2 Solution 2: Evenly Distribute
Another possible solution is to evenly distribute the
remainder among all service providers. However, this
method also suffers from several drawbacks:
1. The relative order between service providers is
maintained, so the effects of promotion and de-
motion may still be rather minute.
2. The incoming flux of requests may still be higher
than the capacity of some of the service providers.
3. Users’ preferences are not taken into account.
In our solution we would like to eliminate or mini-
mize the effects of these drawbacks.
4.3 Solution 3: Selectively Distribute
In this scheme we aim to redistribute the remain-
ing probability only amongst service providers which
were not demoted. That is, we attempt to promote
service providers which are still capable of processing
requests within the current time unit. We consider the
simplest form of distributing the remainder, namely
evenly distribute, although there are many possible
ways to do this.
Before going any further, one must ask herself if
this promotion of service providers’ rating is a valid
manipulation, i.e. it does no harm to either service
providers or users. From the service providers’ point
of view, it is obvious that no harm is done. In fact, she
stands to gain from this increased rating or at worse
not lose from it. However, this is not necessarily true
for the user. Consider the previous example. The
only possible candidate for promotion is E3. After
demoting other service providers to the level specified
by Pr
0
, the remainder is: 1- (0.12+0.45+0.1) = 0.33.
Consequently, the new Pr
00
value of E3 could increase
from 0.1 to 0.43 and E3 becomes an extremely likely
candidate for the user making the query. This is not
necessarily a desirable outcome: E3 might have re-
ceived its low rating because she is a truly bad choice
for the user. We conclude that promoting a service
provider may harm a user, and this should be taken
into account.
Following our ideas, which were specified above,
we let δ
+
and δ
−
serve as the limits on manipulation
(promotion and demotion) imposed by the user. We
proceed by partitioning the service providers in L
i
(s)
into two subgroups:
• D = {e:e’s capacity is lower than its incoming re-
quests}
• P = L
i
(s)/D
We begin by demoting service providers from D ac-
cording to the following formula:
Pr
00
(r
u
i
(e
j
)) =
(
e
j,c
e
j,in
(t)
· Pr(r
u
i
(e
j
)) if
e
j,c
e
j,in
(t)
> δ
−
δ
−
· Pr(r
u
i
(e
j
)) otherwise
(4)
All service providers that have more incoming re-
quests than they can handle, are demoted to an equi-
librium level. If this is not possible, we demote the
service provider to the lowest user-permitted value.
Unlike Eq. 3, in Eq. 4 users’ preferences prevent the
system from demoting some of the service providers
despite the possible gain from compromising. As-
signing δ
−
≈ 1 is expected of users which are not will-
ing to relax their demands, such as the one searching
for the best orthopedic surgeon described in Section
3.
As demonstrated above, this results in a new dis-
tribution of values which does not sum up to unity.
The remainder probability denoted ∆
−
is the sum of
all differences from the original value:
∆
−
=
∑
e
j
∈D
Pr(r
u
i
(e
j
)) − P
00
r(r
u
i
(e
j
)) (5)
Since we are interested in a probability distribu-
tion, we attempt to evenly distribute this reminder to
all service providers in P. However, user’s preferences
which may prohibit the promotion of some service
providers must again be taken into account. As be-
fore, if the promotion from this even distribution ex-
ceeds the user’s permitted promotion value (δ
+
), we
ICAART 2010 - 2nd International Conference on Agents and Artificial Intelligence
138

limit the SP’s improved rating.
Pr
00
(r
u
i
(e
j
)) =
(
∆
−
|P|
+ Pr(r
u
i
(e
j
)) 1 +
∆
−
Pr(r
u
i
(e
j
))·|P|
< δ
+
δ
+
· Pr(r
u
i
(e
j
)) otherwise
(6)
One can call this an attempt to evenly distribute
the remainder, because the user’s upper manipulation
limit may restrict the promotion of service providers
and leave a remainder which is larger than zero. In
such a case one is forced to “re-spend” the remain-
ing probability. The remaining probability values are
simply the previous amount (Eq. 5), minus the sum
of spent probability:
∆
+
= ∆
−
−
∑
e
j
∈P
Pr
00
(r
u
i
(e
j
)) − Pr(r
u
i
(e
j
)) (7)
The remainder ∆
+
is evenly distributed among all ser-
vice providers in D to keep order relations between
SPs consistent with our manipulation:
Pr
00
(r
u
i
(e
j
)) = Pr
00
(r
u
i
(e
j
)) +
∆
+
|D|
(8)
Finally, the rating is updated according to:
r
u
i
(e
j
) = Pr
00
(r
u
i
(e
j
) ·
∑
e
k
∈L
i
(s)
r
u
i
(e
k
) (9)
Note that the incoming flux of requests may be higher
than the capacity of some service providers, but this
is inevitable in view of the user’s strict preferences.
We apply this procedure on the previous exam-
ple. Let the user’s preference values be δ
−
= 0.6,
δ
+
= 2.5. We begin by demoting all service providers
which have more incoming requests than they can
handle at a time unit according to Eq. 4. The up-
dated probability values of all SPs are now 0.18, 0.45,
and 0.1. Note that E3’s value remains unchanged, and
that E1’s value is demoted according to user’s prefer-
ences despite a very low capacity - incoming flux ra-
tio. The remaining probability (0.27) is distributed to
E3. However, the updated value of E3 may not grow
beyond a factor of 2.5 of its original value, hence we
are left with a remainder of 0.12. This is evenly dis-
tributed among E1 and E2, which results in the prob-
ability values presented in table 2.
The proposed scheme manipulates the ratings
based on the assumption that service providers are
selected according to the distribution function spec-
ified earlier. Nonetheless, at the end of the day, users
select their service providers according to their per-
sonal, subjective criteria.
Table 2: Example for evenly distribute between selective
subsets of service providers.
E1 capacity: 2, Pr(r
u
i
(e
j
)) = 0.3
incoming: 5 ↓
Pr
00
(r
u
i
(e
j
)) = 0.24
E2 capacity: 3, Pr(r
u
i
(e
j
)) = 0.6
incoming: 4 ↓
Pr
00
(r
u
i
(e
j
)) = 0.51
E3 capacity: 3, Pr(r
u
i
(e
j
)) = 0.1
incoming: 1 ↓
Pr
00
(r
u
i
(e
j
)) = 0.25
5 EVALUATION
The proposed method is evaluated using a simulation
that aims at capturing the effect of global consider-
ation on service providers. The simulation focuses
on two aspects – the waiting queues of the service
providers and the service provider’s reputation.
5.1 Experimental Setup
The simulation, consists of K service providers which
are expected to interact with users over the course of
I iterations (or time units). In each time unit a random
number of users seek service (transactions) from the
K service providers (where the maximal number of
users, N, may satisfy K << N). Each service provider
is described by the following fields:
• True quality - The value which represents the ser-
vice provider’s true abilities. This value is ran-
domly selected at the beginning of the simula-
tion. It is the value an oracle returns when queried
about a service provider expressing the service
provider’s real quality. Users ratings are based on
this value.
• Global reputation - The value representing how
the service provider is currently perceived by the
community of users. Note that this value does
not necessarily reflect the service provider’s real
quality. Following each iteration this value may
change.
• Capacity - This value represents the maximal
number of transactions that the service provider
may handle during a time unit (iteration). It is a
static field (i.e. does not change during simula-
tion) assigned at the beginning of the simulation.
• Queue size - The number of users waiting for in-
teraction with the service provider.
In our simulation the same K service providers are
used, whereas the N users change after every itera-
tion. This means that the accumulated knowledge of
MANIPULATING RECOMMENDATION LISTS BY GLOBAL CONSIDERATIONS
139

past transactions will be evident only in the dynamic
global reputation of each service provider. Such “one-
time” users reflect the reality, in which a user usually
seeks a single recommendation in a specific domain
(or at least does not seek it very often).
Users of the simulation are created at the begin-
ning of each iteration, and are disposed of after pro-
viding a rating to the service provider. Rating the
service provider is only possible after a transaction
is concluded, hence, users may be kept for more than
one round. To provide a more realistic setting, each
user is characterized by a TYPE. A user’s TYPE repre-
sents her tendency to provide higher or lower ratings
than the common (average) score. That is, a TYPE
is a user specific numeral value, specifying the offset
from the expected rating value (see step 5 of an itera-
tion). We base this value on information gathered in
the grouplens project (mov, ) by calculating for each
user, the average offset from the average score of dif-
ferent items rated by her.
An iteration consists of several steps:
1. A uniformly random number of users are gener-
ated.
2. A list of service providers is generated for each
user. This list represents the recommendations
that the user receives from a Trust and Reputa-
tion system (TRS), (Gal-Oz et al., 2008; ?). The
recommendation value used in the simulation is
based on the Gaussian distribution around service
providers’ Global Reputation. As a result, some
service providers may have higher recommen-
dation value than others despite having a lower
Global Reputation. In reality, this may occur due
to personalization effects of the TRS.
3. When the effects of global considerations are ex-
amined, the list of recommendation values is re-
ordered according to the procedure described in
Section 4.3.
4. Each user is assigned to a service provider based
on Eq. 2, and is added to the service provider’s
queue.
5. Each service provider commits to a limited num-
ber of transactions. This number is bounded by
the capacity value of the service provider. The
users, in turn, provide a rating on the transaction
in the range of 0..10.0 according to the following
simple procedure:
• base rating ← the value around the service
provider’s true quality, selected from a Gaus-
sian distribution.
• The penalty for a delay t greater than zero is
calculated according to:
time penalty = min{
|
TY PE
|
·α
t
, f ·base rating}
where α is some value greater than 1, and f is a
fraction representing the maximal degradation
of score due to delays
• rating = base rating +time penalty + TY PE
6. The global reputation is updated. This value is
based on the average of the current iteration’s rat-
ings, and on the following time decay mechanism
(cf. (Josang and Ismail, 2002)):
GlobalRep =
time−10
∑
t=time
avg
t
· λ
t
where avg
t
is the average rating during time unit
t, and λ is a value between 0 and 1.
Table 3: Service Providers’ True Quality (TQ) and Queue
Capacity (QC).
SP ID TQ QC
SP
0
7.51 7
SP
1
3.6 15
SP
2
5.37 16
SP
3
7.1 5
SP
4
2.19 15
SP
5
4.5 19
SP
6
8.78 12
SP
7
0.81 20
SP
8
9.69 6
SP
9
8.09 15
The simulation ran two sets of tests, with and
without the use of global considerations. Both runs
include the same service providers, i.e. the same ca-
pacity, true quality, and initial global reputation were
used (Table 3). Both simulations were ran for 500 it-
erations, and in each iteration an identical number of
(up to 100) users was generated, with δ
−
= 0.5 and
δ
+
= 3. As can be seen in Table 3 the queue capacity
of service providers spanned a wide range of sizes.
5.2 Results
The first performance measure examined was the total
number of rated interactions. The non-manipulated
(NM) TRS resulted in a slightly lower number of
completed interactions in comparison to the global
consideration (GC) TRS (less than 1%). The user’s
willingness to compromise their requirements (δ
−
and δ
+
) may attribute for this slightly higher number
of completed interactions in the GC system. While
these compromises may increase the number of com-
pleted interactions, an undesirable side effect may
include lower quality interactions, reflected in the
global reputation. Thus, we examined the average
global reputation of each SP.
ICAART 2010 - 2nd International Conference on Agents and Artificial Intelligence
140
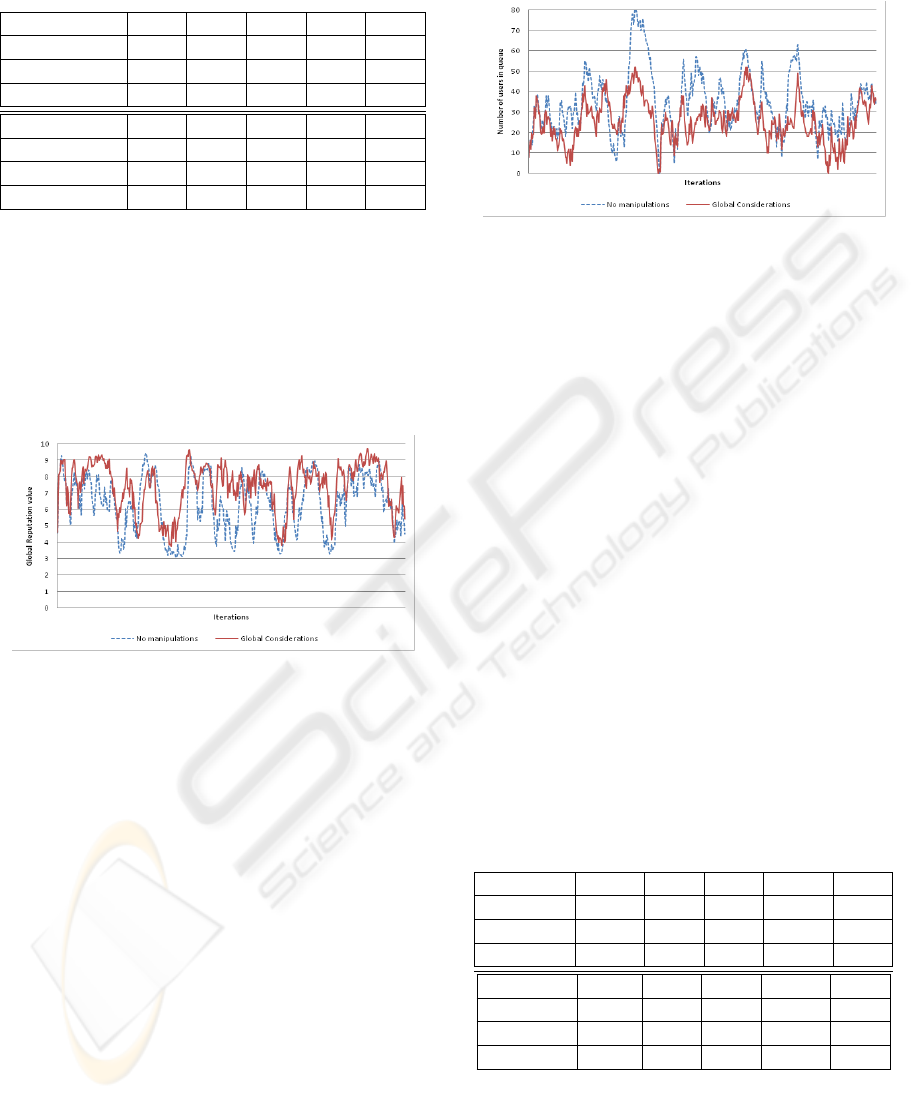
Table 4: Service Providers’ average Global Reputation
(GR) based on 500 iterations.
SP
0
SP
1
SP
2
SP
3
SP
4
True Quality 7.51 3.6 5.37 7.1 2.19
GR (NM) 6.74 3.64 5.41 5.19 2.19
GR (GC) 7.04 3.64 5.41 5.77 2.21
SP
5
SP
6
SP
7
SP
8
SP
9
True Quality 4.5 8.78 0.81 9.69 8.09
GR (NM) 4.53 8.65 0.99 6.35 8.09
GR (GC) 4.5 8.63 0.98 7.37 8.06
The average global reputation depicted in Table
4 demonstrates the performance of GC in compari-
son to NM. Our results indicate that the GC system
produced a global reputation average which is closer
to the true quality of service providers. Despite the
compromises made by the users of the GC system,
the average global reputation produced was roughly
26% more exact.
Figure 1: Global Reputation of SP
8
(true quality: 9.69) over
the course of 500 iterations, with and without queue manip-
ulations.
An interesting result was registered for SP
8
. In the
NM TRS, SP
8
’s average global reputation was 6.35,
while its average global reputation in the GC system
was 7.37. Figure 1 depicts the change in global repu-
tation over time. The figure demonstrates two impor-
tant aspects:
1. Global reputation is dynamic, but not monotonic.
When a service provider provides bad service (or
delayed service), her reputation may be highly af-
fected.
2. The global reputation value of SP
8
is usually
higher when the GC TRS is simulated.
We attribute the results of Figure 1 to the state of SP
8
’s
queue size. When the GC system is used, SP
8
’s queue
size becomes smaller, allowing it to swiftly accom-
modate for user requests, thus greatly reducing the
delay penalty described in Section 5.1. Indeed, our
empirical evaluation demonstrates that the queue size
of SP
8
is considerably lower with the GC system, as
depicted in Figure 2.
Figure 2: Queue size of SP
8
(queue capacity: 6) over the
course of 500 iterations, with and without queue manipula-
tions.
The difference between SP
8
’s high proficiency
level (9.69) and low capacity (6) creates an increased
number of incoming requests for her. This pressure
is somewhat reduced by the Global Consideration
mechanism, allowing SP
8
to maintain a good reputa-
tion. We verified this by conducting a similar experi-
ment with almost the same setup. In this experiment,
however, the queue capacity of SP
8
was reduced to 3.
As a result the average Global Reputation of SP
8
was
3.38 in the NM system, and 4.03 with GC (maximal
queue size of the NM TRS was 157 pending interac-
tions).
The last measure examined in our simulation is
the average number of users waiting for interactions,
or the queue size of each service provider. These
are presented in Table 5. As can be seen, service
providers such as SP
0
, SP
3
and SP
8
which are fairly
proficient but have low capacity values, interacted
with less users. This in turn resulted in a reduced de-
lay penalty, and improved global reputation for these
service providers (Table 4).
Table 5: Service Providers’ average Queue Size (QS) taken
over 500 iterations.
SP
0
SP
1
SP
2
SP
3
SP
4
Capacity 7 15 16 5 15
QS (NM) 16.68 3.53 5.29 21.76 2.2
QS (GC) 12.36 3.64 5.35 16.88 2.31
SP
5
SP
6
SP
7
SP
8
SP
9
Capacity 19 12 20 6 15
QS (NM) 4.41 9.86 1.07 34.87 8.13
QS (GC) 4.33 9.72 1.29 25.85 8.18
MANIPULATING RECOMMENDATION LISTS BY GLOBAL CONSIDERATIONS
141

6 CONCLUSIONS
In a recommendation system framework each service
provider and each user may have personal interests
and gains. These do not necessarily align and must be
examined separately. Despite the benefits of manipu-
lating recommendation output, this may result in a po-
tential loss of gain to participants. Service providers
may be harmed by a system if it directs future busi-
ness to others, and users may suffer from bad transac-
tions if recommendations are over manipulated.
The present paper examines the limits of possible
manipulations in such a framework. Our formulated
bound on manipulations for service providers consid-
ers their ability to process a given number of trans-
actions within a given time unit versus her incom-
ing requests rate. For a user, this bound is directly
derived from her expressed preferences. Using our
bound on manipulations, we examine two possible
manipulations aimed at increasing the total number
of transactions and discuss the problems they pose.
We address these problems and present a third manip-
ulation scheme which takes into account both users’
and service providers’ interests. An empirical evalu-
ation comparing the performance of our scheme with
that of an unmanipulated system is conducted using
a simulated system. Results indicate improved per-
formance in terms of the total number of transactions,
average queue length and average truthful reputation
of service providers.
REFERENCES
eBay. http://www.ebay.com/.
Movielens. http://www.grouplens.org/.
F.Bruner, R., R.Eaker, M., Freeman, R. E., Spekman, R. E.,
Teisberg, E. O., and Venkataraman, S. (2002). The
Portable MBA. Wiley.
Gal-Oz, N., Gudes, E., and Hendler, D. (2008). A robust
and knot-aware trust-based reputation model. In Pro-
ceedings of IFIPTM08: Joint iTrust and PST Con-
ference on Privacy, Trust Management and Security,
pages 167–182, Trondheim, Norway.
Josang, A. and Ismail, R. (2002). The beta reputation sys-
tem. In In Proceedings of the 15th Bled Electronic
Commerce Conference.
Monderer, D. and Tennenholtz, M. (2004). K-
implementation. J. Artif. Intell. Res. (JAIR), 21:37–62.
Silvester, K., Lendon, R., and Bevan, H. (2004). Reduc-
ing waiting times in the NHS: is lack of capacity the
problem? Clinician in Management, pages 105–111.
Vu, L.-H., Hauswirth, M., and Aberer, K. (2005). QoS-
based service selection and ranking with trust and
reputation management. In Lecture Notes in Com-
puter Science: OTM Confederated International Con-
ferences, CoopIS, DOA, and ODBASE 2005 Proceed-
ings, Part I, volume 3760, pages 446–483. Springer-
Verlag GmbH.
Vu, L.-H., Porto, F., Hauswirth, M., and Aberer, K.
An extensible and personalized approach to QoS-
enabled service discovery. In Eleventh International
Database Engineering and Applications Symposium
(IDEAS’07), Banff, Canada September 6-8, 2007.
ICAART 2010 - 2nd International Conference on Agents and Artificial Intelligence
142
