
COMPUTER ASSISTED MICROSCOPY
The Era Small Size Slides & 4m Microscopes
O. Ferrer-Roca and F. Marcano
UNESCO chair of Telemedicina, Chair of Pathology, University of La Laguna, Tenerife, Canary Islands, Spain
Keywords: Tele-pathology, Super-resolution, Digital pathology, Digital images, 4M microscopes, Mobile phones,
Image quality, Cytology.
Abstract: The present paper described the technique to evaluate digital resolution (DR), Visual Magnification (VM),
onScreen Magnification (SM) and Useful magnification (US) in order to compare image quality and
resolution for diagnostic purposes on computer assisted microscopes including Multi-Modal Miniature
Microscopes-4M.The study was done on surgical pathology and cytological specimens comparing analog
microscopic images versus digital Small Size Virtual Slides (SSVS) images. The SSVS were obtained with
an 8 megapixel camera, in JPEG2000 format using a super-resolution algorithm of capture. The field of
view-FOV images showed four times higher discrimination power, in spite of the low sampling density. The
region of interest-ROI images, with a sampling density close to Shannon theory showed six times higher
discrimination power. OnScreen magnification FOV achieved 640x and ROI 3200x augments that could
never been reached using analog microscopy. The paper demonstrates that SSVS are ideal for hand-held
microscopes or even mobile phones with ad-on capture systems.
1 INTRODUCTION
Several approaches have been proposed for an
efficient storage of complete digital slides
(DS=digital slide) with distant access: Dynamic
Robotic Telepathology (DRT) (Ferrer-Roca, 1998),
Virtual Slides (VS) and the present Small-Size
Virtual Slides (SSVS) (Ferrer-Roca, 2005, 2007)
technique.
SSVS take the advange of the modern digital
cameras using digital zoom. It is a JPEG-2000 image
(JPEG, 2001) 100 times smaller than VS, easy to
transmit and store (Marcano, 2007). In-focus low
power images are solved with the ZF-Zoom Focus
(Ferrer-Roca, 2005) technique.
Fully digital surgical pathology is progressively
being accepted (Ho et al., 2006) but cytology is
complex since it requires high power for diagnosis.
Also chip miniaturization allows using hald-held
devices. This is the case of the 4M or Multi-Modal
Miniature Microscopes of less than two centimetres
of diameter using CMOS as well as mobile phones
cameras up to 12 megapixels. Being out of the strict
optical control of the microscopic vendors it become
essential to established the parameters to compare
image quality, which are provided in the present
paper.
2 MATERIAL & METHODS
Images were obtained on an average quality
Olympus BH-2 microscope with a high resolution
CCD camera. A AVT-Oscar F-810C fireware
IEEE1394 camera, with a CCD 2/3” Sony sensor of
8 Megapixels-Mpx (3288x2470) producing images
of 3272x2469, 12 bits/pixel. The chip was a colour
mosaic (R-G x G-B) with 2x2 pixel sensitivity.
Signal to noise ratio (SNR) was 36,19dB (Noise
floor of CCD cameras of 12 bits dynamic range is
2.4x10
-4
; SNR= - 10 log
10
Fnoise= 36,19dB.)
2.1 Digital Camera-image Processing
The camera control was integrated into the
TEXCAN-II®-suite using AVT-Allied Vision
Technologies (www.intek-darmstadt.de), CVB
(www.commonvisionblox.com) and LeadTools
libraries (www. Leadtools .com / SDK / Medical /
Medical-Products-n.htm).
517
Ferrer-Roca O. and Marcano F. (2010).
COMPUTER ASSISTED MICROSCOPY - The Era Small Size Slides & 4m Microscopes.
In Proceedings of the Third International Conference on Bio-inspired Systems and Signal Processing, pages 517-522
DOI: 10.5220/0002706105170522
Copyright
c
SciTePress

The suite controls white balance, image focus at
1:1 digital zoom (ZF technique) (Ferrer, 2005),
image noise reduction, hardware shading correction
and FOV images acquisition. Virtual image were
obtained stitching all FOV in a JPX-JPEG2000
format building a final 1/10 wavelets compressed
JPEG2000 image.
Image noise reduction and contrast enhancement
was tested with several algorithms and the better one
is presented. Further improvement of the SNR
(signal to noise ratio) avoiding aliasing was the
colour demosaicing display: Images taken in RAW
format were displayed demosaicing while RGB
images were stored demosaiced.
2.2 Optical Acquisition System
2.2.1 PMoC
Each field of view (FOV) was taken through a SPlan
4x objective (Obj), 0.13 NA (Numeric Aperture),
using a relay tube lens NFK 2.5x LD of 125 on the
MTV-3 tube with a 0.3x lens that produce a total
Projection Magnification onChip - PMoC of 3x (
4*2.5*0.3). Exact magnification was checked with a
calibration slide of 1 mm in 10μm marks from
Graticules LTD, England.
Each region of interest (ROI) was scanned with a
0.46 NA SPlan 20x objective at a PMoC of 15x
(20*2.5*0.3).
2.2.2 Diagnostic Image Quality
The Overall Magnification (OM) was the product of
the lenses (Obj *Oc) and the distance (D) over
which the image is projected. Human eye is only
capable to discriminate ¼ mm (M= D* Obj*Oc/250
mm). According to the Abbe rules the magnification
capable to enlarge an object from ¼ μm to ¼ mm to
be seen by human vision is 1000x. Above 1000* NA
no further detail are shown and therefore is called an
empty magnification (http://www.microscopyu.com/
articles/formulas/formulasmagrange.html).
The following parameters were evaluated on
digital images:
• Digital Resolution (DR) or sensor effective pixel
size (Epx) divided by the total PMoC. Epx μm
/ PMoC. Equivalent to sampling density.
• Visual Magnification (VM) through a 10x wide-
field ocular (Oc) in a standardized projection
of 250 mm distance for 20/20 eyes. VM was
40 times for FOV scan objective and 200
times for the ROI objective.
• Total Screen Magnification (SM) or relationship
between screen and CCD pixel size
Spx/CCDpx. In 1:1 zoom images SM was
almost 100 times (264μm/2.7μm = 97.77).
Digital zoom-in and zoom-out magnification
factors depend of the JPEG2000 tile format. In
these cases SM was previously calculated
using a micrometric standardized slide (see
diagnostic assessment below) and overlaid on
the screen.
• Useful Magnification (UM) ranged from
500*NA up to 1000*NA.
2.3 Diagnostic Assessment
On screen observation for diagnosis was
standardized in an FTP monitor of 17” with 1280 *
1024 px, 32 bpp at 60 Hz. For comparison purposes
a micrometric rule was built using the calibration
slide mention above.
Visual diagnostic assessment was carried out
with 15 cases taken at random: 3 surgical pathology
slides and 12 cytology.
In TEXCAN-II®-suite, the ROI appeared as
color overlay on the FOV: red square whether
selected at random and green square whether
selected by technicians whose name is annotated.
The clinical information can also be annotated (see
Figure 2A).
The SSVS were accessed at distance though the
TEXCAN-II®-server using a JPEG2000
transmission protocol (JPIP) (Taubman, 2003;
Krishnan, 2006) based on Kakadu 5.2 library
(http://www.kakadusoftware.com). Browsing was
done with the TEXCAN-II®-viewer also based on
Kakadu (see the viewer on Figures 2-3).
3 RESULTS
3.1 DR of the System
Optical Resolution (OR) according numeric
aperture and objective correction based on the
Rayleigh criterion of the diffraction limit (∆x= 0.61
λ/n* sin θ) as taken from
http://www.microscopyu.com/articles/formulas/form
ulasresolution.html was 2.12 μm for FOV and 0.55
μm for ROI images.
Scanning density or pixel density was
3272*2469 in a of 8.8 * 6.6 mm
2
chip area that
contain 2.7 * 2.7 μm
2
pixels (px).
Effective pixel (Epx) size
BIOSIGNALS 2010 - International Conference on Bio-inspired Systems and Signal Processing
518
• In RGB-24 bit images colour demosaicing was
carried out with three linear bilinear interpolations
of 8:1 Bayer color pattern 4G-2R-2B taking 3x3
surrounding pixels, before storage. The result was
that although pixel density is maintained, the
information was integrated in an 8.1 * 8.1 μm
2
area and the Epx was 8.1 μm.
• In RAW-16 bit format (black and white-BW),
images were displayed on screen in colour
previous demosaicing. For that purpose the colour
integration algorithm used was a B, R, G1+G2/2
taking the 2x2 surrounding colour pixels in a 4:1
Bayer color pattern 2G-R-B. The result was that
for visual perception pixel density was maintained
but information was integrated in a 5.4 * 5.4 μm
2
area maintaining original data for processing
purposes. The resulting Epx size of the RAW
colour image was 5.4μm.
3.1.1 FOV Digital Resolution (4x)
RGB-images after demosaicing had a DR= 2.7
(Epx/PMoC= 8.1/3) or around 3μm/px. Since optical
resolution was 2.12μm, sampling frequency was one
third of the optimal (2.12μm /2.4px ≈ 1μm /px) in
Shannon theory.
RAW images had DR=0.9 (Epx/PMoC= 2.7/3)
or around 1μm/px, that fulfilled the Shannon theory.
After demosaicing to be displayed on the screen in
colour, RAW-images had a DR=1.8 (Epx/ PMoC =
5.4/3) or around 2μm/px, which is half of the
optimal. (see Table I).
3.1.2 ROI Digital Resolution (20X)
RGB-images had a DR=0.54 (Epx/PMoC= 8.1/15)
or around 1μm/2px. Since optical resolution at this
magnification is 0.55 μm, the sampling frequency
was half of the optimal (0.55 μm/ 2.4px ≈ 1μm
/4px), in Shannon theory (see Table 1).
RAW images had a DR=0.18 (Epx/PMoC=
2.7/15) or around 1μm/5px. The specimen is
therefore oversampled according the Shannon
theory. After demosaicing, to be displayed on screen
in colour, RAW-images had a DR=0.36 (Epx/PMoC
= 5.4/15) or around 1μm/3px, close to Shannon
theory. (Table 1)
3.1.3 Super-resolution Algorithm
The best cost-computation algorithm to reduce
image noise was applied to all images. This was a 16
times image averaging that improved signal-to-noise
ratio (S/N or SNR) by N/sqrt(N) a factor of 4, which
is 12.04 dB. Furthermore, as mention in material and
methods, demosaicing for onScreen colour display
further improve SNR avoiding aliasing.
Table 1: Digital Resolution. Comparison of demosaiced-
RGB 8:1 images, with RAW demosaiced images
displayed in 4:1color pattern.
ST= Sampling density according to Shannon theory.
40x is tested but not used in the SSVS.
OBJ. PMoC OR
μm
ST
μm/px
RGB-
demosaic
μm/px
RAW
μm/px
RAW-
demosaic
μm/px
4x 3x 2.12 1 3 1 2
20x 15x 0.55 1/4 1/2 1/5 1/3
40x* 30x 0.29 1/8 1/4 1/10 1/5
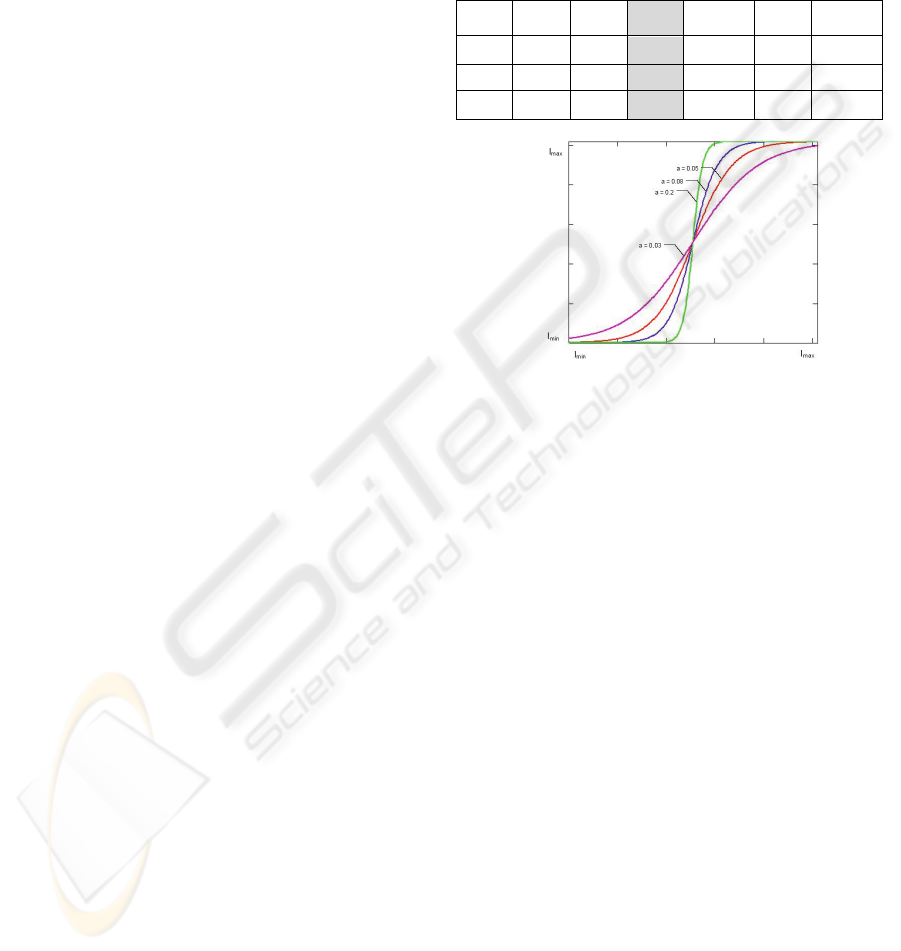
Figure 1: Non linear ACE or adaptive contrast
enhancement curve. Acting as an inverse normalized
optical modulation transfer function (MTF, see
http://www.microscopyu.com/articles/optics/mtfintro.html
) correcting optical coherence factor (OCF) or relationship
between NA of detector (CCD) and the objective γ=
NAccd/NAobj.
In RAW images, after averaging, we further
improved adding 6 % in the three channels (RGB) to
compensate contrast reduction to build roughly a
LRGB image (Luminance RGB image). This was
followed by an adaptive contrast enhancement
(ACE) 16x16 mask filter to correct low contrast,
exponentially adjusted by a factor of 125 in a
sigmoid curve. (Figure 1).
3.1.4 SM for Diagnostic Purposes
SSVSs size depended on the number of FOV
contained. Software zoom-in and zoom-out was
limited by JPEG-2000 compression structure.
Screen Magnification-SM was related to image
zoom ranging from 9 to 2933 times. Lower
implemented SM was 3 times CCD vision (see table
2), although JPEG2000 algorithm supports smaller
fingerprints. Similarly, higher SM could be
displayed, but the result will be an empty
magnification.
COMPUTER ASSISTED MICROSCOPY - The Era Small Size Slides & 4m Microscopes
519
A
B
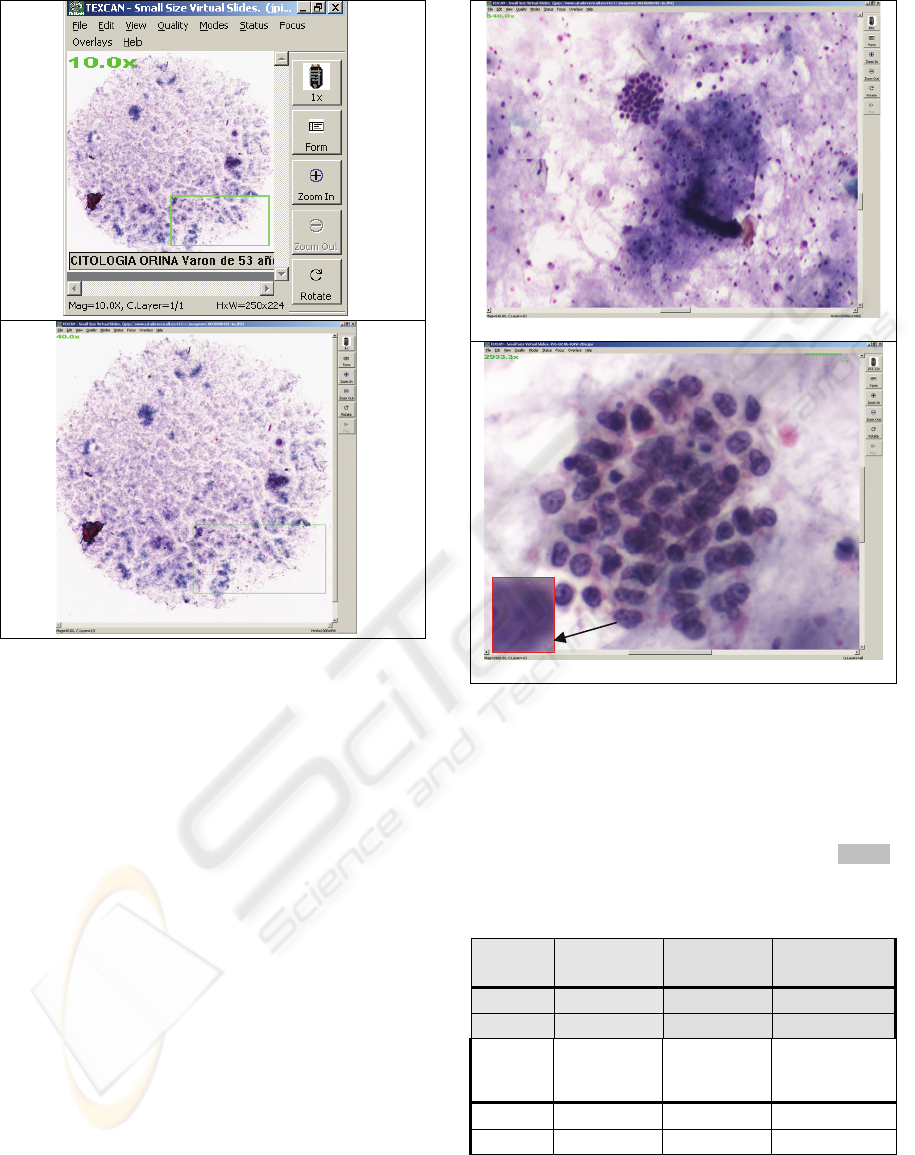
Figure 2: Cytology specimen. SSVS-RGB.A. FOV
onScreen. Zoom-out 10x. The green square indicates a
ROI selected by a cytotechnologist. Screen magnification
– SM is seen on the upper left corner.B FOV onScreen.
Zoom-out SM 40x.
System: OR= 0.55μm OR and DR= 1 μm /2px.
Table 2
compared analogue and digital magnification. Two
analogue magnifications were analyzed: Visual and
Useful magnification-UM by analogue projection.
Two digital magnifications were analyzed: onChip
and onScreen depending on image zooming.
Maximum zoom-in was one step before pixel-block
(often referred to as pixelation) appeared on the
image.
3.1.5 FOV onScreen Magnification 4x
The SSVS can be seen almost from the original
magnification (9x), to the maximum image display
according to FOV sampling (294x) up to 587x by
software zoom-in. Further zoom showed pixelation.
See images in Fig. 2 & 3 AB.
The onScreen magnification-SM when compared
with maximum Useful Magnification-UM of analog
images (1000*NA= 1000*0.13) was 2 times higher
on the original digital 1:1 images (294/130=2.3) and
A
B
Figure 3: Cytology specimen.SSVSA. RGB-FOV
onScreen Zoom-in SM 640x. System: OR=2.12 μm and
DR=3 μm /px.B. RAW-ROI onScreen. SM 2933x. On the
left corner SM 8799x showing the pixelated nuclear
details of the empty magnification. System: OR=0.55μm
and DR=1 μm /3px. The rule on the top right is 10 μm.
Table 2: Analog Visual & Useful magnification (in grey)
versus digital onChip & onScreen magnification (in white)
RAW demosaicing images. VM=Visual magnification;
UM= Useful magnification range.
Obj VM Low UM
500xNA
High UM
1000xNA
4 x 40x 65x 130x
20x 200x 250x 460x
CCD
PMoC
Zoom-out
(fingerprint
)
1:1 Zoom-in
3x 9x 294x 587x
15x 46x 1467x 2933x
BIOSIGNALS 2010 - International Conference on Bio-inspired Systems and Signal Processing
520

4.5 times higher at the maximum digital zoom-in
(587/130= 4.5).
The onScreen RGB images built with half
sampling density then required improved by 4.5
times the UM to enter in the so called empty
magnification.
In Figure 2 & 3 A-B we can analyze several
zoom-in and zoom-out SM.
4 DISCUSSION
The present paper demonstrates how digital
pathology behave as a computer assisted
microscopy, because helps to detect details that
escape to human eye in the so-called type I low
aperture (NA<0.5) widefield incoherent light
systems. In other words hybrid systems (in which
optical and digital modules are part of the same
system) could improve resolution and specifically
the CCD systems improve system resolution by 2
(Torok, 2007).
In the presented system, all improvements were
low cost computation algorithms: (1) noise reduction
increasing depth of field by 16 image averaging, (2)
attenuated frequencies were amplified with LRGB
images that correct the limited light gathering
(proportional to NA
2
) of low-NA lenses, and (3)
phase recovery improving modulated transfer
function with an adaptive contrast enhancement.
The displayed RAW-color demosaicing images
reached the superresolution level (Nugent, 2003)
(Lipson, 2003) even without an optimal digital
resolution.
Projection magnification onChip (PMoC) is
essential to evaluate the system sampling
capabilities and Digital Resolution-DR influence
visibility and digital image quality with or without
computer assisted techniques.
OnScreen differences for RAW and RGB images
were due to higher DR and contrast enhancement
with light gathering provided by superresolution
algorithms on the RAW images.
Capture is furthermore influenced by Chip
quality. Most photographic cameras have 5-9 μm
pixel size and big size chips. Microscopy requires
smaller chips to avoid aliasing (Koren, 2000-2009)
and therefore smaller pixel size; this provides more
noise and less sensitivity increasing the cost. This is
the reason why high resolution cameras with high
SNR are require in microscopic imaging.
Nowadays the public consume CCDs and CMOS
chips for imaging are improving. Being the CMOS
more noisy but cheaper solutions. There are ultimate
regeneration of mobile phones that contain a 12
Megapixel cameras and therefore provide high
digital resolution due to the high sampling. Those
hand-held solutions including the 4M microscopes
only require to be considered in pathology
appropriate objective lenses and illumination system
preferable base on leads (Ferrer-Roca, 2005).
One of the main drawbacks for distant diagnosis
in pathology (telepathology) is sampling error
because the essential part of the specimen is not seen
because it was not completely digitized. The
solution to this is to digitized the whole specimen
building a Virtual Slide. The usual VS technique
captures images using 40x objectives because
optical resolution is adequate (0.29 μm); the result is
a huge image (around 10 GB) difficult to handle,
that require time consuming compression techniques
on which we cannot control lost information and that
is difficult to store in the hospital information
systems based on DICOM, because the limit image
size is 2 GB (Dicom, 2007).
The technique presented here not only provide
small images but zoom-in and zoom-out capabilities
never explore by pathologist (Ferrer-Roca,
2005)(Marcano, 2007; 2006). As shown in the paper
the image showed a super-resolution level to which
the oversampling and the super-resolution algorithm
applied played a role.
The paper demonstrated the methods to evaluate
image quality on computer assisted microscopes
displaying digital images. The analysis was focused
on resolution and visual magnification in order to be
able to apply it to various capture systems for distant
diagnosis ( 4M, mobile phones…).
In summary: The SSVS technique implemented
in the TEXCAN-II™ demonstrated that image
diagnostic capabilities are higher than analogical
image seen in the microscope because they are
capable to produce intermediate and high power
microscopic magnification entering in the empty
magnification showing super-resolution details. The
technique of specimen navigation and ROI detection
simplify and facilitate diagnosis at distance and
prepare the era of the hand-held microscopes based
on 4M or integrated into the mobile phones.
REFERENCES
DICOM strategic document (2007); [cited 2007 Dic 31st].:
http://medical.nema.org/dicom/geninfo/Strategy.pdf
Ferrer-Roca O. (1998) Telepathology. In Ferrer-Roca O,
Sosa-Iudicissa M. in Handbook of Telemedicine.
Amsterdam: IOS-Press, 1998; pp. 70-5
COMPUTER ASSISTED MICROSCOPY - The Era Small Size Slides & 4m Microscopes
521

Ferrer-Roca O., Marcano F, Diaz-Cardama A. (2005).
Digital Zooming in Medical Images. In Ferrer-Roca O.
Ed, CATAI-2006: p-health. Tenerife: CATAI Ed.
ISBN: 84-609-8648-9; pp. 111-118.
Ferrer-Roca O., Marcano F, Quintana, J. (2007) Small
Size Virtual Slides in Cytology. In Proceedings XXIII
European Congress of Cytology, Madrid, Spain.
Ho J, Parwani AV, Jukic DM, Yagi Y, Anthony L,
Gilbertson JR (2006). Use of whole slide imaging in
surgical pathology quality assurance: design and pilot
validation studies. Human Pathology 37(3): 322-31.
Krishnan K, Marcellin MW, Bilgin A, Nadar MS. (2006) ”
Efficient transmission of compressed data for remote
volume visualization”, IEEE Trans. Med. Imaging,
25(9): 1189- 1199.
Koren N. (2000-2009) Understanding image sharpness
part 2: Resolution and MTF curves in scanners and
sharpening.
http://www.normankoren.com/Tutorials/MTF2.html#
Nyquist.
Lipson SG. (2003) Why is super resolution so inefficient?.
Micron 34, Issues 6-7, 309-312.
Marcano F., Ferrer-Roca O., Diaz-Cardama A. (2006)
“Automatic-stiching in pathology”. In Ferrer-Roca O.
Ed., “CATAI 2007: Telemedicine standardization”,
Tenerife: CATAI Editions. 2006. pp. 161-168
Marcano F, De Armas N., Díaz-Cardama, A, Ferrer-Roca
O. (2007) Collaborative Systems for Pathology
Applications. The Open Pathology Journal, 2007, 1,
1-4. [cited 2007 Dic 31st]. http://www.bentham-
open.org/pages/gen.php?file=1TOPATJ.pdf.
Nugent KA, Bellari CJ (2003). Emulated super-resolution
using quantitative phase microscopy Micron 34,
Issues 6-7, 333-338.
Taubman, D. and Prandolini, R. (2003) Architecture,
philosophy and performance of JPIP: internet protocol
standard for JPEG2000, International Symposium on
Visual Communications and Image Processing
(VCIP2003), In: Ebrahimi T., Sikora T. Eds.,
Proceedings of SPIE vol 5150, pp. 649-663.
Torok P., Kao FJ. Ed. (2007) Optical Imaging and
microscopy. Techniques and advanced systems. 2nd
Ed. Springer Series in Optical Sciences.Springer-
Verkag. Heidelberg 2007.
BIOSIGNALS 2010 - International Conference on Bio-inspired Systems and Signal Processing
522
