
PROTEIN DOMAIN PHYLOGENIES
Information Theory and Evolutionary Dynamics
K. Hamacher
Bioinformatics & Theoretical Biology Group, Technische Universit
¨
at Darmstadt, Germany
Keywords:
Information theory, Jensen-Shannon divergence, Evolutionary dynamics, Phylogenetic trees, SUPFAM.
Abstract:
The ever-increasing wealth of whole-genome information prompts for phylogenies based on entire genomes.
The quest for a good distance measure, however, poses a big challenge; e.g. because of large-scale evolu-
tionary events such as genomic rearrangements or inversions. We introduce here an information theory driven
measure that for the encoded protein domain composition of genomes as protein domains are key evolutionary
entities. Thus the new method focuses on selective advantageous events. As evolving different protein do-
main compositions is more complex than single point mutations, the method makes longer evolutionary times
accessible. Illustrating the new methodology we extract several phylogenetic trees for some 700 genomes,
e.g. the separation of the three kingdoms of life, trees for mammals and bacillales, and a speculative result
for plants (monocotyledons and dicotyledons). The method itself is shown to be robust against incomplete
genome sampling. It has a consistent interpretation in both, information space at the sequence/information
level and at the level of stochastic, evolutionary dynamics. In contrast to established protocols it becomes
more accurate as more organisms are taken into account. Finally we show the equivalence to a (simplified)
model of evolutionary dynamics of proteomes.
1 INTRODUCTION
In the post-genome era the availability of vast
amounts of genetic, proteomic, metabolic, and bio-
chemical data opens new horizons for investigation
into the origin of life and its evolution. To this end a
detailed understanding of phylogenetic relationships
is mandatory. These phylogenies provide further in-
sight into the evolutionary trait of species and form to
a large extent our picture of the biological history of
life (Woese, 2000; Woese, 2002).
Now the availability of whole genome data pro-
vides for the opportunity of better phylogenetic in-
sight (Philippe et al., 2005) as recently discussed e.g.
by Yang et al. (Yang et al., 2005) For example Tekaia
et al. (Tekaia et al., 1999) used whole genomes for
phylogenetic analysis. Their suggested method deals,
however, not with the proteome (see below for ad-
vantages) and compares general gene products based
on sequences. Other approaches based on whole-
genomes are the studies by Otu and Sayood using
Lempel-Zif-compression-complexity of the genomic
sequences (Otu and Sayood, 2003), the related idea
by Li et al. (Li et al., 2001; Li et al., 2004) based
on Kolmogorov complexity, and the subsequent re-
finement by Mantaci and co-workers (Mantaci et al.,
2008). All the approaches are sequence-focused, thus
will have difficulties to account for e.g. constraints
on the gene products in the physical realm e.g. pro-
tein biophysics, structural biological issues and so on.
In addition although the concept of Kolmogorov com-
plexity is well established in theoretical computer sci-
ence and has proven to be of great value there, it is not
possible to compute its value numerically, but one has
instead to approximate it (Li and Vit
´
anyi, 1997).
1.1 Aligned-Sequence
vs. Whole-Genome Phylogenies
In general the signal-to-noise-ratio of methods based
on proteomic characteristics will be better than for
e.g. the well-established 16S-RNA-phylogenies. This
effect is due to the stable conservation of protein(-
domain) structure in comparison to its coding se-
quence. Related to this is the additional advantage
that longer evolutionary time-scales will become ac-
cessible. As noted by Yang et al. (Yang et al., 2005)
”house-keeping” proteins such as metabolic enzymes,
cytoskeleton-proteins, or histones can be expected to
evolve even more slowly and thus increase the signal-
114
Hamacher K. (2010).
PROTEIN DOMAIN PHYLOGENIES - Information Theory and Evolutionar y Dynamics.
In Proceedings of the First International Conference on Bioinformatics, pages 114-122
DOI: 10.5220/0002710101140122
Copyright
c
SciTePress

to-noise-ratio further. From a conceptional point of
view we have to concede that evolution during selec-
tion acts upon advantageous changes of the phenotype
and not upon changes in the genotype. The pheno-
type is, however, to a large extent determined by the
encoded proteome. Sequence based phylogenies are
focused solely on mutational events and their fixation;
proteome-based approaches are more concerned with
the (realized) selective advantage.
1.2 Difficulties due to Sequence
Alignments in Traditional
Phylogenetic Algorithms
In typical sequence based phylogenetic methods ac-
curate sequence alignments pose the biggest chal-
lenge due to alignment sensitivity towards parameter
changes in the alignment procedure. This issue was
extensively discussed e.g. by Li et al. (Li et al., 2001).
In particular the assumption on a universal applicabil-
ity of substitution matrices for longer time scales was
disputed.
By looking at proteomic information we - at least
theoretically - avoid this problem completely. We
will in particular map the genome to protein do-
main composition (PDC) vectors that quantify the
abundance of protein domain folds coded within the
species’ genomes. As will laid out below we rely
on Hidden-Markov-Models (HMMs) to extract pro-
teomes from genomic sequences and thus work only
implicitly with those alignments used to derive the
HMMs. These alignments for HMMs are, however,
based on a broader sample than we will face in phylo-
genetic analysis and will thus be able to reduce noise.
1.3 Sequence-based Whole-Genome
Approaches
Gerstein (Gerstein, 1998) pioneered the usage of pro-
teomic information for phylogenies with his semi-
nal work on the eight genomes available at that time.
His distance measure is based just on the number of
shared protein folds. While this avoids the problem
of unknown protein folds or domains that one might
fail to identify in the genome, it will on the other hand
fail to discriminate between closely related organisms
as they can be expected to command over the same
collection of protein folds, but with varying abun-
dances. In particular the argument about unknown
protein folds becomes less compelling over time as
the known, structural space of proteins has become
denser over the last years. Compare for example to
the hypothesis that the accessible protein fold space
is completely known (Zhang and Skolnick, 2005):
based on this assumption, one can argue that the argu-
ment about unknown protein domains is not relevant
nowadays.
Yang et al. (Yang et al., 2005) used as a distance
measure the number of shared superfamily folds. This
ansatz constitutes a yes/no-decision for the individ-
ual fold and neglects abundances of folds. A binary
decision such as this is sensitive with respect to the
accuracy of protein prediction. In addition - as with
Gerstein’s initial idea - it will in general not be able
to grasp subtle differences between closely related
species.
Additional studies were undertaken by Fukami-
Kobyashi et al. (Fukami-Kobayashi et al., 2007) and
by Fong et al. (Fong et al., 2007). The latter work
bases its distance measure on genomic rearrange-
ments represented by networks of necessary domain
rearrangements. The issue of elevated rates of re-
arrangements for different organisms (Ekman et al.,
2007) might, however, restrict the applicability of
such a method to narrowed sets of taxa.
1.4 Proteome Information as a Distance
Measure
In the following we will derive phylogenetic distances
from the composition of the proteomes of organisms
as represented by the protein domain composition
(PDC) vectors introduced above. To this end we
compute the relative frequencies p
i
of protein domain
folds i within the proteome of an organism. For two
such distributions (p and q) for two organisms we can
use the Jensen-Shannon entropy H
JS
(p, q) as an infor-
mation theoretical distance measure. H
JS
reads (Lin,
1991):
H
JS
(p, q) :=
1
2
·D
KL
(p
|
m) +
1
2
·D
KL
(q
|
m) (1)
Here D
KL
is the Kullback-Leibler-divergence (see
Methods section for details) and m :=
1
2
· p +
1
2
·q is
an average distribution, which can be interpreted as
an ancestor at an evolutionary branching point.
The Jensen-Shannon entropy gives the evolution-
ary distance as the amount of information that one
most provide to describe the difference from PDC p
to the PDC q through an intermediate, ’common an-
cestor’ of average PDC m. The entropy H
JS
is usually
measured in bits and its statistical properties for ar-
tificially created sequences was discussed in (Grosse
et al., 2002). Figure 1 gives an overview of the proto-
col.
In the Methods section we discuss the derivation
of H
JS
and in the Discussion section we show how this
PROTEIN DOMAIN PHYLOGENIES - Information Theory and Evolutionary Dynamics
115

Hidden Markov
Model for
Protein Domain 1
Hidden Markov
Model for
Protein Domain 2
Hidden Markov
Model for
Protein Domain 3
Hidden Markov
Model for
Protein Domain N
.
.
.
.
.
.
.
# hits
Genomic Data
SUPFAM Protein Domain Jensen-Shannon
p
1
p
2
p
3
p
N
.
.
.
.
1) Assemble all the organisms' p
2) Compute all Jensen-Shannon-
divergences H
JS
(p
i
, p
j
)
to form a pair-wise distance matrix
3) Use standard distance-tree-methods
such as UPMGA or Neighbor-
Joining to construct tree
(possibly with bootstrapping)
# hits
# hits
# hits
Figure 1: The mapping of a collection of genomes to a
phylogenetic tree. Starting from genomic data we derive
the number of contained protein domains by the Hidden
Markov Models of the SUPFAM database. These values
give rise to a protein domain composition vector ~p for
each species. The species are then compared by pair-wise
distance computations via the Jensen-Shannon-divergence
H
JS
(~p
i
,~p
j
) of the respective protein domain composition
vectors ~p
i
.
measure can be rationalized by a simple model of evo-
lutionary dynamics in the proteome/protein domain
fold space. Derivation of trees from H
JS
-distances can
be achieved with the well-known PHYLIP-package
(Felsenstein, 1989).
2 METHODS
2.1 Genome to Proteome Conversion
Hidden Markov Models (HMMs) form the basis of
the Superfamily database (SUPFAM (Gough et al.,
2001; Wilson et al., 2007)). These HMMs search the
NCBI Entrez Genome database and identify protein
superfamily folds. These folds are based on the Struc-
tural Classification of Proteins database (SCOP) re-
flecting the hierarchy of protein domains in the PDB.
The superfamily level indicates common ancestry.
Each fold identification by the SUPFAM-HMMs
is assigned a measure of the reliability. This quantity
is given as the well-known E-value of confidence. We
applied a threshold on E-values of E ≤ 10
−4
for the
identification of protein domains by the HMMs. In
accordance with a previous study (Yang et al., 2005)
we found a difference in the distances when based on
all HMM results or just the ones below the thresh-
old (see supporting figure S1). As was argued in
(Yang et al., 2005) the choice of E ≤ 10
−4
increases
the accuracy and the robustness of the genome-to-
proteome-mapping. The flow of information is shown
in Figure 1.
2.2 Computation of Distances
The well-known Kullback-Leibler information diver-
gence (MacKay, 2004) measures the relative informa-
tion of a probability distribution q with respect to a
reference distribution p - both defined on the same
event set X .
The Kullback-Leibler-divergence is a universal
measure with a wide range of potential applications,
from information driven sequence analysis (Lund
et al., 2005) to ligand design (Hamacher, 2007c;
Hamacher et al., 2006). Benos, Bulyk, and Stormo
used the Kullback-Leibler-divergence in a validation
study on protein-DNA-interaction and discussed its
relation for closely related distributions to the χ
2
-
distribution (Panayiotis V. Benos, Alan S. Lapedes
and Gray D. Stormo, 2002) - eventually proving that
the Kullback-Leibler-divergence is extensive. The lat-
ter property is most relevant as we can immediately
conclude that in general finite-size-effects will not
play any important role. Burstein et al. in fact used
the Kullback-Leibler-divergence as a distance mea-
sure for sequences of whole genomes (Burstein et al.,
2005).
The Jensen-Shannon entropy was introduced in a
seminal paper by Lin (Lin, 1991) and reads in general
for a parameter λ ∈ [0; 1] :
H
JS
(p, q) := λ ·D
KL
(p
|
λ · p + (1 −λ) ·q) +
(1 −λ) ·D
KL
(q
|
λ · p + (1 −λ) ·q) (2)
Here D
KL
is the Kullback-Leibler-divergence
(MacKay, 2004) and reads D
KL
(p
|
m) :=
∑
i
p
i
· log
2
p
i
m
i
. D
KL
is a relative entropy and H
JS
therefore a linear combination of such entropies. D
KL
itself would not be a suitable distance measure as it is
not symmetric under exchange of its arguments, as in
general D
KL
(p
|
m) 6= D
KL
(m
|
p).
For λ = 1/2 we have, however, H
JS
(p, q) =
H
JS
(q, p) and thus the Jensen-Shannon entropy
H
JS
(p, q) is for this particular λ-value a symmetrized
version of the Kullback-Leibler-divergence.
In addition the properties
• D
KL
(p, q) ≥ 0 and
• D
KL
(p, q) = D
KL
(q, p) if and only if the proba-
bilities p and q are on their domain of definition
equal with probability one (∀
i
p
i
= q
i
).
are inherited by H
JS
(p, q). Note that H
JS
is not a
metric (it does not fulfill the triangle inequality), but
√
H
JS
is (Endres and Schindelin, 2003). Although one
would therefore tend to use
√
H
JS
, we work with H
JS
BIOINFORMATICS 2010 - International Conference on Bioinformatics
116

as it has a direct interpretation in the framework of
stochastic processes and we can therefore give a di-
rect interpretation of the obtained H
JS
-values.
2.3 Construction of the Phylogenetic
Tree based on the Computed
Distance Matrix
The phylogenetic trees were built from the above de-
scribed distances using the Neighbor-Joining-Method
as implemented in the neighbor-program of the
PHYLIP-package (Felsenstein, 1989) which is the
last step of the protocol of figure 1.
Furthermore we performed bootstrapping (Soltis
and Soltis, 2003) on the obtained data using a noise
term of relative change of 5% in the distance values
to mimic potential inaccuracies of the SUPFAM Hid-
den Markov Models or non-complete coverage of the
used genomes or both. Consensus trees were then
again determined with the consensus-program of the
PHYLIP-software and are shown in figures 2 to 6.
3 RESULTS
3.1 Obtained Phylogenetic Relations
As the first fundamental application of phylogenetic
methods we looked at the kingdoms of life (archae,
bacteria, eukaryota). We found a bootstrap support of
100% for the separation of the three domains of life
(Archaea, Bacteria, Eukaryotes). We show this and
the overall emerging picture in figure 2.
We furthermore extracted subtrees for mammals,
insects, and bacillales to illustrate the correctness and
precision of the proposed method. The results are
shown in figures 3, 4, and 5. These trees are in
very good agreement with previously derived classi-
fications, but partially show higher support on some
clades.
Here we want to comment briefly on some addi-
tional aspects observed during these investigations:
• The mammalian consensus tree is accurate, ef-
fectively grouping H. sapiens and P. troglodytes,
putting M. mulatta (Rhesus monkey) in their
neighborhood. Also the pairing of R. norvegicus
and M. musculus is reasonable, suggesting a sub-
tree of rodents if more genomic data were avail-
able. We note in passing that the mammalian tree
did not show much support when we applied Yang
et al.’s procedure on the noisy data described in
the Methods section of this paper. This finding
suggests that our distance measure is somewhat
Figure 2: The separation of the three kingdoms of life ob-
tained with 100% bootstrap support at the major branching
points for all 698 species.
more stable in regard to incomplete, noisy map-
ping of genomes to protein domain fold space /
PDCs.
• For insects the grouping of the two strains of
D. melanogaster and the phylogenetic vicinity of
D. psuedoobscura indicate the consistency of the
methodology presented here. In addition putting
A. aegypti (yellow fever mosquito) and C. pipi-
ens quinquefasciatus (southern house mosquito)
with a perfect support of 100% together is evident
due to their close relationship; this is furthermore
augmented by the nearby A. gambiae (morpholog-
ically indistinguishable mosquitoes).
• For bacillales the methodology presented here is
able to sub-divide the bacillales correctly. As a
first indication we observe that the 12 Staphylo-
coccus aureus strains were correctly put into a
common subtree. Not surprisingly the support
in this subtree at the various branching points
is rather low (some 50 −60%). The support to
separate this subtree from Staphylococcus epi-
dermidis and Staphylococcus haemolyticus is in
contrast again at the perfect 100% level. Other
strains, such as Bacillus licheniformis and Liste-
ria monocytogenes were also put into shared sub-
trees. Some support is rather low in the clade of
Bacillus cereus, Bacillus anthracis, and Bacillus
thuringiensis. This, again, comes as no surprise
as these three organisms are essentially the same,
differing only in their plasmids - which were not
taken into account in this study and therefore
could not support separation in clades.
A somewhat more complicated picture emerges
PROTEIN DOMAIN PHYLOGENIES - Information Theory and Evolutionary Dynamics
117

Ornithorhynchus anatinus
100
Monodelphis domestica
100
Canis familiaris
100
Bos taurus
100
69
Mus musculus
Rattus norvegicus
77
Macaca mulatta
100
Pan troglodytes
Homo sapiens
Figure 3: Phylogenetic tree for mammalian genomes. The
numbers at the arcs indicate the percentage bootstrap sup-
port (with noise) for the clades.
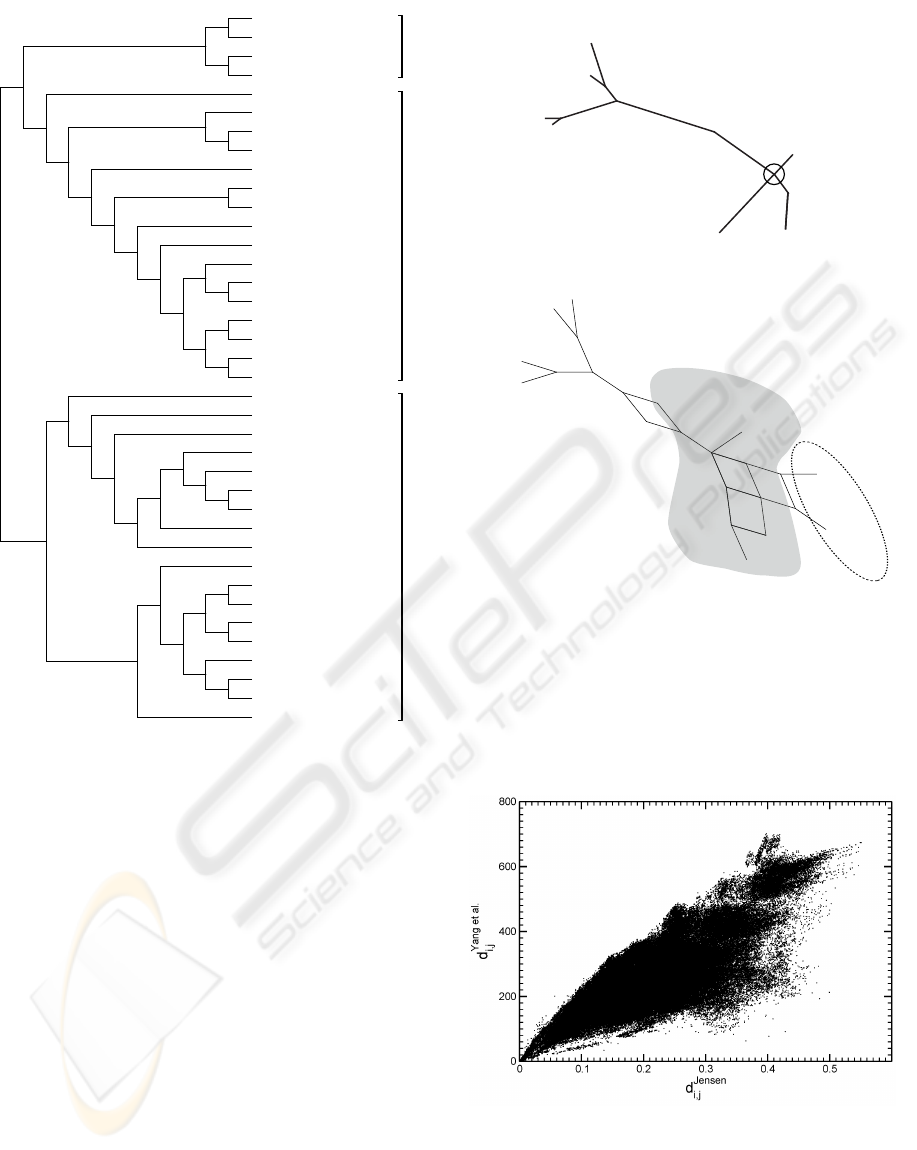
for plants. First we have to acknowledge that - with
respect to the overall number of plants - there are only
a few plant genomes available. This turned out to be
the largest influence on the tree of plants. In figure
6 we show the resulting tree. We found Arabidopsis
thaliana to be key to further discrimination between
monocotyledons and dicotyledons. During the work
the genome of another monocotyledon, Soghorum bi-
color, became available in SUPFAM and we enriched
the data set with the PDC vector of this organism, re-
peated the distance computation, and the derivation
of the phylogenetic tree. The result is shown in the
lower part of figure 6 and indicates a genetic network
between monocotyledon and dicotyledons, while the
previously somewhat unclear position of A. thaliana
is clarified. The placement is resolved by additional
genomes of related organisms. This supports the as-
sertion that the method in general will profit from
larger data sets including closely related organisms.
4 DISCUSSION
We have exemplified - by the plants example - a prop-
erty of the presented method that is at first glance
counterintuitive: the derivation of reasonable tree
Apis mellifera
Bombyx mori
59
100
Drosophila pseudoobscura FB
100
Drosophila melanogaster EN
Drosophila melanogaster FB
99
Nasonia vitripennis
100
Anopheles gambiae
100
Culex pipiens quinquefasciatus
Aedes aegypti
Figure 4: Phylogenetic tree for insects again with percent-
age bootstrap support for the clades. Abbreviations: FB -
FlyBase, EN - Ensmbl.
is simplified by a high number of closely related
genomes. Usually one would assume separating
closely related organisms based on just small differ-
ences in the phylogenetic distance is difficult and puts
a lot of burden on the tree building algorithm. On
the other hand (and this is special to our methodol-
ogy) the denser the ’organism space’ is populated, the
more genomes are available, the more reasonable the
setting of the intermediate ancestor probability dis-
tribution m in equation 1 is. There are indications
that this property is also found in advanced sequence
based approaches (Dunn et al., 2008).
In figure 7 we show distances obtained by our
method and by the one of Yang et al. (Yang et al.,
2005) Obviously there exists a correlation, which im-
plies general agreement. Subtle differences are, how-
ever, also present and give rise to a different distribu-
tion of those values. In figure 8 we show the proba-
bility distribution of those distance measures for the
698 organisms under consideration in this study. The
results of figure 8 point to a richer structure of the
distance values within the all-or-nothing method by
Yang et al. A richer structure implies, however, an
abundance of local optima in the tree generation prob-
lem that the mapping distance matrix −→ tree poses
(it eventually constitutes an optimization problem).
BIOINFORMATICS 2010 - International Conference on Bioinformatics
118
100
100
58
Listeria innocua
Listeria welshimeri
100
Listeria monocytogenes EGDe
Listeria monocytogenes 4b F2365
100
Staphylococcus saprophyticus
100
100
Staphylococcus haemolyticus
100
Staphylococcus epidermidis ATCC 12228
Staphylococcus epidermidis RP62A
Staphylococcus aureus COL
Staphylococcus aureus Newman
Staphylococcus aureus NCTC 8325
Staphylococcus aureus USA300
Staphylococcus aureus RF122
Staphylococcus aureus MRSA252
Staphylococcus aureus MW2
Staphylococcus aureus MSSA476
Staphylococcus aureus Mu50
Staphylococcus aureus N315
Staphylococcus aureus JH1
Staphylococcus aureus JH9
100
Bacillus cereus ssp. cytotoxis NVH 39198
100
Bacillus cereus ATCC 10987
100
Bacillus cereus ATCC 14579
93
30
34
Bacillus cereus E33L
99
Bacillus anthracis Sterne
100
Bacillus anthracis Ames
Bacillus anthracis Ames Ancestor
Bacillus thuringiensis ser. konkukian 9727
Bacillus thuringiensis Al Hakam
100
91
Bacillus clausii
100
100
100
Bacillus subtilis
Bacillus amyloliquefaciens
100
Bacillus licheniformis ATCC 14580a
Bacillus licheniformis ATCC 14580
Bacillus halodurans
100
Geobacillus thermodenitrificans
Geobacillus kaustophilus
Oceanobacillus iheyensis
ListeriaStaphylococcusBacillus
Figure 5: Phylogenetic tree for Bacillales. Again numbers
represent the percentage bootstrap support. Note that B.
cereus, B. thuringiensis, and B. anthracis differ only in their
plasmids, which were not taken into account in the compu-
tation of the phylogenetic distance.
Local optima can lead to problems and suboptimal
trees when applying greedy algorithms such as neigh-
bor joining. Therefore the data in figure 8 suggests
a (partial) resolution by our method of the local op-
tima problem. We expect greedy algorithms to more
reliable applicable on our distance matrices.
In addition perturbations due to errors in the
genome-to-PDC mapping will in general be less rele-
vant if the distribution of distances has fewer features,
because this implies - again - less bias towards local
optima.
4.1 Relation to a Dynamical Model of
Evolution
It can be further shown that the Jensen-Shannon en-
tropies are equivalent to evolutionary distances in a
Arabidopsis
thaliana
Physcomitrella
patens
Ostreococcus
lucimarinus
Ostreococcus
tauri
Chlamydomonas
reinhardtii
Volvox
carteri
Medicago
truncatula
Oryza
sativa
Populus
trichocarpa
Sorghum
bicolor
Vitis
vinifera
Monocotyledons
Dicotyledons
b)
a)
Chlamydomonas
reinhardtii
Physcomitrella
patens
O. tauri
O. lucimarinus
Volvox carteri
f. nagariensis
Vitis
vinifera
Medicago
truncatula
O. sativa
A. thaliana
P. trichocarpa
Figure 6: a) a phylogenetic tree for plants as derived by
the neighboring-joining method. b) Phylogenetic Network
for plants enriched by the newly available genomic data
of Sorghum bicolor, obtained with the splits-decomposition
procedure as implemented in SplitsTree (Huson and Bryant,
2006). The phylogenetic relations are much more accu-
rately determined for the enriched data set which includes
two monocotyledons. This effect is discussed in the text.
Figure 7: Scatter Plot of the Jensen Information Distances
with a threshold and the absolute measure of ref. (Yang
et al., 2005) for all 698 species.
simplistic model of protein domain evolution. To this
end we define: let P
i
and Q
i
be the number of super-
PROTEIN DOMAIN PHYLOGENIES - Information Theory and Evolutionary Dynamics
119

family folds i in two organisms to be compared. Then
P =
∑
i
P
i
and Q =
∑
i
Q
i
is the overall number of folds
within the proteome of the organisms. Then M
i
=
1/2 ·P
i
+ 1/2 ·Q
i
and M =
∑
i
M
i
= 1/2 ·P + 1/2 ·Q
are the value for the average, common ’ancestor’. As
outlined in the Methods section we compute the rela-
tive frequencies of occurrence p
i
= P
i
/P, q
i
= Q
i
/Q,
and m
i
= M
i
/M.
Then we can rewrite the Jensen-Shannon entropy
as
H
JS
(p, q) =
1
2
·
∑
i
p
i
·log
p
i
m
i
+
1
2
·
∑
i
q
i
·log
q
i
m
i
=
1
2
·hlog
p
i
m
i
i
p
+
1
2
·hlog
q
i
m
i
i
q
=
1
2
·
hlog
P
i
M
i
i
p
−hlog
P
M
i
p
+hlog
Q
i
M
i
i
q
−hlog
Q
M
i
q
=
1
2
·
hlog
P
i
M
i
i
p
−log
P
M
+
hlog
Q
i
M
i
i
q
−log
Q
M
(3)
where h. ..i
p,q
indicates the expectation value of the
argument with respect to the probability distributions
p and q, respectively. If we now assume simplis-
ticly that the underlying evolutionary process of do-
main losses and gains is of Poisson character, then
Fukami-Kobayashi et al. (Fukami-Kobayashi et al.,
2007) have argued that ratio like log
P
M
is the evolu-
tionary time/distance it took to get from the PDC m
to p. Similarly the fold specific terms log
P
i
M
i
are the
evolutionary times it took to gain or lose specific folds
in the class i and change their respective counts from
M
i
to P
i
. The expectation value over these individ-
ual terms is the expected evolutionary time sampled
from the overall protein domain compositions. Then
the term hlog
P
i
M
i
i
p
−log
P
M
reflects the diversification
of the PDC of p. Analogously the same applies to the
q-term. As the PDCs are (simplified) descriptors of
the organism’s proteome we propose that the Jensen-
Shannon divergence as used here shows also the di-
versification of the overall proteomes/protein domain
composition.
Therefore H
JS
(p, q) can be regarded as the ex-
pected divergence time of the composition of the pro-
teomes of organisms p and q with respect to an al-
leged ancestor m. Besides the a priori, information
theoretically driven motivation of using H
JS
(p, q) we
can therefore further rationalize about H
JS
(p, q) as an
indicator of time scales between evolutionary branch-
ing events.
Clearly if any two organisms have the same num-
ber of superfamily folds i (read ∃
i
P
i
= Q
i
⇐⇒ M
i
=
P
i
∧M
i
= Q
i
) then this particular superfamily does not
contribute to the distance; thus the Jensen-Shannon-
entropy incorporates to some extent the idea of previ-
ous studies, which stressed the importance of shared
folds.
4.2 Summary
In this paper we have motivated a new measure
of similarity of proteomes that can be rationalized
by information theory. We have shown this mea-
sure to be a meaningful refinement of previous ap-
proaches to whole-genome phylogeny. The advan-
tages in comparison to – say – 16S-RNA-phylogenies
are manifold: 1) the natural unit of evolutionary
dynamics was argued to be protein domain cre-
ation/deletion/’invention’, thus making much longer
time scales accessible in comparison to a dynamics
based on single nucleotide differences; 2) our method
also proved to be more robust against variations in the
distances that might occur due to errors in the used
HMMs among others; 3) besides its motivation from
information theory our model can also be justified
from a simplified model of evolutionary dynamics; 4)
another major advantage is that there is no need for
any sequence alignment.
The last property is even more relevant as the
quest for ’the correct’ alignment procedure is still an
open and sometimes troublesome issue in the field
of alignment based phylogenies (Morrison and Ellis,
1997; Martin et al., 2007; Rokas, 2008) – it need
not be addressed when applying our protocol to ge-
nomic data. Alignments are only involved in the sug-
gested procedure insofar as they are implicitly con-
tained within the used Hidden Markov Models, but
these are not error-prone and remedy the alignment
problem therefore.
Conceptually proteomic and other protein-based
phylogenies incorporate the effect of various evolu-
tionary ”operators” of large complexity (e.g. selection
and horizontal gene transfer). Methods focused solely
on genomic subsequences, on the other hand, put
more emphasis on mutational events, thus they have
to map the above mentioned complex mechanisms
into single nucleotide changes. Sequence-based ap-
proaches based on algorithmic information theory
and Kolmogorv complexity are conceptually able to
overcome this problem. The complexity measures
are, however, not computable (Li and Vit
´
anyi, 1997;
Kolmogorov, 1965; Solomonoff, 1964a; Solomonoff,
1964b); they must rather be approximated.
Horizontal gene transfer in particular still poses a
BIOINFORMATICS 2010 - International Conference on Bioinformatics
120

0 0.2 0.4
0.6
0.8 1
d
rel
0
0.1
0.2
0.3
0.4
0.5
0.6
0.7
0.8
0.9
1
P(d<d
rel
)
Jensen
Yang et al.
0 0.2 0.4
0.6
0.8 1
d
rel
0
0.01
0.02
0.03
0.04
p(d
rel
)
Figure 8: Cumulative distribution P
d
i, j
rel
< d
of the rela-
tive distances d
i, j
rel
:=
d
i, j
−min
(
d
i, j
)
max(d
i, j
)−min(d
i, j
)
for both methods and
all 698 species pairs (i, j). Here d denotes the respective
distance measure. The lower inset shows a blow-up of the
lower portion of the cumulated distribution, while the up-
per inset is the distribution itself – one can clearly see the
greater richness in structure (larger variation in the slopes)
of the distribution of the distance measure by Yang et al.,
thus indicating more and steeper minima (compare to in-
set).
great challenge to all algorithmic approaches in phy-
logenetics (Wolf et al., 2002; Snel et al., 2005).
4.3 Outlook
The search for the ’perfect’ phylogenetic tree con-
struction algorithm, based on distance matrices, is
still ongoing (Woolley et al., 2008). In the fu-
ture we want to combine our distance measure
with established tree construction algorithms besides
neighboring-joining and other greedy approaches.
The application of global optimization protocols
(Hamacher, 2007a; Hamacher, 2006; Wenzel and
Hamacher, 1999; Hamacher, 2007b) on e.g. weighted
least square minimization (Makarenkov and Leclerc,
1999; Makarenkov, 2001) can in principle provide for
a better quality of the mapping distance matrix −→
phylogenetic trees. The combination of this idea with
the distance measure introduced above promises to be
even more powerful.
ACKNOWLEDGEMENTS
KH gratefully acknowledges financial support by the
Fonds der Chemischen Industrie through the program
Sachkostenzuschuß f
¨
ur den Hochschullehrernach-
wuchs. KH gratefully acknowledges support by
D. Quandt in the usage of the TreeGraph-package,
with which some of the phylogenetic trees in this pa-
per were drawn. The author is grateful for W. We-
ber’s hospitality at the Technical University Dort-
mund, where this paper was partially written. KH
thanks J. Stolze for helpful comments on the paper.
Supporting Files Supporting Figure S1 — Com-
paring Jensen Information Distances for Hidden
Markov Models with/without threshold: Scatter Plot
of the Jensen Information Distances for all 698
species for the distributions of domains without a
threshold and a threshold of E ≤ 10
−4
.
Competing interests.
The author declares that no competing interests exist.
REFERENCES
http://bioserver.bio.tu-darmstadt.de/Phylogeny
Burstein, D., Ulitsky, I., Tuller, T., and Chor, B. (2005). In-
formation theoretic approaches to whole genome phy-
logenies. In RECOMB, pages 283–295.
Dunn, C. W., Hejnol, A., Matus, D. Q., Pang, K., Browne,
W. E., Smith, S. A., Seaver, E., Rouse, G. W., Obst,
M., Edgecombe, G. D., Sorensen, M. V., Haddock,
S. H. D., Schmidt-Rhaesa, A., Okusu, A., Kristensen,
R. M., Wheeler, W. C., Martindale, M. Q., and Giribet,
G. (2008). Broad phylogenomic sampling improves
resolution of the animal tree of life. Nature, 452:745–
749.
Ekman, D., Bj
¨
orklund,
˚
A. K., and Elofsson, A. (2007).
Quantification of the elevated rate of domain rear-
rangements in metazoa. J. Mol. Biol., pages 1337–
1348.
Endres, D. and Schindelin, J. (2003). A new metric
for probability distributions. IEEE Trans Info Theo,
49:1858–1860.
Felsenstein, J. (1989). PHYLIP - phylogeny inference pack-
age (version 3.2). Cladistics, 5:164–166.
Fong, J. H., Geer, L. Y., Panchenko, A. R., and Bryant, S. H.
(2007). Modeling the evolution of protein domain ar-
chitectures using maximum parsomony. J. Mol. Biol.,
pages 307–315.
Fukami-Kobayashi, K., Minezaki, Y., Tateno, Y., and
Nishikawa, K. (2007). A Tree of Life Based on
Protein Domain Organizations. Mol. Biol. Evol.,
24(5):1181–1189.
Gerstein, M. (1998). Patterns of protein-fold usage in eight
microbial genomes: A comprehensive structural cen-
sus. Proteins: Structure, Function, and Genetics,
33:518–534.
Gough, J., Karplus, K., Hughey, R., and Chothia, C. (2001).
Assignment of homology to genome sequences using
a library of hidden markov models that represent all
proteins of known structure. J Mol Biol, 313(4):903–
919.
PROTEIN DOMAIN PHYLOGENIES - Information Theory and Evolutionary Dynamics
121

Grosse, I., Bernaola-Galvan, P., Carpena, P., Romain-
Roldan, R., and Oliver, J. e. (2002). Analysis of sym-
bolic sequences using the jensen-shannon divergence.
Phys Rev E, 65:041905.
Hamacher, K. (2006). Adaptation in stochastic tunneling
global optimization of complex potential energy land-
scapes. Europhys. Lett., 74(6):944–950.
Hamacher, K. (2007a). Adaptive extremal optimization
by detrended fluctuation analysis. J.Comp.Phys.,
227(2):1500–1509.
Hamacher, K. (2007b). Energy landscape paving as a per-
fect optimization approach under detrended fluctua-
tion analysis. Physica A, 378(2):307–314.
Hamacher, K. (2007c). Information theoretical measures to
analyze trajectories in rational molecular design. J.
Comp. Chem., 28(16):2576–2580.
Hamacher, K., H
¨
ubsch, A., and McCammon, J. A. (2006).
A minimal model for stabilization of biomolecules
by hydrocarbon cross-linking. J. Chem. Phys.,
124(16):164907.
Huson, D. H. and Bryant, D. (2006). Application of phy-
logenetic networks in evolutionary studies. Mol. Biol.
Evol., 23(2):254–267.
Kolmogorov, A. N. (1965). Three approaches to the quanti-
tative definition of information. Problems of Informa-
tion and Transmission, 1(1):1–7.
Li, M., Badger, J., Xin, C., Kwong, S., and Kearney, P. e.
(2001). An information based sequence distance and
its application to whole mitochondrial genome phy-
logeny. Bioinformatics, 17:149–154.
Li, M., Chen, X., Li, X., Ma, B., and Vitanyi, P. (2004). The
similarity metric. IEEE Trans Info Theo, 50:3250–
3264.
Li, M. and Vit
´
anyi, P. (1997). An Introduction to Kol-
mogorov Complexity and Its Applications. Springer,
New York.
Lin, J. (1991). Divergence measures based on the shannon
entropy. IEEE Trans. Inform. Theory, 37(1):145–151.
Lund, O., Nielsen, M., Lundegaard, C., and Brunak, C.
K. S. (2005). Immunological Bioinformatics. MIT
Press, Cambridge.
MacKay, D. (2004). Information Theory, Inference, and
Learning Algorithms. Cambridge University Press,
Cambridge, 2. edition.
Makarenkov, V. (2001). T-REX: reconstructing and visu-
alizing phylogenetic trees and reticulation networks.
Bioinformatics, 17(7):664–668.
Makarenkov, V. and Leclerc, B. (1999). An algorithm
for the fitting of a phylogenetic tree according to a
weighted least-squares criterion. J. Class., 16(1):3–
26.
Mantaci, S., Restivo, A., and Sciortino, M. (2008). Dis-
tance measures for biological sequences: Some recent
approaches. Int J Approx Reasoning, 47:109–124.
Martin, W., Roettger, M., and Lockhart, P. J. (2007). A real-
ity check for alignments and trees. Trends in Genetics,
23:478–480.
Morrison, D. and Ellis, J. (1997). Effects of nucleotide
sequence alignment on phylogeny estimation: a case
study of 18S rDNAs of apicomplexa. Mol Biol Evol,
14(4):428–441.
Otu, H. and Sayood, K. (2003). A new sequence distance
measure for phylogenetic tree construction. Bioinfor-
matics, 19:2122–2130.
Panayiotis V. Benos, Alan S. Lapedes and Gray D. Stormo
(2002). Probabilistic Code for DNA Recognition by
Proteins of the EGR family. J. Mol. Biol., 323:701–
727.
Philippe, H., Delsuc, F., Brinkmann, H., and Lartillot, N.
(2005). Phylogenomics. Annual Review of Ecology,
Evolution, and Systematics, 36(1):541–562.
Rokas, A. (2008). GENOMICS: Lining Up to Avoid Bias.
Science, 319(5862):416–417.
Snel, B., Huynen, M. A., and Dutilh, B. E. (2005). Genome
trees and the nature of genome evolution. Annu. Rev.
Microbiol., 59(1):191–209.
Solomonoff, R. J. (1964a). A formal theory of inductive
inference. Information and Control, 7:1–22.
Solomonoff, R. J. (1964b). A formal theory of inductive
inference. Information and Control, 7:224–254.
Soltis, P. S. and Soltis, D. E. (2003). Applying the bootstrap
in phylogeny reconstruction. Statist. Sci., 18(2):256–
267.
Tekaia, F., Lazcano, A., and Dujon, B. (1999). The Ge-
nomic Tree as Revealed from Whole Proteome Com-
parisons. Genome Res., 9(6):550–557.
Wenzel, W. and Hamacher, K. (1999). A Stochastic tun-
neling approach for global minimization. Phys. Rev.
Lett., 82(15):3003–3007.
Wilson, D., Madera, M., Vogel, C., Chothia, C., and Gough,
J. (2007). The superfamily database in 2007: fam-
ilies and functions. Nucleic Acids Res, 35(Database
issue):308–313.
Woese, C. R. (2000). Interpreting the universal phyloge-
netic tree. Proc. Nat. Acad. Sci., 97(15):8392–8396.
Woese, C. R. (2002). On the evolution of cells. Proc. Nat.
Acad. Sci., 99(13):8742–8747.
Wolf, Y., Rogozin, I., Grishin, N., and Koonin, E. (2002).
Genome trees and the tree of life. Trends in Genetics,
18(9):472–479.
Woolley, S. M., Posada, D., and Crandall, K. A. (2008).
A comparison of phylogenetic network methods using
computer simulation. PLoS ONE, 3(4):e1913.
Yang, S., Doolittle, R. F., and Bourne, P. E. (2005). Phy-
logeny determined by protein domain content. Proc.
Nat. Acad. Sci., 102(2):373–378.
Zhang, Y. and Skolnick, J. (2005). The protein structure
prediction problem could be solved using the current
PDB library. Proc. Nat. Acad. Sci., 102(4):1029–
1034.
BIOINFORMATICS 2010 - International Conference on Bioinformatics
122
