
DISTRIBUTED FREQUENCY SORTING IN SPECTRAL VIDEO
ANALYSIS OF DNA SEQUENCES
Anca Bucur, Jasper van Leeuwen
Philips Research Europe, High Tech Campus 37,Eindhoven, The Netherlands
Nevenka Dimitrova
Philips Research USA, Briarcliff Manor, NY 10510, U.S.A.
Keywords: Genomic signal processing, DNA spectral analysis, Spectral alignment, Frequency sorting, Distributed
computing.
Abstract: DNA spectral analysis, i.e. the analysis of DNA spectrograms, has been proposed as a method to
systematically investigate DNA patterns, which may correspond to relevant biological features. The
Frequency Sorting method sorts the sequences in spectral domain based on their frequency content, and
detects and groups those sequences exhibiting one or more strong patterns in the same frequencies. In this
paper we propose a novel distributed algorithm for Frequency Sorting and report on the performance results
of our implementation for the alignment in spectral domain of the human chromosome 21. Distributed
Frequency Sorting enables efficient spectral alignment and allows for the easy detection of strong patterns
in both single and multiple frequencies.
1 INTRODUCTION
Currently, there are few systematic tools available
that may enable the exploration of genomic
frequency patterns in biological events. One such
tool is spectral analysis. This technique can be used
in phylogenetic (evolutionary conservation) studies
and potentially for the discovery of sequence
properties in the frequency domain that are not
detectable by current “string-space” linear alignment
methods.
Spectrogram extraction of DNA sequences has
been proposed in (Anastassiou, 2000). DNA
spectrograms are generated by converting DNA
sequences to binary indicator sequences and then
applying the short term Fourier transform and
mapping to a colour space to visualize the output. It
is however not possible to fit the frequency
spectrum of a very long DNA sequence, with
millions of nucleotides, into a single spectrogram
frame. This issue has been addressed by
SpectroVideo (Santo, 2007).
The problem with a spectral image is that for
long sequences it is very difficult to spot patterns
that appear throughout the genome. Automatic
methods for mining DNA spectra were also
proposed using standard hierarchical clustering
algorithms. However, there are several problems
related to using these methods for large scale
comparisons: 1) large memory space is needed, as
each spectral window is compared to all other
windows, 2) due to global metrics used, the output
may only have global frequency similarity, but
strong individual frequency similarity would not be
detected, and 3) the algorithms are not conducive to
parallelization.
In (Bucur, 2008) we have proposed a method that
sorts the sequences in spectral domain based on their
frequency content, and detects and groups those
sequences exhibiting one or more patterns in the
same frequencies. Such a sorting algorithm is more
suited for spectral analysis than clustering
algorithms because we aim at aligning sequences
based on long patterns in individual frequencies. In
the case of DNA spectrograms, the content in
distinct frequencies needs to be analyzed
individually and not combined in a global distance
metric, as is the case for DNA sequence alignment.
As patterns are searched in individual frequencies,
our Frequency Sorting method is also well suited for
207
Bucur A., van Leeuwen J. and Dimitrova N. (2010).
DISTRIBUTED FREQUENCY SORTING IN SPECTRAL VIDEO ANALYSIS OF DNA SEQUENCES.
In Proceedings of the First International Conference on Bioinformatics, pages 207-210
DOI: 10.5220/0002713302070210
Copyright
c
SciTePress

parallelization.
In this paper we propose a distributed algorithm
for Frequency Sorting of DNA spectrograms that
achieves efficient and scalable distribution of the
computation, enabling significant speedup and
allowing the processing and analysis of large
genomic sequences, such as entire genomes. We
report the performance of the distributed Frequency
Sorting implementation in terms of speedup and
execution time, when applied to the entire human
chromosome 21 for several sets of parameters.
2 RELATED WORK
In (Anastassiou, 2000) an optimization procedure
improving upon traditional Fourier analysis
performance in detecting coding regions in DNA
sequences is introduced. Color spectrograms of
biomolecular sequences are used as visualization
tools providing information about the local nature,
structure and function of the sequences. Color maps
help visually identifying protein coding areas for
both DNA strands, but also the coding direction and
the reading frame for each of the exons.
In (Sussillo, 2004) a slightly modified version of
the spectrogram development tool is applied to
explore patterns characteristic in the genomes of
various organisms (among which E. coli, M.
tuberculosis, C. elegans, D. melanogaster and H.
sapiens). Interesting features were detected, some of
which are common to all organisms and some are
unique to a particular organism.
In (Santo, 2007) the spectral analysis tool was
improved with hierarchical clustering in order to
optimize the viewing of spectra and to detect
patterns in large amounts of sequence data.
3 THE FREQUENCY SORTING
METHOD
The Frequency Sorting method and several
algorithms used for sorting have been described in
detail in (Bucur, 2008). Frequency Sorting
comprises the following steps:
• Create a Spectrogram
• Apply a Binning Function and Build
Frequency Histograms
• Sorting
• Visualization using SpectroVideo
In this paper we apply our Top Down Hierarchical
Sorting (TDHS) algorithm to sort the DNA
spectrogram. The intuitive visual representation
makes it easy to detect patterns. Once interesting
patterns have been detected, the actual Fourier
values, mapped to colours in the SpectroVideo,
should also be taken into account for an accurate
analysis.
4 THE DISTRIBUTED FS
ALGORITHM
Combining Frequency Sorting with SpectroVideo
supports the discovery of novel frequency patterns
in large genomic repositories of sequences.
Applying Frequency Sorting to a large dataset is
very data-intensive, requiring large amounts of
computations and memory. Additionally, a large
number of experiments, varying the values several
parameters (window size, bin size, window overlap,
threshold of Fourier values), need to be run in order
to detect all relevant patterns. Therefore, an
algorithm needs to be designed that allows an
efficient distribution of the data and of the
computations, exploiting the potential for
parallelization.
In each iteration of FS, the bin sizes are
computed for each frequency and nucleotide
independently. The bin values are then compared
across all frequencies and nucleotides, and based on
the result of the comparison the domain of windows
is split and reordered. As histograms are built per
frequency and nucleotide, it is very efficient to split
the same way the data domain of Fourier values
among several processors and to build the
histograms in parallel.
In our algorithm, a distributor node is
responsible for distributing the sub-domains of the
dataset among several worker nodes. The largest
source of overhead in the algorithm is the initial
distribution of the Fourier values corresponding to
the assigned frequencies to the worker nodes. Each
worker node is assigned a set of frequencies (one or
more) for which to compute at each iteration step the
bin sizes and build the histograms, and receives the
Fourier values in those frequencies across all
windows. The resulting histograms are compared
among the worker nodes and a decision concerning
the split of the domain is taken. To minimize the
overhead of data transfer, the frequencies are
assigned at the beginning of the execution and will
not change. The Fourier values are distributed per
BIOINFORMATICS 2010 - International Conference on Bioinformatics
208
frequency in a round robin fashion to the worker
nodes.
Iteratively, each worker node builds the
histograms and chooses the largest bin out of all its
assigned frequencies and nucleotides and
communicates that information to the distributor.
In our implementation, it is the role of the
distributor to choose a global winning bin (i.e. the
largest bin in all frequencies) and to communicate
the corresponding frequency and the windows
contributing to the bin (i.e., the new split into
groups) to the worker nodes. Next, all worker nodes
split their windows the same way and reiterate the
computation of the histograms in each of the new
sub-groups of windows for the frequencies assigned
to them.
The bins can be computed at each step by
scanning the entire set of values corresponding to a
frequency and to the four nucleotides, or they can be
updated in each iteration based on the current split
of the domain. In the implementation used for
experiments bins are re-computed at each split.
The distributed FS algorithm enables efficient,
flexible and scalable sorting and alignment of
increasing sequence sizes, including entire genomes.
As with DNA spectrograms the window size
influences the size of the patterns that are visualized,
the spectral alignment and the analysis need to be
carried out for many window sizes. The spectral
alignment (and the execution time of the algorithm)
is also influenced by the chosen bin size and several
bin sizes need to be used in experiments.
5 EXPERIMENTAL RESULTS
We have evaluated our algorithm on a computer
cluster with 4 quad-core Intel(R) Xeon(R) CPUs at
2.66GHz and with 16 GB RAM, running Linux. The
intra-cluster communication is ensured by standard
1000baseT/Full Ethernet network. Message passing
interface (MPI) is used for communication in the
parallel implementation.
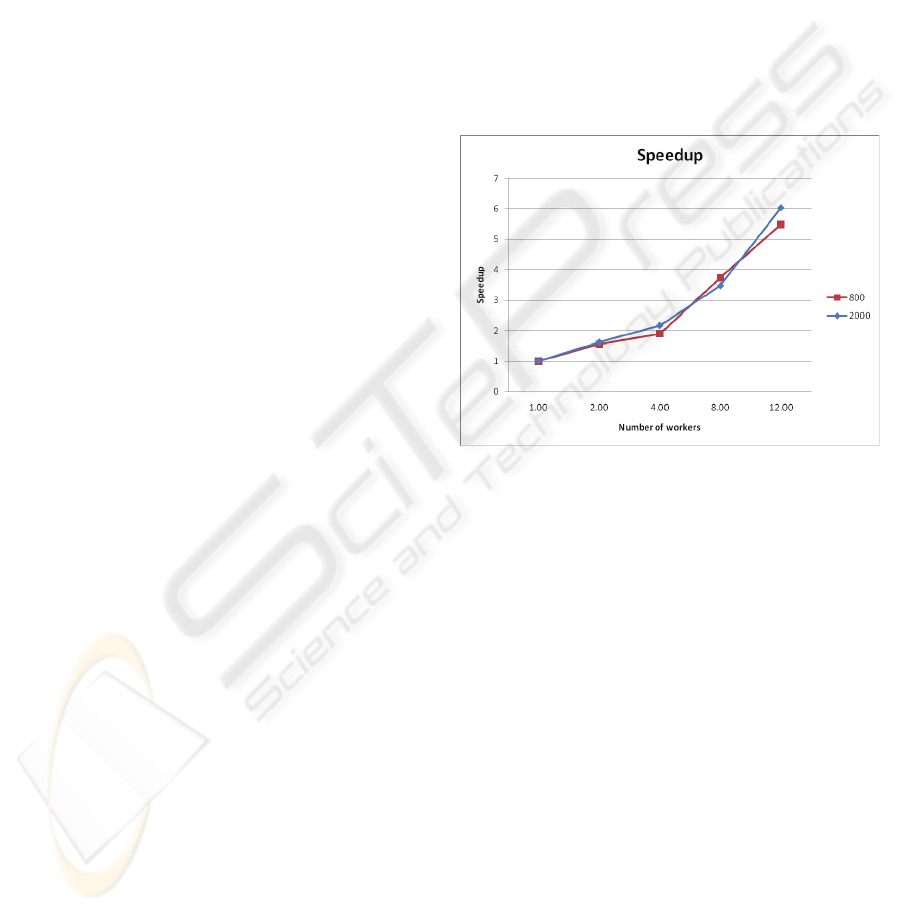
Figure 1 depicts the speedup of our
implementation of distributed FS for chromosome
21, and window sizes of 800 and 2000, and bin
sized of 15 and 25, respectively. The source of the
sequence and of the annotation, is the NCBI’s
Human genome assembly of March 2006. For up to
12 worker nodes the application exhibits very
good performance and scales linearly with the
number of processors, for all window sizes and bin
sizes. There is however some communication and
synchronization overhead related to the selection of
the winning bins. Fast intra-cluster links could
additionally improve the performance.
Figure 2 combines four consecutive frames of the
spectral video corresponding to the alignment of the
human chromosome 21 for a window size of 800
and a bin size of 15, with non-overlapping bins.
Each frame represents 200 frequencies for a good
visibility of all frequency values. The frames exhibit
several long strong patterns combined in two wide
bands, including a strong 2.5 periodicity indicating a
coding region. These patterns shows best with a bin
size of 15, and become weaker for both smaller and
larger bin sizes. The patterns also show weaker for a
window size of 2000.
Figure 1: Speedup of the distributed FS application.
6 CONCLUSIONS AND FUTURE
WORK
Clustering algorithms currently used for sequence
alignment are not suitable for spectral analysis,
where we need to find patterns at individual
frequencies throughout a single genome or across
known genomes. The spectral sorting approach
addresses data intensive genomic applications that
have insatiable needs for exploring the available
data from the various genome sequencing projects.
Our distributed algorithm uses the characteristics
of the DNA spectrogram dataset and of Frequency
Sorting to achieve high performance and low
overhead. We have run the distributed FS algorithm
for the human chromosome 21, for several window
and bin sizes. In all cases the speedup of the
application was linear.
In our future work, in order to reduce the human
DISTRIBUTED FREQUENCY SORTING IN SPECTRAL VIDEO ANALYSIS OF DNA SEQUENCES
209
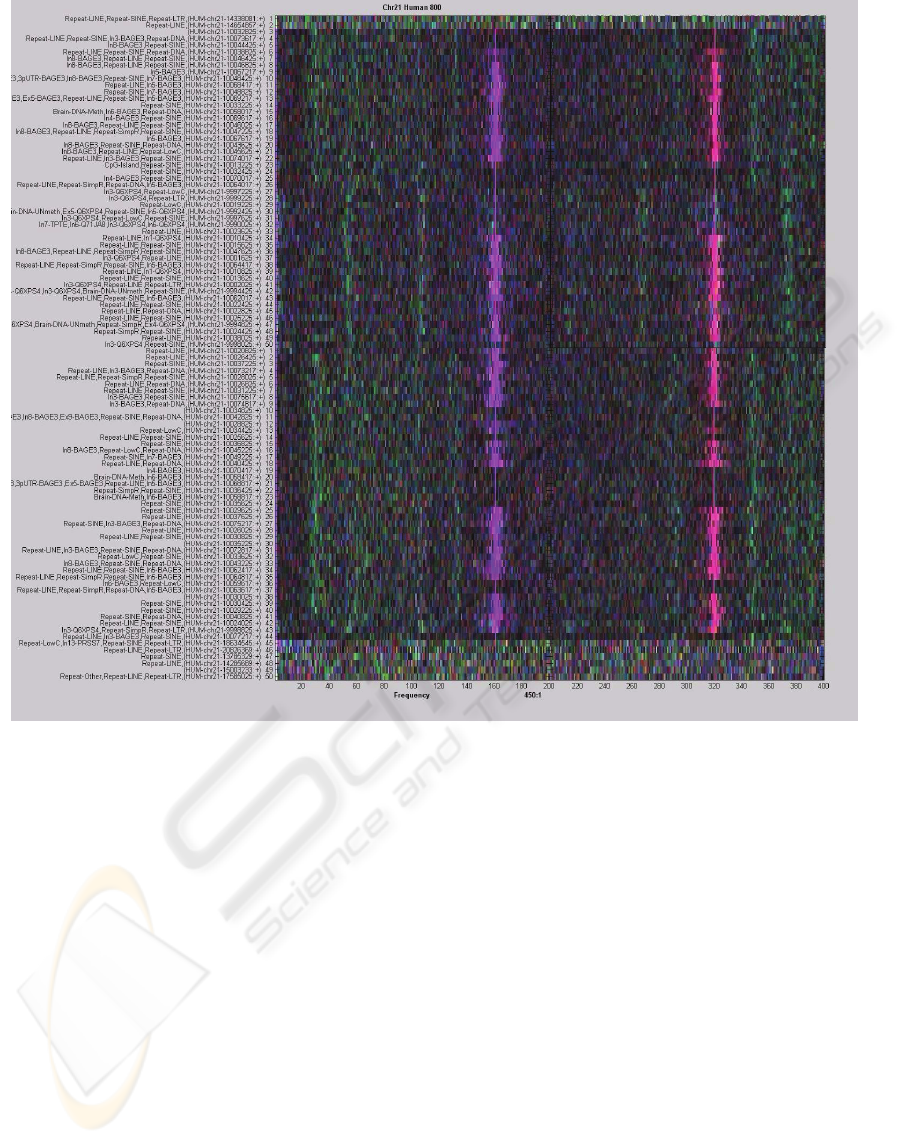
Figure 2: Four consecutive frames combined, exhibiting strong long patterns in several frequencies.
effort required for the analysis of the spectral
images, we will investigate the automatic data
mining on clusters to detect relevant features. In
addition, we will apply distributed Frequency
Sorting to align and enable the analysis and
comparison of the spectra of several entire genomes.
REFERENCES
D. Anastassiou, 2000. Frequency-domain analysis of
biomolecular sequences. In Bioinformatics 16(12), p.
1073-1081, 2000.
A. Bucur et al., 2008. A Frequency Sorting Method for
Spectral Analysis of DNA Sequences. In BIBM, 2008.
E. Santo et al., 2007. Improvement of Spectral Analysis as
a Genomic Analysis Tool. In IEEE Workshop on
Genomic Signal Processing and Statistics, p. 1-4,
2007.
D. Sussillo et al., 2004. Spectrogram Analysis of
Genomes. In EURASIP Journal on Applied Signal
Processing, Special Issue on Genomic Signal
Processing 2004 (1), p. 29-42, 2004.
BIOINFORMATICS 2010 - International Conference on Bioinformatics
210
