
MATLAB SOFTWARE FOR DETRENDED FLUCTUATION
ANALYSIS OF HEART RATE VARIABILITY
Fernanda S. Leite
1
, Adson F. da Rocha
1,2
and Jo
˜
ao L. A. Carvalho
1,2
1
Department of Electrical Engineering, University of Bras
´
ılia, Bras
´
ılia–DF, Brazil
2
UnB-Gama Faculty, University of Bras
´
ılia, Bras
´
ılia–DF, Brazil
Keywords:
Detrended fluctuation analysis, DFA, Heart rate variability, HRV.
Abstract:
The analysis of heart rate variability (HRV) is an important tool for the assessment of the autonomic regulation
of circulatory function. HRV analysis is usually performed using methods that are based on the assumption
that the signal is stationary within the experiment duration, which is generally not true for long-duration signals
(e.g., 24-hour Holter) or signals acquired during stress tests. This paper presents a Matlab tool for detrended
fluctuation analysis (DFA) of HRV signals. DFA is applicable in the context of nonstationary signals, since
it involves removing fluctuation trends from the signal. The software is validated using simulated signals
with different power-law characteristics, and then demonstrated using real HRV signals, obtained from three
groups of subjects: healthy volunteers, individuals with Chagas disease, and individuals with mild to moderate
hypertension.
1 INTRODUCTION
The analysis of heart rate variability (HRV) is an im-
portant tool to the assessment of the autonomic regu-
lation of circulatory function. HRV is especially use-
ful for assessing sympathovagal balance (Malik and
Camm, 1995). Changes in HRV have been associated
with different pathological conditions, such as hyper-
tension, Chagas disease, hemorrhagic stroke, and sep-
tic shock. HRV is also useful as a predictor of post-
infarction mortality.
HRV is typically studied by analyzing the vari-
ability of the intervals between two consecutive heart-
beats. Most commonly, these are calculated by mea-
suring the RR intervals, i.e., the interval between two
consecutive R waves in the electrocardiogram. The
most popular techniques for analysis of HRV include
time domain analysis (e.g., coefficient of variation,
pNN50, RMSSD) (Malik and Camm, 1995; Ander-
son, 1992), frequency domain analysis (e.g., Fourier
transform, auto-regressive model, Lomb-Scargle peri-
odogram) (Malik and Camm, 1995; Anderson, 1992;
Shin et al., 1994), and geometrical techniques (e.g.,
Poincar
´
e plot, trend analysis) (Piskorski and Guzik,
2007; Schechtman et al., 1992). Such techniques
require the signal to be stationary within the ex-
periment duration, i.e., the variability characteris-
tics cannot change considerably throughout the sig-
nal. This is typically an issue when analyzing long
duration signals (e.g., 24-hour Holter) or stress test
signals (e.g., physical tests, cold pressor, Valsalva
maneuver). Alternative techniques include time-
frequency approaches, using, for example, the short-
time Fourier transform, the auto-regressive spectro-
gram, or wavelet transforms (Carvalho et al., 2003).
However, means for quantifying the information ex-
tracted from these techniques have not been well es-
tablished. Different computational tools have been
presented for the analysis of HRV (Carvalho et al.,
2002; Carvalho et al., 2003; Niskanen et al., 2004),
and were important in popularizing the use of these
techniques.
In 1995, Peng et al. proposed the use of detrended
fluctuation analysis (DFA) for analysis of HRV (Peng
et al., 1995). DFA is applicable in the context of
nonstationary signals, since it involves removing fluc-
tuation trends from the signal. The result of DFA
is quantified by two coefficients (α
1
and α
2
), which
reflect short-term and the long-term fluctuations, re-
spectively. Peng et al. showed that DFA coefficients
are capable of discriminating healthy subjects and in-
dividuals with congestive heart failure. The HRV
computational tools mentioned above do not imple-
ment this type of analysis. This contributes to its lim-
ited use by the scientific community.
In this work, we present a computational tool for
225
S. Leite F., F. da Rocha A. and L. A. Carvalho J. (2010).
MATLAB SOFTWARE FOR DETRENDED FLUCTUATION ANALYSIS OF HEART RATE VARIABILITY.
In Proceedings of the Third International Conference on Bio-inspired Systems and Signal Processing, pages 225-229
DOI: 10.5220/0002713602250229
Copyright
c
SciTePress

detrended fluctuation analysis of heart rate variabil-
ity. The presented software is validated using sim-
ulated signals with different power-law characteris-
tics: white noise, pink noise (1/ f ), and Brownian
noise (1/ f
2
). Then, the tool is demonstrated using
real HRV signals, obtained from three groups of sub-
jects: healthy volunteers, individuals with Chagas dis-
ease, and individuals with mild to moderate hyperten-
sion. The presented tool can help popularize the use
of DFA for analysis of HRV signals, making it eas-
ier to study nonstationary signals such as those from
long-duration exams and from tests involving variable
stress conditions.
2 THEORY
Intervals between cardiac beats vary in a complex
manner, presenting exponential correlations. De-
trended fluctuation analysis is a method that allows
the detection of long-range correlations embedded in
an irregular signal, and avoids spurious detection of
apparent long-range correlations that are an artifact
to the object of the analysis (Peng et al., 1995). In
the context of HRV, DFA allows the distinction be-
tween complex fluctuations intrinsic to the nervous
system in the command of vital actions of the hu-
man body, and those originated on the environment
and that also influence the heart rate. Those fluctua-
tions that are intrinsic to the nervous system happen
to be observed throughout the signal, as opposed to
the extrinsic fluctuations that present local and short-
term effects. The main objective of DFA is to extract
the extrinsic fluctuations in order to allow the analysis
of the signal’s variability associated exclusively with
autonomic control (Peng et al., 1995).
The first step in the calculation of the DFA coeffi-
cients is the subtraction of the DC component of the
signal (mean RR interval). The resulting signal is then
integrated, as follows:
y(k) =
k
∑
i=1
[RR(i) − RR
ave
], (1)
where RR(i) is the duration of the i-th RR interval,
RR
ave
is the mean interval, and k is the current output
sample time-index.
The integrated signal y(k) is then segmented into
multiple windows of length n. For each of these win-
dows, a least-squares first-order approximation (a line
segment) is calculated, representing the “trend” of
that segment of the signal. The trend signal y
n
(k),
formed by the line segments, is an approximation to
the integrated signal y(k). The detrended signal e(k)
is the approximation error, i.e.,
e(k) = y(k) − y
n
(k). (2)
Thus, the root mean squared approximation error for
a particular window of length n is
F(n) =
s
1
N
N
∑
k=1
e(k)
2
, (3)
where N is the total number of RR intervals, i.e., the
length of RR(i).
F(n) is calculated for several different window
lengths. As the window length increases, the approx-
imation error typically increases. Thus, F(n) is gen-
erally a monotonically increasing function. By an-
alyzing the relationship between window length and
approximation error, it is possible to verify the pres-
ence of fractal characteristics in the signal. If F(n)
is an exponential function of n, then a linear relation
is observed in log-log scale. When this is the case, it
can be said that the signal presents a scale-invariant
(fractal) correlation property. Under such conditions,
HRV fluctuations can be characterized by a coefficient
α, which corresponds to the slope of the line relating
log(F(n)) to log(n).
Although DFA is of great utility in the detection
and classification of different pathologies in long du-
ration signals, it is important to provide the possibil-
ity of analyzing short duration signals, as those typi-
cally used in classical HRV analysis (e.g., 5 minute
segments). Typically, short duration HRV signals
display different correlation properties for short win-
dows (n ≤ 16) and for long windows (n > 16) (Peng
et al., 1995). This cross-over phenomenon is typically
observed in the log-log plot of F(n) as a curve that
can be clearly modeled by two different slopes, one
for small values of n, and one for large values of n.
Thus, we calculate two different values of α, i.e., two
DFA coefficients: α
1
and α
2
, which reflect short-term
and long-term fluctuations, respectively (Peng et al.,
1995).
3 METHODS AND RESULTS
3.1 Matlab Software for DFA of HRV
The proposed computational tool was developed in
Matlab 6.5 (The MathWorks, Inc., Natick, MA,
USA). It implements a graphical interface in which
each of the DFA calculation steps discussed above is
graphically displayed, so as to improve user under-
standing of the entire process. The interface is di-
vided in four subplots (Figure 1). The first subplot, in
BIOSIGNALS 2010 - International Conference on Bio-inspired Systems and Signal Processing
226
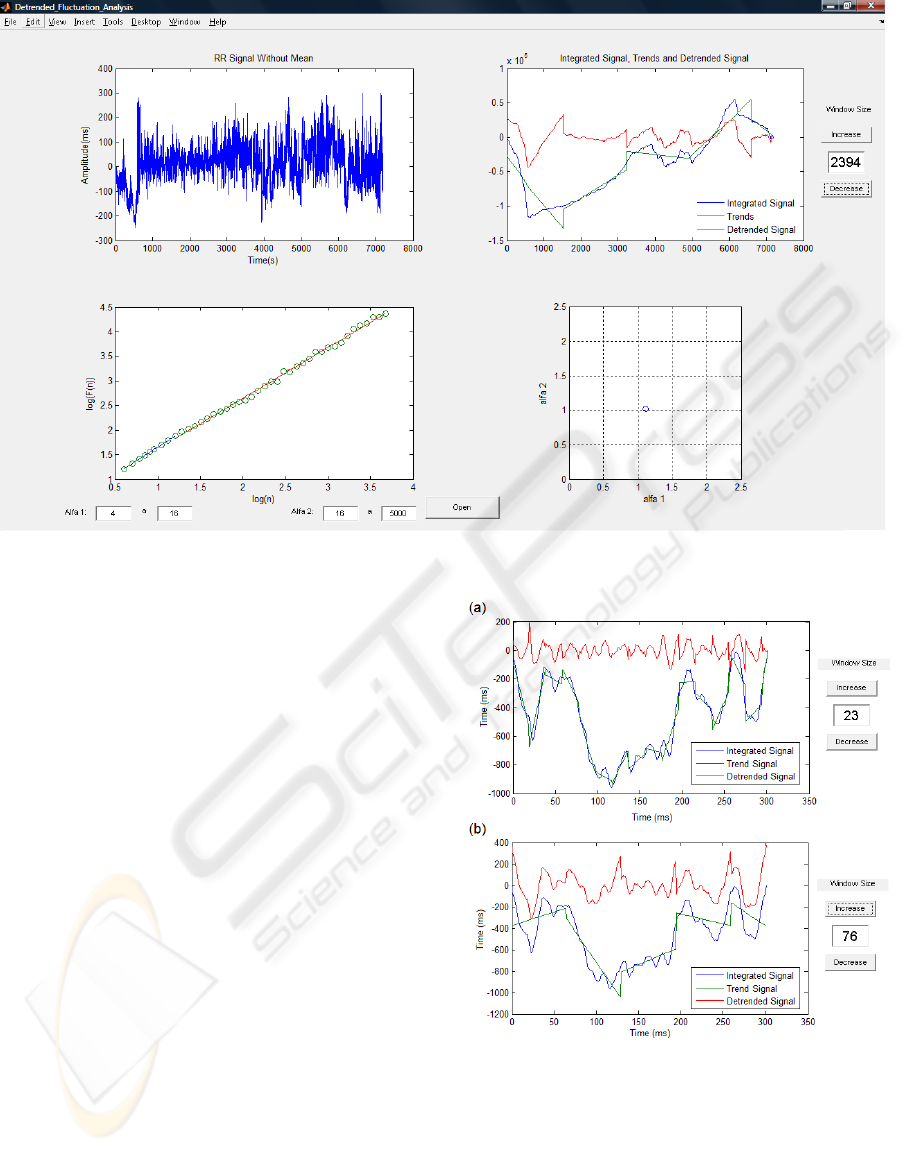
Figure 1: Graphical user interface for detrended fluctuation analysis of HRV.
the upper-left quadrant, provides a visualization of the
original RR time-series, RR(i). The second subplot,
in the upper-right quadrant, presents three signals: the
integrated signal, y(k); the trend signal, y
n
(k); and the
approximation error (detrended signal), e(k). On this
subplot, it is possible to change the window-length for
visualization (Figure 2). This, however, does not af-
fect the calculation of the F(n) log-log plot, displayed
on the lower-left quadrant. The range of values of n
associated with coefficients α
1
and α
2
are manually
defined by the user, on a set of text-edit boxes, lo-
cated below the log-log subplot. Finally, the values of
the coefficients α
1
and α
2
are plotted in a Cartesian
coordinate system on the fourth subplot (lower-right
quadrant).
3.2 Validation
In order to validate the software, we used simulated
signals with different power-law correlation charac-
teristics. Specifically, we used three different kinds
of noise: white noise, pink noise (1/ f ), and Brown-
ian noise (1/ f
2
). The α coefficient associated with
each of these types of noise is 0.5, 1 and 1.5, respec-
tively (Peng et al., 1995). The smoother the signal,
the larger the value of α, as discussed next.
Theoretically, white noise presents constant power
spectral density amplitude for all frequencies ( f ), and
an auto-correlation equal to the Dirac delta function.
Figure 2: Subplot for visualization of the detrending pro-
cess, where the integrated signal y(k), the trend signal y
n
(k),
and the approximation error (detrended signal) e(k), are dis-
played for a specific window length (n). The value of n can
be manually changed by the user, using the interface shown
on the right. (a) n = 23 samples; (b) n = 76 samples. Note
that the approximation error increases for longer windows.
This type of noise can be compared to a HRV sig-
nal that presents low long-term correlation, and sharp
MATLAB SOFTWARE FOR DETRENDED FLUCTUATION ANALYSIS OF HEART RATE VARIABILITY
227
variations. Integrated white noise corresponds to a
random walk, and therefore α = 0.5. Pink noise
has power spectral density amplitude inversely pro-
portional to f , i.e., proportional to 1/ f . Its associ-
ated value of α is 1, which represents a boundary be-
tween sharp and smooth variations. Brownian noise
corresponds to the integration of white noise. Thus,
it presents smoother variations than white and pink
noises, and its associated α value is 1.5.
The white noise signals used in this validation
were created using the rand function in Matlab. Pink
noise signals were generated by weighting the dis-
crete Fourier transform of each white noise signal by
f
1/2
and then taking the inverse Fourier transform.
Brownian noise signals, b(i), were obtained by inte-
grating the white noise signals, x(i), using the follow-
ing difference equation: b(i) = b(i − 1) + x(i).
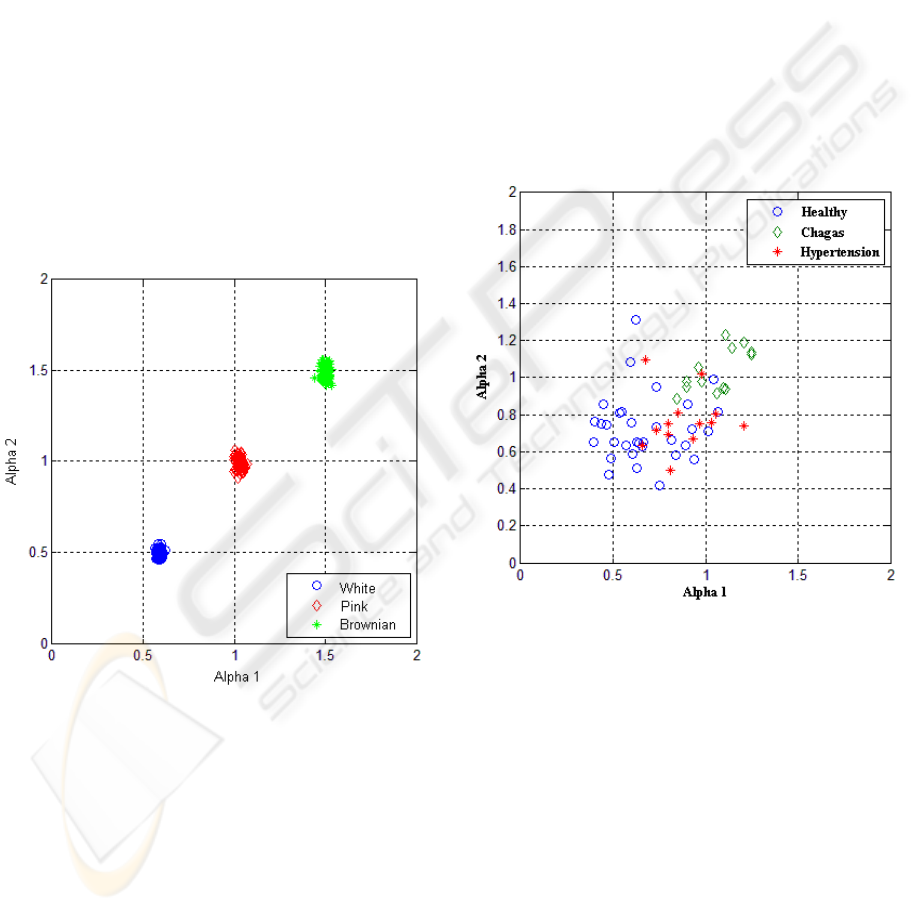
The simulated signals were processed using the
presented software. The results of this experiment
are presented in Figure 3. The measured coefficients
show good agreement with the theoretical values.
Figure 3: Validation of the software, using different types
of noise signals.
3.3 Demonstration
In order to demonstrate the ability of this tool of dis-
criminating between normal and pathological individ-
uals, an experiment using real HRV signals was con-
ducted. We used a database of 58 RR interval time-
series, of approximately 5 minutes each, composed of
32 signals from healthy subjects (Jesus, 1996; Correia
Filho, 2000), 13 signals from individuals with organic
Chagas disease (cardiac or digestive forms) (Correia
Filho, 2000), and 13 signals from individuals with ar-
terial hypertension (mild or moderate) (Junqueira Jr
et al., 2001). The signals in this database were ac-
quired by the faculty and staff of the Cardiovascular
Laboratory of the School of Medicine of the Univer-
sity of Bras
´
ılia. The experimental protocols are de-
scribed in detail in (Jesus, 1996; Correia Filho, 2000;
Junqueira Jr et al., 2001).
The results of this experiment are shown in Fig-
ure 4. The DFA tool was capable of satisfactorily
discriminating the group of healthy subjects from the
group of Chagas disease individuals. The group of in-
dividuals with hypertension show some overlap with
a portion of the group of healthy volunteers. This is
explained by the fact that the hypertension level in
this group was from mild to moderate. Nevertheless,
individuals in this group seem to present a higher α
1
value than that of the healthy subjects, in average.
Figure 4: DFA coefficients for a group composed of three
different types of subjects: healthy volunteers, individuals
with Chagas disease (cardiac or digestive), and individuals
with arterial hypertension (mild or moderate).
Based on the results above, the characteristics of
each group of individuals can be compared with the
characteristics of the noise signals discussed in the
previous section. Based on the average value of α for
healthy volunteers, it can be said that the power-law
characteristics of such signals are closer to those of
white noise (α = 0.5). Therefore, despite the disper-
sion of the measured coefficients, the results suggest
that normal individuals present small long-term cor-
relations. On the other hand, the group of individuals
with Chagas disease presents an average value of α
approximately equal to 1, what makes it possible to
compare the power-law characteristics of this group
BIOSIGNALS 2010 - International Conference on Bio-inspired Systems and Signal Processing
228

to those of pink noise, indicating a smoother RR sig-
nal, with stronger long-term correlations. Finally, the
group of individuals with hypertension presents RR
signals with moderate smoothness. Arterial hyperten-
sion is associated with reduced variability of cardiac
frequency, specially that associated with parasympa-
thetic activities, what can partially explain the ob-
served results.
4 CONCLUSIONS
A new tool for analysis of HRV was presented. The
presented software implemented detrended fluctua-
tion analysis, and may facilitate the study of patholo-
gies on long duration examinations or during exams
involving variable stress conditions, since DFA does
not make assumptions about signal stationarity. The
output of DFA analysis is a pair of numerical coeffi-
cients, what could make the statistical analysis of such
signals simple and practical. DFA could be combined
with pattern classification methods based on neural
networks, for a potentially powerful diagnosis tool.
The presented software was first validated with a
set of simulated signals, and then applied to real RR
signals, which demonstrated its utility for the analysis
of HRV. The DFA tool was capable of satisfactorily
discriminating the group of healthy subjects from the
group of Chagas disease individuals. The group of in-
dividuals with mild to moderate hypertension showed
some overlap with a portion of the group of healthy
volunteers, but seemed to present higher α
1
values
than that of the healthy subjects, in average.
The presented tool may help popularizing the use
of DFA among the HRV scientific community. The
software is open source, and is available upon request.
ACKNOWLEDGEMENTS
The authors thank Prof. Luiz Fernando Junqueira Jr.
and the faculty, staff and alumni of the Cardiovascular
Laboratory of the University of Bras
´
ılia for provid-
ing the HRV signals used in this work. The authors
also thank Mr. Pandelis Perakakis for motivating this
work, and for useful discussions.
REFERENCES
Anderson, S. (1992). Advanced Electrocardiography (Bio-
physical Measurement Series). Spacelabs Medical,
Inc., Redmond, WA.
Carvalho, J. L. A., da Rocha, A. F., Junqueira Jr, L. F.,
Souza Neto, J., Santos, I., and Nascimento, F. A. O.
(2003). A tool for time-frequency analysis of heart
rate variability. In EMBC’03, 25th Annual Inter-
national Conference of the IEEE Engineering in
Medicine and Biology Society, volume 3, pages 2574–
2577.
Carvalho, J. L. A., da Rocha, A. F., Nascimento, F. A. O.,
Souza Neto, J., and Junqueira Jr, L. F. (2002). Devel-
opment of a Matlab software for analysis of heart rate
variability. In ICSP’02, 6th International Conference
on Signal Processing, volume 2, pages 1488–1491.
Correia Filho, D. (2000). Avaliac¸
˜
ao Cl
´
ınico-Funcional,
Bioqu
´
ımica e Imunol
´
ogica do Sistema Nervoso
Aut
ˆ
onomo em Residentes em
´
Area End
ˆ
emica da
Doenc¸a de Chagas. PhD thesis, Universidade Fed-
eral de Minas Gerais (UFMG), Belo Horizonte–MG,
Brazil.
Jesus, P. C. (1996). Considerac¸
˜
oes Metodol
´
ogicas e
Caracterizac¸
˜
ao de Procedimentos Implicados nas
An
´
alises Temporal e Espectral da Variabilidade da
Freq
¨
u
ˆ
encia Card
´
ıaca para Avaliac¸
˜
ao Cl
´
ınica da
Func¸
˜
ao Auton
ˆ
omica Card
´
ıaca. Master’s thesis, Facul-
dade de Sa
´
ude – Universidade de Bras
´
ılia (FS/UnB),
Bras
´
ılia–DF, Brazil.
Junqueira Jr, L. F., Oliveira, L. C., Pereira, F., Jesus, P. C.,
and Carvalho, H. (2001). Depressed sympathetic and
enhanced parasympathetic reflex responses of heart
rate in arterial hypertension. Revista de la Federaci
´
on
Argentina de Cardiolog
´
ıa, 30(2):357–358.
Malik, M. and Camm, A. J. (1995). Heart Rate Variability.
Futura Publishing Company, Inc., Armonk, NY.
Niskanen, J.-P., Tarvainen, M. P., Ranta-aho, P. O., and
Karjalainen, P. A. (2004). Software for advanced
HRV analysis. Computer Methods and Programs in
Biomedicine, 76(1):73–81.
Peng, C.-K., Havlin, S., Stanley, H. E., and Goldberger,
A. L. (1995). Quantification of scaling exponents and
crossover phenomena in nonstationary heartbeat time
series. Chaos, 5(1):82–87.
Piskorski, J. and Guzik, P. (2007). Geometry of the Poincar
´
e
plot of RR intervals and its asymmetry in healthy
adults. Physiological Measurement, 28(3):287–300.
Schechtman, V. L., Raetz, S. L., Harper, R. K., Garfinkel,
A., Wilson, A. J., Southall, D. P., and Harper, R.
(1992). Dynamic analysis of cardiac R-R intervals in
normal infants and in infants who subsequently suc-
cumbed to the sudden infant death syndrome. Pedi-
atric Research, 31(6):606–612.
Shin, K. S., Minamitani, H., Onishin, S., Yamazaki, H., and
Lee, M. H. (1994). The direct power spectral esti-
mation of unevenly sampled cardiac event series. In
EMBC’94, 16th Annual International Conference of
the IEEE Engineering in Medicine and Biology Soci-
ety, volume 2, pages 1254–1255.
MATLAB SOFTWARE FOR DETRENDED FLUCTUATION ANALYSIS OF HEART RATE VARIABILITY
229
