
DESIGN OF A PORTABLE ELECTROMYOGRAPHY DEVICE
FOR BACK HERNIATED PATIENTS
Halil İbrahim Çakar, Sadık Kara and Onur Toker
Department of Electrical-Electronics Engineering, Fatih University, 34500, Buyukcekmece, Istanbul, Turkey
Keywords: Surface Electromyography, Back Herniation, Biomedical Instrumentation.
Abstract: Up to 80 percent of people are affected by back herniation or another low-back disease in their life. Some
studies have proven that there is a significant relation between paraspinal muscles and back herniation. In
this study, a portable surface electromyography device was designed for measuring the muscular activity of
paraspinal muscles from back herniated patients. The device’s gain value is adjusted to 1000, it includes a
band-pass filter and a 50 Hz notch filter to eliminate power source interference noise and other electrically
noises. The device designed as an electrically isolated single channel, and it is linked to Matlab software via
the serial port of Personal Computer.
1 INTRODUCTION
A superior cause of low-back pain is lumbar-disc
herniation (LDH). LDH pain influences 70%-85% of
people during their life and LDH is the most
common reason which limits the activity in people
younger than 45 years of age. (Hirose et al., 2008) In
the USA, LDH is the second most common reason
for visiting the physician, one of the most frequent
reason of entrance to the hospital. Furthermore, the
third most frequent reason of surgical interventions.
(Andersson, 1999) Magnetic Resonance Imaging
(MRI) is the commonly used imaging method in
diagnosis of LDH. Because, approximately 30% of
symptomless patients show a disc herniation on
MRI. Moreover, Computer Tomography (CT) and
myelography methods are rarely used for diagnosis.
(Skinner, 2003) Electromyography (EMG) is used in
LDH diagnosis to determine the neural injury in
herniated region and to measure the level of injury if
exists. (Çevikcan and Kara, 2007)
Electromyography (EMG) is a bio potential
signal which represents the neuromuscular activities
and occurs during the contraction and relaxation
activity of skeletal muscles. These activities of
muscles are controlled by the nervous system. (Reaz
et al., 2006) Surface electromyography (sEMG) is a
method used for appraisement of muscles’ activities
noninvasively. sEMG signals should be detected as
monopolar or bipolar. (Moore and Zouridakis, 2004)
Some studies have proven that sEMG should be
used in research of paraspinal muscle activities.
(Emley et al., 1992), (De Luca, 1993), (Kent, 1997),
(Kuriyama and Hito, 2005)
In this study, our goal is the measurement of the
paraspinal muscles’ activities and the determination
of the existence of back herniation with using the
sEMG bio potentials of these muscles. This portable
device offers a non-invasive, quicker, comfortable,
low-cost and alternative system for diagnosis of
back herniation.
2 GENERAL DESCRIPTIONS OF
CIRCUITS
In this section, the main components of the device
are described. Basically, whole device composed by
five parts. In the first stage, low bio potentials are
amplified and then for the safety of the patient
isolation circuit is used. In the stages, amplified
signals filtered and digitized with a high resolution
analog to digital converter (ADC).
Lastly, the digital data is transferred to the
personal computer (PC) by the microcontroller
PIC18F452. General block diagram of the device is
shown in Fig.1.
Raw sEMG data is collected with bipolar electrodes.
The disposable bipolar electrodes are recommended
by the European initiative, Surface
Electromyography for Noninvasive Assessment of
94
Çakar H., Kara S. and Toker O. (2010).
DESIGN OF A PORTABLE ELECTROMYOGRAPHY DEVICE FOR BACK HERNIATED PATIENTS.
In Proceedings of the Third International Conference on Biomedical Electronics and Devices, pages 94-97
DOI: 10.5220/0002718100940097
Copyright
c
SciTePress
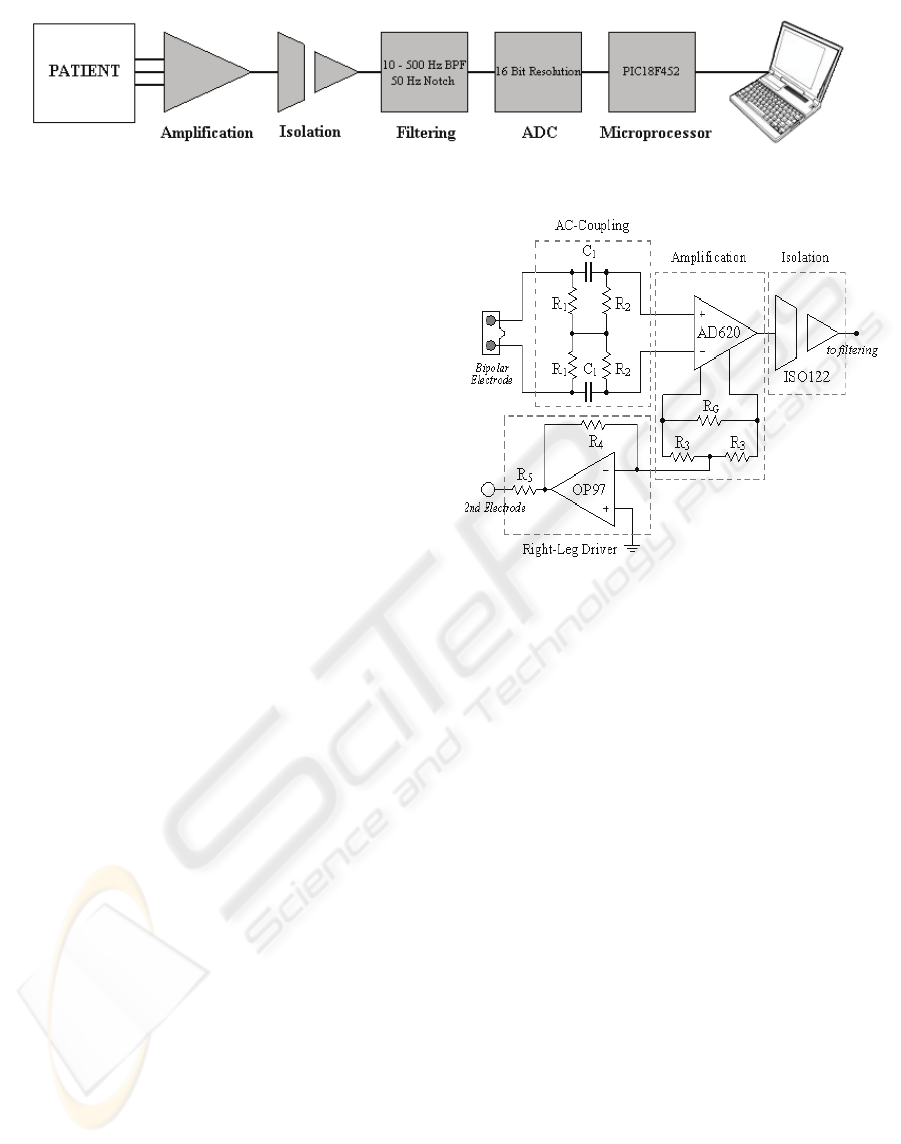
Figure 1: The block diagram of the device.
Muscles (SENIAM) who defines general agreements
about the basic criteria about sEMG since 1996.
(Merletti and Parker, 2004) Electrodes are connected
to amplification block by using shielded cables to
degrade the environmental noise effect.
2.1 Amplification and Isolation
Instrumentation amplifier (in-amp) amplifies the
difference of the sensed low amplitude signals by
bipolar electrodes. sEMG signal amplitude range
changes between 100 µV to 5 mV and frequency
range is between 10 Hz to 1000 Hz. For
amplification, Analog Devices’ (AD) low-power,
low-cost and high accuracy in-amp AD620 is used.
AD620 achieves a very high common mode
rejection ratio CMRR (100 dB min when the gain is
10) and its low noise level, low input bias current
and low power dissipation makes it suitable for
biomedical instrumentation applications. This high
accuracy in-amp’s gain setting is adjusted by using
just a single external resistor and its gain range
changes between 1 to 10000. The gain of AD620
should be adjusted by using the equation (1). We
chose G as 1000. (AD620 datasheet, 2004)
(49.4 / ) 1
G
GkR=+
(1)
AC-coupling is required in high-gain front-end
amplifiers for biopotential measurements. A
differential high-pass filter is designed without any
grounded resistor to reduce baseline wander and to
obtain the higher CMRR in front of the
instrumentation amplifier. (Spinelli et al., 2003) The
cut-off frequency of ac-coupling filter is 10 Hz.
Figure 2: The circuit diagram of amplification and
isolation block.
Using right-leg driver (RDL) circuit is another
way of reducing the noise. Basically, RDL circuit
inverts the common mode voltage which occurs
during the recording of sEMG signals with respect
to amplifier’s common. Then, the inverted common
mode voltage is applied to the body by attaching a
second monopolar electrode to the patient’s right
leg. (Winter and Webster, 1983) AD’s low power
and high precision operational amplifier OP97 is
used in the right-leg driver circuit.
Another important issue in biomedical
instrumentation is the isolation of the patient from
non-biomedical equipments such as computers,
which could be connected to EMG device and have
high power rates. Maximum accepted leakage
current for biomedical equipments in Europe is 100
µA
RMS
during instrument’s normal working
procedure. (Moore and Zouridakis, 2004) Galvanic
isolation and optoisolation are commonly used types
of isolation. For the isolation of our device, Burr-
Brown’s (BB) monolithic precision lowest cost
isolation amplifier is used. Basically, ISO122
includes a galvanic isolation system and matched
1pF of isolating capacitors. ISO122 uses a novel
duty cycle modulation-demodulation technique. The
signal is transmitted to the other side of isolation
DESIGN OF A PORTABLE ELECTROMYOGRAPHY DEVICE FOR BACK HERNIATED PATIENTS
95
barrier by a 500 kHz duty cycle modulation
technique. 0.020 % maximum nonlinearity ratio, 140
dB of isolation mode rejection (IMR) value and
maximum 0.5 µA
RMS
leakage current make ISO122
suitable for our system. (ISO122 datasheet, 1993)
The general block diagram of amplification and
isolation stage should be seen in Fig. 2.
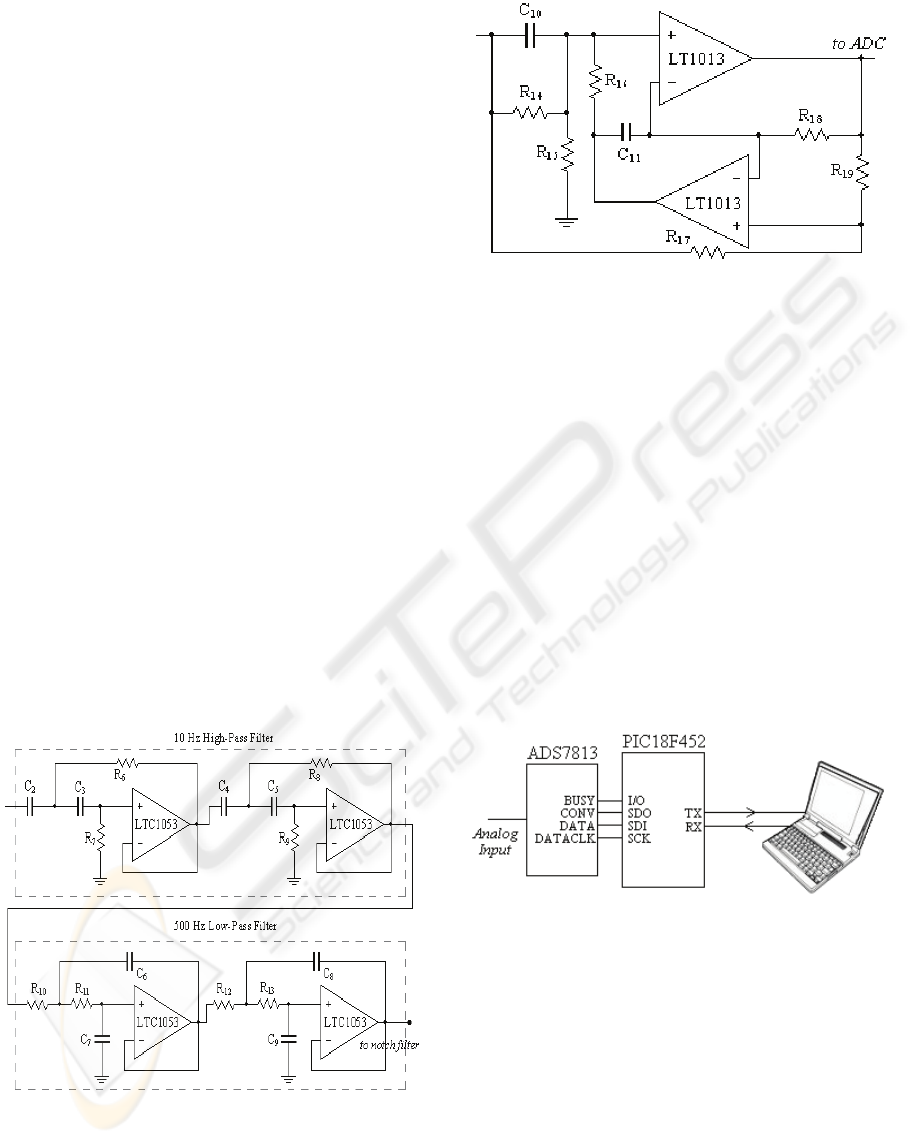
2.2 Filtering
To eliminate the unwanted signals such as, DC
offset generated by the half-cell potential of the
electrodes that DC-coupled in the input stage and
motion artefacts, a band-pass filter (BPF) should be
after the input stage of the device. (Moore and
Zouridakis, 2004) According to the recommended
sEMG amplifier bandwidth, an active high-pass
filter (HPF) having 10 Hz cut-off frequency and an
active low-pass filter (LPF) with a 500 Hz of cut-off
frequency are designed. The circuit diagram of BPF
is in Fig. 3.
In design of both filters, Linear Technology’s
(LT) Quad Low Cost Precision Op Amp LTC1053 is
used. HPF and LPF both have 4 poles and the types
of filters are Sallen-Key. The responses of filters are
Butterworth. We chose Butterworth because of its
flattest response in the passband.
In the second stage of filtering, 50 Hz of notch
filter is designed. LT’s Dual Precision Op Amp
LT1013 is used for making notch filter. Fig. 4 shows
the circuit diagram of notch filter.
Figure 3: The circuit diagram of high-pass filter and low-
pass filter.
Figure 4: The circuit diagram of 50 Hz notch filter.
2.3 Analog to Digital Conversion and
Microcontroller
After amplification, isolation and filtering
procedures, the analog raw sEMG signal should be
digitized with an ADC. BB’s low-power, serial 16-
bit sampling ADC ADS7813 is used for digitizing.
ADS7813 contains the 16-bit capacitor based
successive approximation (SAR) ADC with a
sample/hold, clock, reference and easy to use serial
interface. The throughout rate of ADS7813 is
minimum 40 kHz. The conversion time lengths
maximum 20μs. Its integral linearity error is
maximum +3 LSB and differential linearity error is
+3, -2 LSB. ADS7813 includes single channel. But,
it is suitable for multichannel applications.
(ADS7813 datasheet, 2005)
Figure 5: Relation of ADC, microcontroller and PC.
When transferring the 16 bit digital signals to
PC, Microchip’s microcontroller PIC18F452 is used.
PIC18F452 has the master synchronous serial port
(MSSP) module including serial peripheral interface
(SPI) suitable for interfacing ADS7813. PIC18F452
is chosen as master and ADS7813 as a slave.
PIC18F452’s addressable universal synchronous
asynchronous receiver transmitter (USART) is
another serial I/O module. (PIC18FXX2 datasheet,
2006) UART module is used to send the signals to
PC. Fig. 5 shows the relation of ADC,
microcontroller and PC. PIC18F452 sends the
BIODEVICES 2010 - International Conference on Biomedical Electronics and Devices
96
digitized signal via serial cable. Matlab’s serial port
I/O feature lets us to communicate with
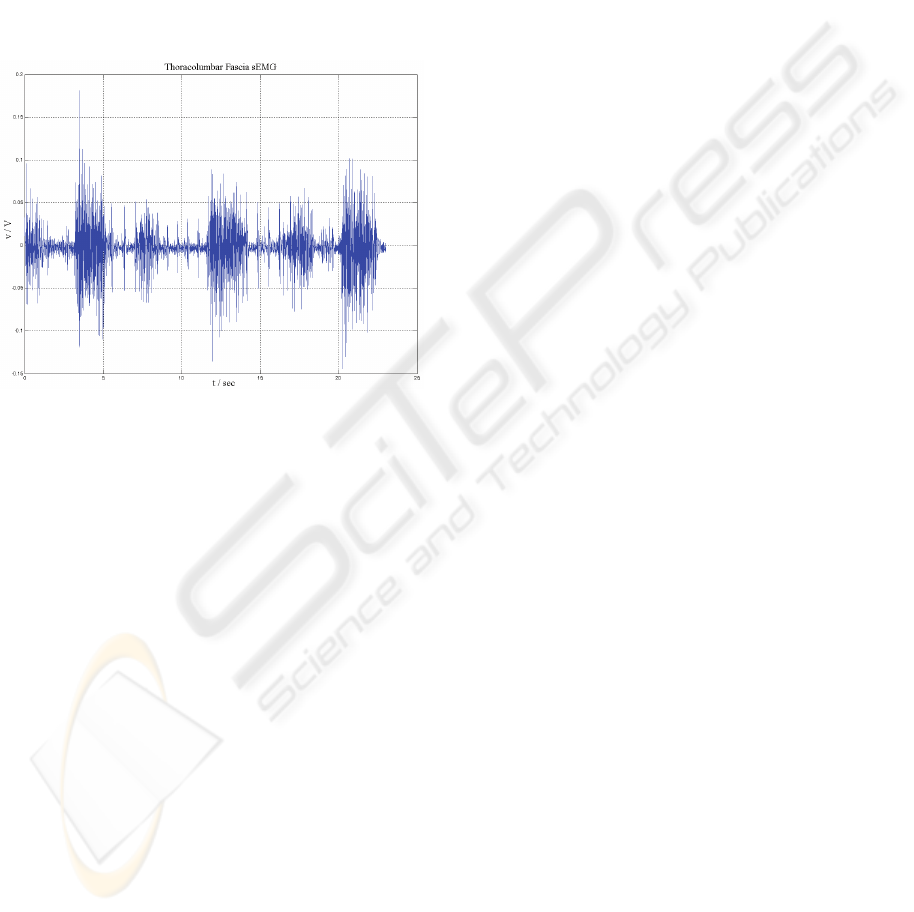
microcontroller. The sEMG signals are buffered to
Matlab during the measurement and then other
signal processing methods are applied. An example
of raw unprocessed sample of sEMG signal should
be seen in Fig. 6. This sample is taken from
Thoracolumbar Fascia muscle of a volunteer healthy
male. In the next stages of this study, we aim to
evaluate sEMG signals collected with our device
belong to patients with various signal processing
techniques.
Figure 6: A sample of raw sEMG signal.
3 CONCLUSIONS
In this study, we described a non-invasive, low-cost
and portable electromyography device for back
herniated patients. Device includes a single channel
and 16-bit resolution ADC. It has serial
communication with PC and has a direct connection
with Matlab software. In future, we aim to add a
Bluetooth® module to make our device wireless and
more portable.
REFERENCES
Hirose, Y., et al. 2008. A Functional Polymorphism in
THBS2 that Affects Alternative Splicing and MMP
Binding Is Associated with Lumbar-Disc Herniation.
In The American Journal of Human Genetics.
Andersson, B.J.G, 1999. Epidemiological features of
chronic low-back pain, Lancet.
Skinner, H., 2003. Current Diagnosis & Treatment in
Orthopedics, Appleton & Lange. 3
rd
edition.
Çevikcan, B., Kara, S., 2007. Bel Fıtığı Hastalığı Bulunan
Bireylerin Bel ve Karın Kası Fonksiyonlarının
Elektromiyografik Analizi. In Elektrik-Elektronik,
Bilgisayar, Biyomedikal Mühendisliği XII. Ulusal
Kongresi ve Fuarı. (Turkish)
Reaz, M. B. I., et al. 2006.Techniques of EMG signal
analysis: detection, processing, classification and
applications. In Biological Procedures Online.
Moore, J., Zouridakis, G., 2004. Biomedical Technology
and Devices Handbook, CRC Press LLC.
Emley, M. S., et al. 1992. Electromyography Unlocking
the Secrets of Back Pain. In IEEE Potentials.
De Luca, C. J., 1993. Use of the Surface EMG Signal for
Performance Evaluation of Back Muscles. In
Muscle&Nerve.
Kent, C., 1997. Surface Electromyography in the
Assessment of Changes in Paraspinal Muscle Activity
Associated with Vertebral Subluxation. In Journal of
Vertebral Subluxation Research.
Kuriyama, N., Ito, H., 2005. Electromyographic
Functional Analysis of the Lumbar Spinal Muscles
with Low Back Pain. In Journal of Nippon Medical
School.
Merletti, R., Parker, P., 2004. Electromyography
Physiology, Engineering, and Noninvasive
Applications, John Wiley & Sons, Inc.
AD620 Low Cost Low Power Instrumentation Amplifier
Datasheet, 2004, Analog Devices.
Spinelli, M. E., et al. 2003. AC-Coupled Front-End for
Biopotential Measurements. In IEEE Transactions On
Biomedical Engineering Vol.50, No.3.
Winter, B. B., Webster, J.G. 1983. Driven-Right-Leg
Circuit Design. In IEEE Transactions On Biomedical
Engineering Vol.BME-30, No.1.
ISO122 Precision Lowest Cost Isolation Amplifier
Datasheet, 1993, Burr-Brown Corporation.
ADS7813 Low-Power, Serial 16-Bit Sampling Analog to
Digital Converter Datasheet, 2005, Burr-Brown
Corporation.
PIC18FXX2 High-Performance, Enhanced Flash
Microcontrollers with 10-Bit A/D Datasheet, 2006,
Microchip Technology.
DESIGN OF A PORTABLE ELECTROMYOGRAPHY DEVICE FOR BACK HERNIATED PATIENTS
97
