
SVM EVALUATION FOR BRAIN COMPUTER INTERFACE
SYSTEMS
Mario Salerno, Giovanni Costantini, Daniele Casali
Giancarlo Orengo, Pietro Cavallo, Giovanni Saggio
Dipartimento di Ingegneria Elettronica, Università di Roma “Tor Vergata”, Rome, Italy
Luigi Bianchi, Lucia Quitadamo, Maria Grazia Marciani
Dipartimento di Neuroscienze, Università di Roma “Tor Vergata”, Rome, Italy
Keywords: Support Vector Machine, Classification, Brain computer interface.
Abstract: A Support Vector Machine (SVM) classification method for data acquired by EEG registration for
brain/computer interface systems is here proposed. The aim of this work is to evaluate the SVM
performances in the recognition of a human mental task, among others. Such methodology could be very
useful in important applications for disabled people. A prerequisite has been the developing of a system
capable to recognize and classify the following four tasks: thinking to move the right hand, thinking to
move the left hand, performing a simple mathematical operation, and thinking to a nursery rhyme. The data
set exploited in the training and testing phases has been acquired by means of 61 EEG electrodes and
consists of several time series. These time data sets were then transformed into the frequency domain, in
order to obtain the power frequency spectrum. In such a way, for every electrode, 128 frequency channels
were obtained. Finally, the SVM algorithm was used and evaluated to get the proposed classification.
1 INTRODUCTION
Brain electrical activity can be observed and
recorded by placing a set of ad-hoc wet electrodes
on the surface of the scalp. Every kind of task or
thought performed by the human being causes
electrical activity in different parts of the brain; thus,
the activity recognition could be considered as a
desirable machine learning application. The task is
not very trivial because of many reasons. First, the
states of all neurons in the brain are unknown,
except the mean values of them in some zones of the
outer part of the brain. Second, the electrical activity
is not limited to a single zone, depending on the task
the subject is performing: in some cases, it can even
involve the whole brain and the difference among
different tasks seems consist in the way the electrical
waves are moving from one zone to another. A third
problem concerns the base of the brain electrical
activity, even presents when no thoughts or
movements are done. So the base activity, including
breathing and all involuntary movements, can mask
the voluntary task we intend to detect. The “noise
signals” corresponding to this base activity can also
assume higher levels with respect to those of
“voluntary signals” under detection.
Stand the above considerations, the main
challenge consists in the proper classification of the
dataset collected from the electrodes, in order to
recognize the mental task the subject was
performing.
Though the classical classification method for
this kind of data makes use of artificial neural
networks (ANN) (Huan, 2004), a different kind of
classifier is here proposed. In fact we want to
evaluate how and if the Support Vector Machines
(SVM) can be recognized as a useful tool instead of,
together with or in addition to the classical neural
network. This because SVM presents the interesting
advantage to support datasets with a huge number of
components; in such a way, the need of reduction of
the feature space is not more necessary otherwise
than ANN. In addition, in the present application,
SVM training algorithm furnishes valuable
advantages with respect to the “back-propagation”, a
rule usually applied in the ANN approach.
In the following sections, the acquisition data
system, the acquired data pre-processing and the
240
Salerno M., Costantini G., Casali D., Orengo G., Cavallo P., Saggio G., Bianchi L., Quitadamo L. and Grazia Marciani M. (2010).
SVM EVALUATION FOR BRAIN COMPUTER INTERFACE SYSTEMS.
In Proceedings of the Third International Conference on Bio-inspired Systems and Signal Processing, pages 240-244
DOI: 10.5220/0002721802400244
Copyright
c
SciTePress

classifier will be presented. Experimental tests and
related results will be the test bench to validate the
proposed method.
EEG
Pre
p
rocessin
g
Classificatio
n
Figure 1: Block-diagram of the sensor system.
2 ACQUISITION DATA SYSTEM
The overall system consists in three blocks (Fig. 1),
namely data acquisition, pre-processing, and
classification.
Figure 2: Position and names of the electrodes.
The acquisition data system used 61 Ag-AgCl
scalp electrodes. The electrodes were located
according to the International 10-20 system (Huan,
2004; Wolpaw, 2002; Schogl, 2005; Yoo, 2004;
Sharbrough, 1991; Blankertz, 1970) as shown in Fig
2.
The electrodes were connected to the computer
by fiber optic transmission channels, in order to
provide the proper electrical insulation and to
guarantee the subject by any risk of electrical shock.
The signals were processed at the sampling rate
of 256 Hz and band-pass filtered in the band from
0.5 Hz to 128 Hz. The sensitivity of the amplifier is
set to 4 mV. The picture of the sensor system is
shown in Fig. 3.
Figure 3: Picture of the sensor system.
3 PREPROCESSING
The frequencies of the waves observed in EEG
signals are usually related to different kinds of brain
activity. To this purpose, some classical waves have
been defined, namely alpha waves (8-12 Hz), beta
waves (12-19 Hz), gamma waves (around 40 Hz)
and delta waves (1-4 Hz) that are associated to
weakness, sleep, REM and other kinds of brain
states respectively (Blankertz, 2006; Brazier, 1970;
Ward, 2006).
Following this approach, the acquired dataset
was analysed in the frequency domain. In
correspondence to every task, the FFT algorithm
was applied to three windows of 256 samples and,
for each window, the ratio between the mean value
of alpha waves (8-12 Hz) and the mean value in
frequencies range (5-40 Hz) was evaluated. Only the
first half of every FFT window was considered since
the second half is symmetric and couldn’t give any
further information. Channels from 1 to 127
represent the frequencies from 1 to 127 Hz. Zero
frequency (Channel 0) was omitted. In this way, one
data point was obtained in correspondence to every
electrode and to every task to be classified. In order
to obtain a useful comparison between different
choices of electrodes, three occurrences were
considered. The first one corresponded to all the
electrodes. The second one considered a proper
selection of 19 electrodes, in particular the
electrodes: C
1
, C
2
, C
3
, C
4
, C
5
, C
6
, C
z
, P
1
, P
2
, P
3
, P
4
,
P
5
, P
6
, T
3
, T
4
, T
5
, T
6
, F
Pz
, O
z
. These electrodes are
strictly related to the sensory-motory cortical area
(related to hand moving), and to the lower parietal
(related to arithmetical operations). In the third
occurrence, the electrodes C
3
and C
4
were under
consideration, being very useful to discriminate right
hand vs. left hand, as suggested in (Blankertz, 2006),
SVM EVALUATION FOR BRAIN COMPUTER INTERFACE SYSTEMS
241

but also the electrodes around the above ones were
used, namely C
1,
C
2,
C
5
, C
6,
CP
3,
CP
4,
FC
3
, FC
4
.
Thus, in this case, a total set of 10 electrodes was
used.
As a final step, since a large variance in the
numerical values was registered, a normalization
rule was necessary, so that all the values involved be
in the interval form 0 to 1.
4 CLASSIFIER
In the latest years, the technical literature proved the
SVM to play a valid alternative rule to multi-layer
feed-forward neural networks, for data classification
and regression or PCA (Jolliffe, 2002; Burges,
1998). The basic formulation of SVM learning rule
for classification consists in the minimum norm
solution of a set of linear inequality constraints. It
seems useful to remark the relation between these
two paradigms in order specify some peculiar
properties of SVM rule: the “optimal” margin of
separation, the robustness of the solution and the
availability of efficient computational tools. Indeed,
SVM learning problem does not get to non-global
solutions and can be solved by standard routines for
Quadratic Programming (QP). In the case of a large
amount of data, some fast solvers for SVMs are
available, e.g. SVM-light (Joachims, 1999;
Scholkopf, 1999). In the following subsection, a
short description of an SVM will be given.
4.1 Support Vector Machines
Let (x
k
, y
k
), k = 1,…, m represent the training
examples for the classification problem; each
example x
k
∈R
N
belongs to the class y
k
∈{-1, +1}.
Assuming linearly separable classes, a separating
hyper-plane will exist, such that
y
k
(w
T
x
k
+ b) > 0 k = 1,…, m (1)
The minimum distance between the data points
and the separating hyper-plane is the separation
margin. The goal of an SVM is to maximize this
margin. If the weights w and the bias b are rescaled,
the constraints (1) can be rewritten as
y
k
(w
T
x
k
+ b) ≥ 1 k=1,…,m (2)
Thus, the margin of separation is equal to 1/||w||
and the maximization of the margin is equivalent to
the minimization of the Euclidean norm of the
weight vector w. The corresponding weights and
bias represent the optimal separating hyper-plane
(Fig. 4).
w
1
w
1
w
T
x
+
b
= +1
w
T
x
+
b
= -1
optimal
hyperplane
Figure 4: Optimal separating hyper-plane corresponding to
the SVM solution. The support vectors lie on the dashed
lines.
5 EXPERIMENTS AND RESULTS
In the experiments, five mentally healthy subjects
(three males and two females) were involved for two
days. Each subject performed two sessions every
day. During a single session, each subject was asked
to perform 400 tasks, randomly selected among the
following ones: thinking to move the right hand,
thinking to move the left hand, performing a simple
mathematical operation, and thinking to a nursery
rhyme.
Two sessions on distinct days were recorded for
each subject. Each session consisted of 200 trials (50
for each of the four possible tasks).
The subjects sat in a comfortable armchair in
front of a computer screen. For every trial a text,
indicating the task to perform, appeared on the black
screen for 3 sec. The Inter Trial Interval (ITI) was
set to 1 sec.
The objective was to operate discrimination
between the following pairs of tasks: left hand vs.
right hand, and mathematical operation vs. nursery
rhyme. The whole dataset was spitted into training
set (60% of the dataset), validation set (15% of the
dataset) and test set (20% of the dataset). The
accuracy results for the test set on Nursery rhyme vs.
Math operation are shown on Table 1 for every
subject, while the mean values are reported on the
bottom line. The accuracy results for the test set on
Right hand vs. Left hand are shown on Table 2.
BIOSIGNALS 2010 - International Conference on Bio-inspired Systems and Signal Processing
242
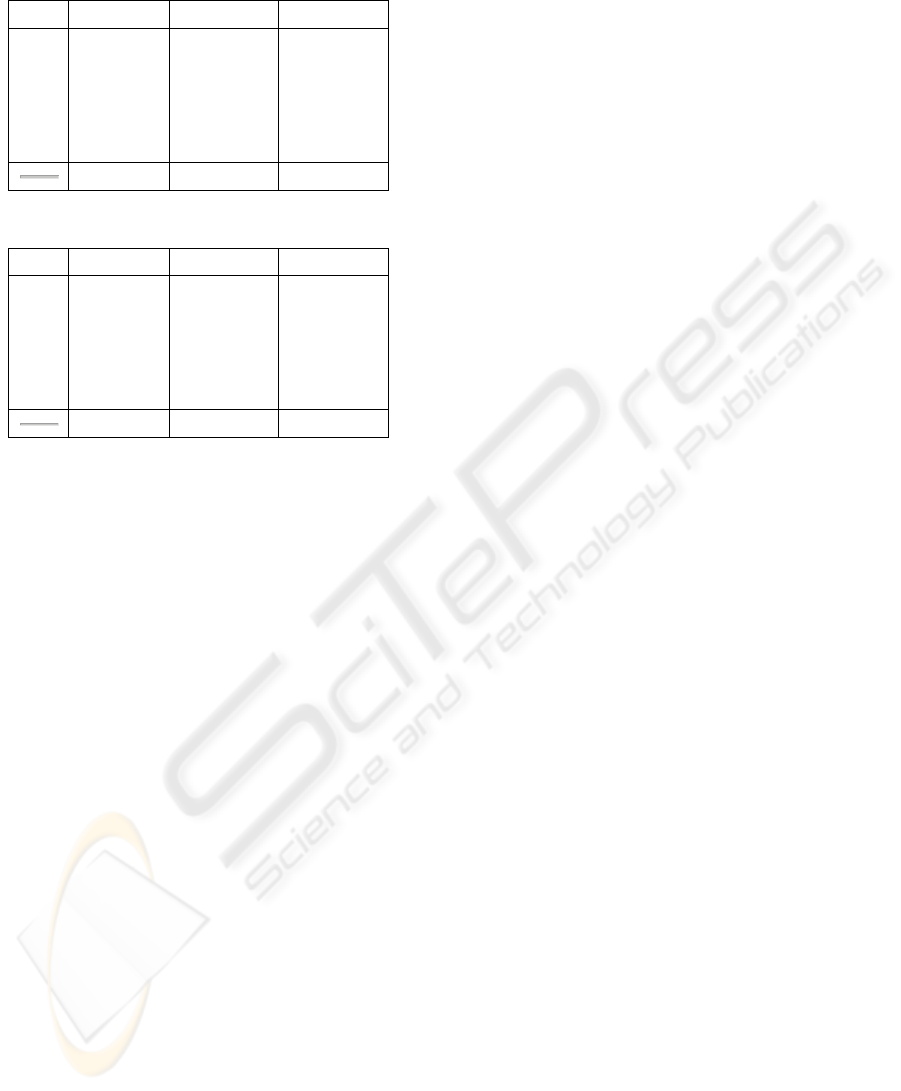
Table 1: Math vs. Nursery rhyme discrimination accuracy
results.
Subj. 61 elect. 19 elect. 10 elect.
1 75.8% 78.3% 61.5%
2 56.7% 63.3% 62.5%
3 59.2% 68.3% 53.3%
4 63.3% 73.3% 55.0%
5 73.3% 75.0% 70.8%
65.7% 71.7% 60.6%
Table 2: Left vs. Right discrimination accuracy results.
Subj. 61 elect. 19 elect. 10 elect.
1 72.5% 90.0% 75.0%
2 55.8% 76.7% 51.7%
3 55.8% 65.0% 50.8%
4 45.0% 58.3% 63.3%
5 53.4% 73.3% 63.3%
56.5% 72.6% 60.8%
For each subject (denoted with a number, for the
take of privacy), the mean values of results were
computed for two different sessions, considered
separately. No mixing of data was allowed from
different subjects, or from different sessions for the
same subject, as the results appear very different.
The accuracy in the case of usage of all the 61
electrodes is shown in the first column of the tables:
for some subject, as subject 1, it appears very high,
while it can be extremely low for some other
subjects. For instance, for subject 4 in table 2, it is
less than 50%: in this case, it could mean that,
paradoxically, a random selection between the two
choices would have given better results.
In the second column, the accuracy in the case of
19 electrodes is shown. As discussed above, an
accurate selection of best electrodes was done, in
function of the cortical areas mainly involved in the
four tasks of interest. Best results were carried out in
this case, obtaining accuracies over 70%. An error of
about 27% - 28% can be considered quite low,
accounting for the difficulty involved in the
experiment of interest: indeed, in every case, the
subject was required not to move any muscle, but
just to think of moving it. By the way, if a limb is or
is going to be really moved, the electrical activity in
the brain would become much more clear and could
be easily detected, as is shown in (Blankertz, 2006).
The accuracy in the cases of 10 electrodes is
shown in the third column. Presently, the number of
electrodes taken into account appears not sufficient
to get to good results. In particular, results appear
not useful for the discrimination between
mathematical operation and nursery rhyme, since the
selected electrodes are all around C
3
and C
4
, which
are mainly related to hand movements.
6 CONCLUSIONS
A classification method for brain-computer interface
is presented, which was able to discriminate among
different kind of mental tasks performed by a
subject. The method is based on a SVM classifier,
trained by the power frequency spectrum of EEG
signals coming from 61 electrodes set in the head
surface.
The experimental tests proved quite useful
results in case of 19 electrodes, while poor results
were obtained for 61 electrodes. This occurence is
likely to depend from the small number of trials, as
SVM method always requires a high number of
them, accounting for the large number of features to
be considered. In addition, large accuracy disparity
was found in the cases of different subjects: for
instance, in the case of 19 electrodes, accuracy up to
90% was obtained with subject 1, but just a little
over 58% with subject 4.
The results appear quite interesting compared
with other similar works, as in (Schogl, 2005), in
which different methods of classification are
considered. It was also shown SVM method to get
the best result, with accuracy average of about 63%.
The essential rules of the electrode number and
position are here pointed out, as they can
dramatically affect the classifier performance.
Future developments will include the time
domain analysis, in addition to the frequency
domain here examinated. It could be also interesting
to investigate the effect of data artefacts. They can
arise, for example, if the subject sometime can blink,
and this can produce noise in the EEG, getting worse
the performance of the classifier. Significant
improvements could be carried out cleaning the data
from this kind of noise.
REFERENCES
Huan N. J. and Palaniappan R., 2004. Neural network
classification of autoregressive features from
electroencephalogram signals for brain–computer
interface design. In Journal of Neural Engineering
vol. 1, 142-150.
Wolpaw J. R., Birbaumer N. McFarland D. J, Pfurtscheller
G. and Vaughan T. M. 2002. Brain-computer
SVM EVALUATION FOR BRAIN COMPUTER INTERFACE SYSTEMS
243

interfaces for communication and control. In
Clinical.Neurophysiology, vol. 113, no. 6, , pp. 767-
791.
Schogl, A. Lee F., Bischof H.and Pfurtscheller G., 2005
Characterization of four-class motor imagery EEG
data for the BCI-competition. In Journal of
NeuralEngineering, vol. 2, L14-L22.
Yoo S.S., Fairneny T., Chen N. K., Choo S. E., Panych P.,
Park H., Lee S. Y., Jolesz F. A., 2004. “Brain-
computer interface using fMRI: spatial navigation by
thoughts”, In Neuroreport. Jul 19;15(10):1591-5.
Sharbrough F, Chatrian G-E, Lesser RP, Lüders H, Nuwer
M, Picton TW., 1991. American
Electroencephalographic Society Guidelines for
Standard Electrode Position Nomenclature. In J. Clin.
Neurophysiol 8: 200-2.
Blankertz B., Dornhege G., Krauledat M., Müller K.-R.,
Kunzmann V., Losch F., Curio G., 2006. The Berlin
Brain-Computer Interface: EEG-based communication
without subject training. In Transactions On Neural
Systems And Rehabilitation Engineering, Vol. 14,
Issue 2, pp. 147-152.
Brazier, M. A. B., 1970. The Electrical Activity of the
Nervous System, Pitman, London.
Ward LM, Doesburg SM, Kitajo K, MacLean SE,
Roggeveen AB., 2006. Neural synchrony in stochastic
resonance, attention, and consciousness. In Can J Exp
Psychol. Dec;60(4):319-26.
Walker, 1999. Chambers Dictionary of Science and
Technology, Chambers Harrap Publishers, 2nd ed., p.
312, P.M.B.
Jolliffe I.T., 2002. Principal Component Analysis, 2nd ed.,
Springer, NY.
Burges C.J.C., 1998. A tutorial on support vector
machines for pattern recognition. In Data Mining and
Knowledge Discovery 2, Kluwer, 1998, pp.121-167.
Joachims T., 1999. Making large scale SVM learning
practical.
Scholkopf B., Burges C.J.C. and Smola A.J., 1999.
Advances in Kernel Methods-Support Vector
Learning, Eds, MIT Press, Cambridge, MA, 1999, pp.
169-184 (http://svmlight.joachims.org/).
BIOSIGNALS 2010 - International Conference on Bio-inspired Systems and Signal Processing
244
