
DISCRIMINATION BETWEEN ISCHEMIC AND HEART-RATE
RELATED ST-EPISODES
Non-linear Classification for an Online Capable Approach
S. Zaunseder
Fraunhofer IPMS, Maria-Reiche-Strasse 2, Dresden, Germany
W. Aipperspach, R. Poll
Institute of Biomedical Engineering, Dresden University of Technology, Dresden, Germany
Keywords:
Ischaemia, Heart-rate related ST-episodes, Karhunen-Lo`eve-Transformation, Ventricular repolarization, Arti-
ficial neural networks, Online classification.
Abstract:
Transient ST-epsiodes recognized in the ECG are regarded as marker of myocardial ischemia. As disturbed
ST-sections may appear as ST-episodes a differentiated analysis is necessary to avoid misinterpretations. The
presented study aims for the discrimination of ischemic and heart-rate related ST-episodes. Our approach
includes the morphologic description of the ventricular repolarization by means of the Karhunen-Lo`eve-
Transformation and the non-linear classification using an artificial neural network. The proposed selection
of used ECG segments guarantees that the classification procedure indicating ischemic attacks can be done
before the complete episode is acquired. This online-capable approach gains accuracies up to 94,2 % for the
discrimination of ischemic and heart-rate related ST-episodes.
1 INTRODUCTION
The reliable detection of transient myocardial is-
chemia by automated ECG processing still remains
a challenging task. A wide variety of non-ischemic
factors affect the correct detection of ischemic
events (Moody and Jager, 2003). Typically, that ECG
signal segment is analysed to detect ischemia which
contains the ventricular repolarization (VR) or a part
of the VR. Basically, three methods have been pointed
out:
• ST-level: At a single point within the ST-segment
the difference between the given amplitude and
the isoelectric level of the considered beat is mea-
sured (Smrdel and Jager, 2004; Stadler et al.,
2001; Taddei et al., 1995)
• Several discrete features typically including the
ST-deviation, ST-Slope and the T-wave peak are
combined to classify ECG segments as ischemic
ones (Exarchos et al., 2006; Papaloukas et al.,
2002)
• Complete morphology: Sections of the signal (or
transformed sections of the signal constituting a
more efficient data representation) are considered
as a whole to detect ischemia (Jager et al., 1998;
Minchole et al., 2005; Papadimitriou et al., 2001)
The ST-level carries highly relevant information re-
garding ischemic events. The computational simplic-
ity and the interpretability account for the wide us-
age of the ST-level as criterion. However, limitations
of the automated processing arise from non-ischemic
factors causing modifications of the VR. Thus, fur-
ther characterizations of the ST-episodes are required
to exclude non-ischemic factors. (Smrdel and Jager,
2008)
The correct classification of occurring alterations
of the VR may be hindered by non-specific distortions
(e.g. baseline wander, muscle noise, atrial fibrilla-
tion). Furthermore, there exist factors that specifically
alter the VR. The most challenging factors include
sudden or slow shifts in the electrical axis of the heart,
changes in the ventricular conduction and heart-rate
(HR) related modifications (Jager et al., 2003).
Promising approaches have been presented to de-
tect the shifts in the electrical axis of the heart and the
245
Zaunseder S., Aipperspach W. and Poll R. (2010).
DISCRIMINATION BETWEEN ISCHEMIC AND HEART-RATE RELATED ST-EPISODES - Non-linear Classification for an Online Capable Approach.
In Proceedings of the Third International Conference on Bio-inspired Systems and Signal Processing, pages 245-251
DOI: 10.5220/0002722802450251
Copyright
c
SciTePress

Table 1: Used features to distinguish between ischemic and HR related ST-episodes. The symbol ’∆’ refers to features
calculated as difference between the respective feature values of two intervals.
Group Feature specification
HR - Mean HR (Xing et al., 2007)
- ∆ HR (Faganeli and Jager, 2008; Minchole et al., 2007)
- Maximum HR (Faganeli and Jager, 2008; Minchole et al., 2007)
HRV - Low frequency high frequency ratio (Xing et al., 2007)
- Center frequency (Xing et al., 2007)
Repolarisation - ST-deviation (Langley et al., 2003)
- ∆ ST-deviation (Faganeli and Jager, 2008; Langley et al., 2003; Minchole et al., 2007)
- ST-segment morphology (ST-segment sample values, ∆ ST-Slope, ∆ Legendre coefficients,
ST-segment root mean square) (Faganeli and Jager, 2008; Zimmerman et al., 2003)
Depolarisation - ∆ Maximum QRS-slopes (Minchole et al., 2007)
- ∆ QRS morphology (KLT based Mahalanobis distance) (Faganeli and Jager, 2008)
Others - Correlation between ST-deviation and heart rate (Minchole et al., 2007)
- Group Delay (caluclated from Smoothed Pseudo-Wigner-Ville Distribution) (Xing et al., 2007)
changes in the ventricular conduction (Dranca et al.,
2006; Smrdel and Jager, 2004). Typically, those ap-
proachesare based on the assessment of modifications
of ventricular depolarization and are referred to as ref-
erence tracking (Smrdel and Jager, 2004). The HR
related modifications are hardly separable from is-
chemic modifications. Some approacheshavedemon-
strated their general capability. But still existing lim-
itations claim for further investigations of physiolog-
ical and methodical aspects. Thus, our study intends
to distinguish HR related ST-episodes from ischemic
ones. Thereby, our investigations focus on morpho-
logic modifications of the entire VR, precisely the ST-
T-interval, during transient ST-episodes.
The paper is organized as follows: Section 2 gives
a comprehensive overview of the approaches dedi-
cated to the discrimination of ischemic episodes from
HR related ones. Section 3 contains information on
methodology, data material and the procedure of sig-
nal processing. Section 4 shows numerical results.
The discussion of the results and some conclusions as
well as perspectives are given in section 5 and sec-
tion 6, respectively.
2 STATE OF THE ART
2.1 Former Studies
The Computers in Cardiology Challenge entitled
”Distinguishing ischemic from non-ischemic ST
changes” faced the outlined problem in 2003 (Moody
and Jager, 2003). Finally, there were only two partici-
pating groups submitting an approach. Howeversome
more publications dealing with this subject have been
published afterwards. The preparation of the com-
plete Long-Term ST-Database (LTSTDB) was the
precondition for comparable investigations into this
topic.
Usually the classification process of ST-episodes
as ischemic or HR related ones is characterized as
follows: 1. Selection of features → 2. Selection of
signal intervals → 3. Calculation of the selected fea-
tures in the selected time intervals corresponging with
an episode → 4. Episode classification → 5. Repeat
step 3-4 for all episodes.
The classification is typically based on a set of fea-
tures F = {F
1
, F
2
, ..., F
N
}. The features are extracted
from certain signal intervals I positioned in relation to
the ST-episode (see Figure 1). Examined features in-
clude the ST-deviation, HR related features, features
based on the heart rate variability (HRV) as well as
different morphological features (for a more compre-
hensivelist see table1). The feature selection process,
if carried out, and the classification process is usually
accomplished by linear methods (Faganeli and Jager,
2008; Minchole et al., 2007; Xing et al., 2007).
Table 2 gives the results yielded in different stud-
ies distinguishing between ischemic episodes and HR
related ones. Note, that the used test data and some
boundary conditions vary between the studies. This
leads to a lack of comparability.
2.2 Problem Specification
In our opinion two aspects should be investigated.
Non-linear Separability. As a linear separability of
the features in the feature space is not proven, the us-
age of a non-linear classifier is examined.
Online Classification. For the future we aim to use
the classification within ambulatory monitoring de-
vices. The approaches proposed in the literature re-
quire the ST-episode to be terminated, thus not al-
lowing an online application. Our idea is to carry
BIOSIGNALS 2010 - International Conference on Bio-inspired Systems and Signal Processing
246
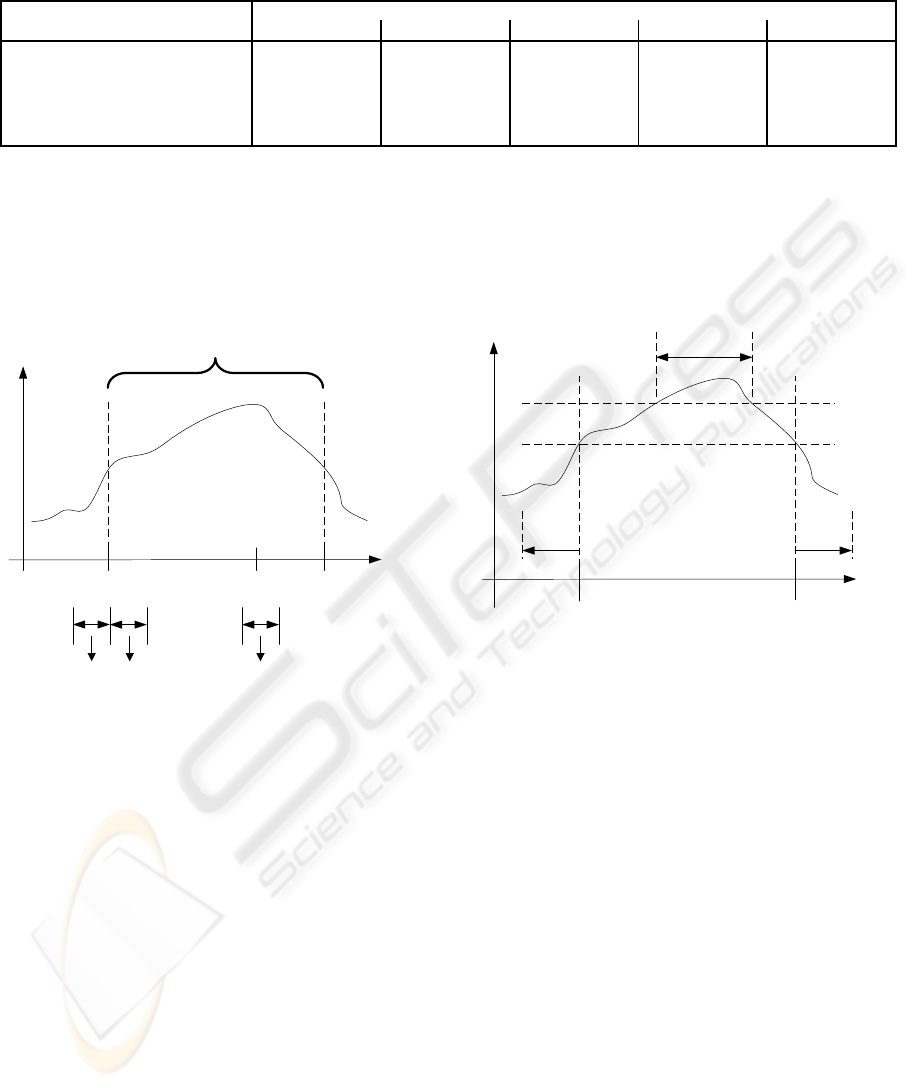
Table 2: Results obtained in different studies distinguishing ischemic and heart-rate related ST-episodes (details on the mea-
sures used to describe the performance are given in section 4).
Study Obtained results in %
Se Sp +P −P Acc
(Faganeli and Jager, 2008)
a
77.9 73.9 (93.5)
b
(40.9)
b
(77.2)
b
(Langley et al., 2003)
c
98.3 - 82.8 - -
(Minchole et al., 2007)
d
82.2 88.4 87.6 83.2 83.1
(Xing et al., 2007)
e
- - - - 86.2
(Zimmerman et al., 2003)
c
63.8 - 48.2 - -
a
As basis for the definition of ST-episodes the single-channel annotations are used
b
Values are calculated using the numbers given in the contribution
c
Results obtained with the CinC challenge ST-episodes (including many events not constituting relevant ST-episodes as
defined by annotation protocol B)
d
623 ischemic and 112 heart-rate related episodes are used for classification, the remaining episodes were excluded manu-
ally from the classification due to problems in the feature extraction phase
e
Selected episodes (61 ischemic and 26 heart-rate related episodes from 21 patients) are used
ST-episode
maximumbeginning end
time
I
1
I
2
I
3
ST-deviation
F
I
F
I
F
I
1 2 3
Figure 1: Intervals used to extract features. Although exact
timing and number of the intervals may vary, the outlined
timing (just before and after the annotated starting point (I
1
and I
2
, respectively) and around the maximum ST-deviation
(I
3
) of the transient ST-episode) is common.
out the classification at the instant the ST-deviation is
long-standing and pronounced enough to be referred
to as an ST-episode. Thus, an online processing of
ST-episodes becomes possible.
3 MATERIALS AND METHODS
3.1 The Long-term ST-Database
In our study, the Long-Term ST-Database (LT-
STDB) (Jager et al., 2003) which is freely available
on Physionet (Goldberger et al., 2000) is used.
The LTSTDB consists of 86 Holter ECG record-
ings of 21 up to 24 hours length. Each record con-
beginning end
time
ST-deviation
T
min
thres
1
thres
2
> 30 s
> 30 s
Figure 2: Annotation of relevant transient ST-episodes. In
accordance with annotation protocol B of the LTSTDB, an
episode is annotated if the minimum threshold thres
1
of
100µV is exceeded for a minimum time T
min
of at least 30s.
To find the boundaries of the episode, the ST-deviation must
stay under the delineation threshold thres
2
of 50µV for at
least 30 s.
tains two or three ECG channels sampled at 250 sam-
ples per second. Based on the ARISTOTLE algo-
rithm (Moody and Marc, 1982), the annotation of the
fiducial points q
i
of all QRS-complexes is provided.
Medical information created by experts is also in-
cluded for every record: a measure of the ST-segment
variations compared to the isoelectric level (named
ST-level function) is provided. Furthermore, a func-
tion accounting for non-ischemic factors like axis-
shift and conduction changes is prepared (named ST-
reference function). A third function is named ST-
deviation function. It is the combination of ST-level
function and ST-reference function and serves as the
basis extracting significant transient ST-episodes.
ECG segments are considered as ST-episodes if
the ST-deviation function exceeds a minimum thresh-
old thres
1
for a minimum time T
min
(see figure 2).
DISCRIMINATION BETWEEN ISCHEMIC AND HEART-RATE RELATED ST-EPISODES - Non-linear Classification
for an Online Capable Approach
247

Using the annotation protocol B of the LTSTDB, the
settings are T
min
= 30 s and thres
1
= 100µV. To con-
firm the beginning and end of an episode, the record-
ing must run at least 30s below threshold thres
2
of
50 µV. Each lead is annotated seperately. The final
annotation of transient ST-episodes for each of the 86
records is derived by the disjunction of all single-lead
based annotations. Further on, the time and absolute
value of maximum ST-deviation of each channel indi-
cating the ST-episode is part of the annotation. (Jager
et al., 2003)
Each of the annotated ST-episodes is classified
as ischemic or HR related by experts. This ST-
episodes are the input to our classification process.
The expert classification of the episodes determines
the gold standard. Following annotation protocol B of
the LTSTDB, overall 912 transient ST-episodes (743
ischemic and 169 HR related epsiodes) are found.
There is one constraint forcing us to exclude 10
episodes from the evaluation (9 epsiodes from record
s30661, 1 episode from record s20621). Due to per-
sistent ventricular arrhythmic events in these episodes
it was not possible to extract a representative normal
beat for at least one of the intervals required in the
classification process. Therefore, 10 episodes were
discarded resulting in 902 ST-episodes to classify.
I
1
I
2
I
3
F
I
F
I
F
I
1 2 3
beginning end
time
ST-deviation
t
x
thres
1
thres
2
30 s
Figure 3: Maximum independent timing of intervals used
to extract the features for the classification. Note, that the
classification can be carried out at the instant a ST-deviation
is referred to as an ST-episode follwing the annotation pro-
tocol B of the LTSTDB.
3.2 Used Time Intervals
Within a typical processing, one signal interval (e.g.
I
3
in figure 1) for the feature extraction is used whose
timing depends on the maximum ST-deviation of the
considered episode (”maximum based approach”). To
find out the global extremum the whole episode must
be known, thus, forcing the classification to be car-
ried out after the end of the episode. This is a serious
disadvantage to the processing as an episode may last
some minutes. From the medical point of view it is
desirable to carry out the classification before the at-
tac is finished. Therefore we developed an approach
using a different position of the time interval I
3
. We
use the instant t
x
- the earliest instant at which the ST-
episode is confirmed (according to annotation proto-
col B this applies when thres1 is exceeded for 30 s).
The time interval I
3
is situated directly before t
x
(”on-
line capable approach”; see figure 3). We compare
the developed approach with a typically used maxi-
mum based approach. For both approaches the inter-
vals I
1
and I
2
are placed directly before and after the
onset of the ST-Episode. The duration of all intervals
is equally set to 20s.
3.3 Morphologic ECG description
3.3.1 KLT based signal description
The Karhunen-Lo`eve-Transformation (KLT) is a sig-
nal dependent linear transform. The KLT ensures the
minimization of the resulting square error between an
original signal x, also called pattern vector, of length
N and its reconstruction x
rec
calculated from a feature
vector consisting of n KLT coefficients kl
1
. . . kl
n
with
n < N. Due to its advantegeous properties the KLT is
a widely used concept in different fields of automatic
ECG processing (Castells et al., 2007).
Precondition for successful signal transformation
using the KLT are adequate basis functions Φ. The
basis functions are the eigenvectors of the covariance
matrix C established by all training patterns
C = E
n
(X−M)(X−M)
T
o
(1)
where X is a matrix containing all pattern vectors and
M is a matrix same-sized as X containing copies of
the mean m of all pattern vectors. The eigenvector
with the i-biggest eigenvalues λ
i
constitutes the i
th
ba-
sis function.
3.3.2 Construction of Pattern Vectors
As described above, the KLT represents a pattern vec-
tor, here the VR, by a feature vector. The method
used to create the pattern vectors in this work is de-
rived from the one proposed by Laguna et al. (Laguna
et al., 1999) (slight modifications are related to the
preprocessing and the length of the resulting pattern
vectors; details beneath).
For preprocessing purposes, a FIR bandpass filter
(lower -3dB cut-off frequency at 0.5 Hz, upper -3dB
BIOSIGNALS 2010 - International Conference on Bio-inspired Systems and Signal Processing
248

20 40 60 80 100 120
−0.2
−0.15
−0.1
−0.05
0
0.05
0.1
0.15
0.2
sample k
arbitrary units
Φ
1
Φ
2
Φ
3
Φ
4
Figure 4: First 4 KLT basis functions calculated using the
scheme outlined in section 3.3.3.
cut-off frequency at 17Hz) is applied to the ECG. As
no useful information regarding the global morphol-
ogy of VR is expected (Blanchett et al., 1998; La-
guna et al., 1999; Thakor et al., 1984), the filter can be
used to reduce effectively baseline wander and high-
frequency distortions.
As ECG segment stt
i
containing the VR of beat i
we regard the section of the signal starting at 85ms
after the fiducial point q
i
of QRS complex i ending
240 ms prior to q
i+1
. If the intervall rr
i
between q
i
and
q
i+1
falls below 720ms the end of the VR is assumed
to be at q
i
+
2
3
rr
i
. The extracted segment is aligned
by the isoelectric level of the corresponding beat cal-
culated using the algorithm proposed by Jager (Jager,
2006). Therewith, stt
i
is an isoelectric corrected ECG
segment of variable length l.
The resulting vector of stt
i
is filled in the pattern
vector x
i
, this is to say x
i
(k) = stt (k) for all k < l.
The pattern vectors x are restricted to 120 samples in
length (480ms), for k > l therefore x
i
(k) = 0. All
samples of stt (k) with k > 120 are discarded. In (La-
guna et al., 1999) a resampling is applied to stt
i
and a
maximum length of 160 samples is used.
3.3.3 Construction of KLT Basis Function
To construct the basis functions of the KLT the com-
plete LTSTDB is used. The pattern vectors for the
construction of X are extracted following the method
outlined in section 3.3.2. Signal sections marked as
”noise” are excluded. Furthermore, premature con-
tractions as well as beats adjacent to premature con-
tractions are excluded. To account for the different
energies contained in different morphologies, a nor-
malization of beat energy to 1 is done. Figure 4 con-
tains the first 4 resulting KLT basis functions.
The cumulated energy CE
n
, calculated by
CE
n
=
∑
n
i=1
λ
i
∑
N
i=1
λ
i
(2)
describes the capability of the transform to represent
data with a limited number of n coefficients. Figure 5
contains the CE for different n.
1 2 3 4 5 6
0
0.5
1
number of used eigenvektors
cumulated energy
Figure 5: Cumulated energy using different numbers of
KLT cofficients.
3.3.4 Calculation of Representative Feature
Vectors
The calculation of morphology (feature vector) which
is representative for the interval I under consideration
can be divided in two steps: transformation of the pat-
tern vectors contained in that interval by means of the
KLT and formation of a morphology representing the
dominant morphology within the signal segment un-
der consideration.
Step one includes the extraction of the set X
I
=
{x
1
, x
2
, . . . , x
M
} containing all M pattern vectors x
i
derivedfrom the interval I using the scheme described
in section 3.3.2. Each of the pattern vectors is trans-
formed seperatly into a feature vector b with n coeffi-
cients.
Step two aims to sort out outliers and to con-
struct a representative beat. Therefore, the median
beat med is obtained, using the medians of all co-
efficient values. Around this median, a fixed ra-
dius r is defined. All feature vectors b
i
∈ B
I
within
the predefined radius r using the Euclidean distance
k.k are considered as member in the set of poten-
tially representative beats B
I
rep
⊆ B
I
. This is to say
B
I
rep
= {b
i
| kb
i
−medk< r|i ∈{1, 2, . . . M}}. The
representative feature vector is calculated as the av-
erage over all elements in B
I
rep
.
3.4 Classification Procedure
3.4.1 Classification by Means of Multilayer
Perceptrons
Artificial neural networks (ANN) have the capabil-
ity to solve highly complex and non-linear problems.
Achieving high performance while maintaining rela-
tively simplicity in their implementation render ANN
very useful for classification tasks and account for
DISCRIMINATION BETWEEN ISCHEMIC AND HEART-RATE RELATED ST-EPISODES - Non-linear Classification
for an Online Capable Approach
249

Table 3: Results of the evaluation using different interval timings.
Study Obtained results in % ± confidence interval (α = 0.05)
Se Sp +P −P Acc
max-based 96.83±0.09 87, 45±0.36 97.13±0.08 86, 35±0.36 95.09±0.10
online-based 96.32±0.10 85.00±0.40 96.56±0.09 84.13±0.37 94.21±0.10
the today’s wide use of ANN in the field of ECG
processing. (Maglaveras et al., 1998) Shortcomings
of ANN are the lack of interpretability and the non-
deterministic results due to random initialisation.
Probably, the multilayer perceptron is the most
widespread neural network. It belongs to the class
of supervised learning networks. We restricted our-
selfes to a kind of basic MLP characterized by feed-
forward architecture, one hidden layer and fully con-
nected adjacent layers. Our MLP showed a 24-36-1
architecture (24 input neurons, 36 hidden neurons, 1
output neuron). For the learning phase we used the
backpropagation algorithm (Rumelhart et al., 1986).
3.4.2 Training and Evaluation Procedure
The validity of the results is limited by the number of
episodes, the number of evaluation iterations and the
non-deterministic network training. To cope with this
problems we evaluate our method using a repeated
stratified k-fold cross validation scheme (k = 10, ran-
dom initialisation of the weight matrices of the MLP,
N = 100 repetitions) (Kohavi, 1995).
The statistical evaluation is done using confidence
intervals. Using the t-distribution the confidence in-
tervals around the mean classification performance µ
is estimated by
x−t
n−1;1−
α
2
·
s
√
n
≤ µ ≤x+t
n−1;1−
α
2
·
s
√
n
(3)
Thereby x =
1
N
∑
N
i=1
x
i
and s =
q
1
N−1
∑
N
i=1
(x
i
−x)
2
.
The result of the classification µ lies with a probability
of 1−α in the given intervals.
3.4.3 Test Sets
Because of the different interval timing using the
maximum based approach and the online capable ap-
proach two different test sets result. Within each test
set for all three time intervals and two channels, the
first four KLT coefficients are used (see figure 5), thus
resulting in 24 KLT coefficients for each ST-episode.
4 RESULTS
The performance evaluation of the classification for
the different test sets is based on the confusion ma-
trix containing the events true positive (TP) (ischemia
existent and classified), false positive (FP) (ischemia
existent and HR related episode classified), true neg-
ative (TN) (HR related episode existent and classi-
fied) and false negative (FN) (HR related episode ex-
istent and ischemia classified). These events lead to
the statistical values sensitivity Se =
TP
TP+FN
, specifity
Sp =
TN
TN+FP
, positive predictivity +P =
TP
TP+FP
, neg-
ative predictivity −P =
TN
TN+FN
and accuracy acc =
TP+TN
TP+FP+TN+FN
.
Table 3 contains the results of the evaluation. Ad-
ditionally to the mean classification performance the
confidence intervals (α = 0.05) are included.
5 DISCUSSION
Non-linear Classification. The usage of a non-linear
classifier shows high performance. The obtained re-
sults (Se = 96.8%, +P = 97.1%; as Se and +P de-
scribe the handling of true ischemic episodes they are
of major interest) outperform the results described in
the literature, some of them by a considerable amount
(compare table 2 and table 3).
Online Capability. The results using the online ca-
pable interval timing are very convincing (a drop in
Se and +P of less than 1%). The used intervals
do not necessarily consider the biggest morphologi-
cal change within the ST-episode. But the compari-
son concerning the timing within different episodes is
possible. This property could be an even more appro-
priate basis for the classification.
General Limitations. The results obtained by using
standardized data are representative and reproducible.
Thus, the LTSTDB and its annotations provide a good
basis for our investigation. Nevertheless, the number
of ischemic and HR related morphological alterations
contained in the LTSTDB is limited. Further on, a
part of the data is used for training purposes. Thus, it
is only possible to generalize the results to a limited
extent.
6 CONCLUSIONS
The obtained results render the KLT-based morphol-
ogy description in combination with a non-linear clas-
BIOSIGNALS 2010 - International Conference on Bio-inspired Systems and Signal Processing
250

sification scheme as very useful in the classification of
ischemic and HR related transient ST-episodes. They
indicate the possibility of a future online application
which allows the usage of the method in monitoring
devices.
REFERENCES
Blanchett, T., Kember, G. C., and Fenton, G. A. (1998). Klt-
based quality controlled compression of single-lead
ecg. IEEE Trans Biomed Eng, 45(7):942–945.
Castells, F., Laguna, P., Sornmo, L., Bollmann, A., and
Millet-Roig, J. (2007). Principal component analysis
in ecg signal processing. EURASIP Journal on Ad-
vances in Signal Processing, 1:1–21.
Dranca, L., Goni, A., and Illarramendi, A. (2006). Us-
ing decisiontrees for real-time ischemia detection. In
CBMS, pages 719–726.
Exarchos, T. P., Papaloukas, C., Fotiadis, D. I., and
Michalis, L. K. (2006). An association rule mining-
based methodology for automated detection of is-
chemic ecg beats. IEEE Trans Biomed Eng,
53(8):1531–1540.
Faganeli, J. and Jager, F. (2008). Automatic distinguishing
between ischemic and heart-rate related transient st
segment episodes in ambulatory ecg records. In CinC,
pages 381–384.
Goldberger, A. L., Amaral, L. A., Glass, L., Hausdorff,
J. M., Ivanov, P. C., Mark, R. G., Mietus, J. E., Moody,
G. B., Peng, C. K., and Stanley, H. E. (2000). Phys-
iobank, physiotoolkit, and physionet: components of
a new research resource for complex physiologic sig-
nals. Circulation, 101(23):E215–E220.
Jager, F. (2006). Advanced Methods And Tools for ECG
Data Analysis, Chapter 9: Introduction to Feature Ex-
traction, pages 245–264. Artech House.
Jager, F., Moody, G. B., and Mark, R. G. (1998). Detec-
tion of transient st segment episodes during ambula-
tory ecg monitoring. Comput Biomed Res, 31(5):305–
322.
Jager, F., Taddei, A., Moody, G. B., Emdin, M., Antolic, G.,
Dorn, R., Smrdel, A., Marchesi, C., and Mark, R. G.
(2003). Long-term st database: a reference for the de-
velopment and evaluation of automated ischaemia de-
tectors and for the study of the dynamics of myocar-
dial ischaemia. Med Biol Eng Comput, 41(2):172–
182.
Kohavi, R. (1995). A study of Cross-Validation and Boot-
strap for Accuracy Estimation and Model Selection.
In IJCAI, pages 1137–1145.
Laguna, P., Moody, G. B., Garca, J., Goldberger, A. L., and
Mark, R. G. (1999). Analysis of the st-t complex of
the electrocardiogram using the karhunen–love trans-
form: adaptive monitoring and alternans detection.
Med Biol Eng Comput, 37(2):175–189.
Langley, P., Bowers, E., Wild, J., Drinnan, M., Allen, J.,
Sims, A., Brown, N., and Murray, A. (2003). An al-
gorithm to distinguish ischaemic and non-ischaemic st
changes in the holter ecg. In CinC, pages 239–242.
Maglaveras, N., Stamkopoulos, T., Diamantaras, K., Pap-
pas, C., and Strintzis, M. (1998). ECG pattern recog-
nition and classification using non-linear transforma-
tions and neural networks: a review. Int J Med Inform,
52:191–208.
Minchole, A., Jager, F., and Laguna, P. (2007). Discrimina-
tion between demand and supply ischemia episodes in
holter recordings. In Conf Proc IEEE Eng Med Biol
Soc, volume 2007, pages 2579–2582.
Minchole, A., Skarp, B., Jager, F., and Laguna, P. (2005).
Evaluation of a root mean squared based ischemia de-
tector on the long-term st database with body position
change cancellation. In CinC, pages 853–856.
Moody, G. and Jager, F. (2003). Distinguishing is-
chemic from non-ischemic st changes: the phys-
ionet/computers in cardiology challenge 2003. In
CinC, pages 235–237.
Moody, G. and Marc, R. (1982). Development and evalua-
tion of a 2-lead ecg analysis program. In CinC, pages
39–44.
Papadimitriou, S., Mavroudi, S., Vladutu, L., and Beze-
rianos, A. (2001). Ischemia detection with a self-
organizing map supplemented by supervised learning.
IEEE Trans Neural Netw, 12(3):503–515.
Papaloukas, C., Fotiadis, D. I., Likas, A., Stroumbis, C. S.,
and Michalis, L. K. (2002). Use of a novel rule-based
expert system in the detection of changes in the st seg-
ment and the t wave in long duration ecgs. J Electro-
cardiol, 35(1):27–34.
Rumelhart, D., Hintont, G., and Williams, R. (1986). Learn-
ing representations by back-propagating errors. Na-
ture, 323:533–536.
Smrdel, A. and Jager, F. (2004). Automated detection of
transient st-segment episodes in 24 h electrocardio-
grams. Med Biol Eng Comput, 42(3):303–311.
Smrdel, A. and Jager, F. (2008). An algorithm to esti-
mate the st segment level in 24-hour ambulatory ecg
records. In CinC, pages 701–704.
Stadler, R. W., Lu, S. N., Nelson, S. D., and Stylos,
L. (2001). A real-time st-segment monitoring algo-
rithm for implantable devices. J Electrocardiol, 34
Suppl:119–126.
Taddei, A., Costantino, G., Silipo, R., Emdin, M., and
Marchesi, C. (1995). A system for the detection of
ischemic episodes in ambulatory ecg. In CinC, pages
705–708.
Thakor, N. V., Webster, J. G., and Tompkins, W. J. (1984).
Estimation of QRS complex power spectra for design
of a QRS filter. IEEE Trans Biomed Eng, 31(11):702–
706.
Xing, W., Liang, X., Zhongwei, S., Zibin, Y., and Yi, P.
(2007). Heart rate variability analysis of ischemic and
heart rate related st-segment deviation episodes based
on time-frequency method. In NFSI-ICFBI, pages
162–164.
Zimmerman, M., Povinelli, R., Johnson, M., and Ropella,
K. (2003). A reconstructed phase space approach for
distinguishing ischemic from non-ischemic st changes
using holter ecg data. In CinC, pages 243–246.
DISCRIMINATION BETWEEN ISCHEMIC AND HEART-RATE RELATED ST-EPISODES - Non-linear Classification
for an Online Capable Approach
251
