
ESTIMATE VIGILANCE IN DRIVING SIMULATION BASED ON
DETECTION OF LIGHT DROWSINESS
Hong-Jun Liu, Qing-Sheng Ren and Hong-Tao Lu
MOE-Microsoft Laboratory for Intelligent Computing and Intelligent Systems
Department of Computer Science and Engineering, Shanghai Jiao Tong University, Shanghai 200240, China
Keywords:
EEG, Vigilance, Driving, Light drowsiness.
Abstract:
Avoiding fatal accidents caused by low vigilance level in driving is very important in our daily lives. Elec-
troencephalography (EEG) has been proved very effective for measuring the level of vigilance. In this paper,
we identify light drowsiness state from other states to estimate vigilance level decline by using support vector
machine (SVM). Light drowsiness EEG is marked by alpha increasing to 50%. Alert EEG is marked by dom-
inant beta activity and other EEG is labeled as sleep state. Samples of EEG data are trained in SVM program
by using 4 features from each frequency band. Mutual information based feature selection method is used to
reduce the dimension of features. The accuracy in classification of alert and light drowsiness reaches 91.5%
on average.
1 INTRODUCTION
Studies on vigilance have shown that vigilance anal-
ysis is very useful to our daily lives (Weinger, 1999).
Low vigilance level while driving is a serious prob-
lem and is believed to be a direct cause of related
accidents (Lal and Craig, 2001). Light drowsiness,
which is dangerous for drivers, is a state before enter-
ing sleep. If symptoms of vigilance level decline and
light drowsiness appearance can be detected and used
to warn the driver, effective measure will be taken and
accidents will be prevented.
As there is no generally accepted international
standard on classification of different vigilance levels,
some studies used their own methods to divide vigi-
lance into several categories (Makeig et al., 1996; Lin
et al., 2006; Shi et al., 2007), and there are also some
studies followed sleep classification criterion (Nieder-
meyer and Silva, 2004; Schomer, 2007) which can
precisely divide driver vigilance level into alert and
sleep state (Yeo et al., 2009; Li et al., 2008). How-
ever, it will be too late if driver already falls into sleep.
For this reason, the vigilance level of drivers before
sleep needs further classification to predict the onset
of sleep.
In our study, we use EEG for vigilance analysis.
We divide the vigilance into 3 states from high level
to low level following Hori’s sleep classification (Hori
et al., 1994). Light Drowsiness state is between state
1 which is alert and state 3 which is sleep. EEG in
light drowsiness state is characterized as 1) alpha ac-
tivity increase to 50% of EEG data; 2) eye closures
greater than 0.5s. The performances of the driver
at light drowsiness are mostly characterized by de-
cline of eye blinking frequency, long time closure of
eyes and great decline of driving operation. EEG in
alert state is characterized as 1) EEG activity in the
beta frequency; 2) inter-eye blink intervals of 6-8s
(Doughty, 2002) and other EEG is labeled as sleep
state. As the eye blink patterns characteristic in each
state also shows in low frequency band in EEG data,
the Electro-Oculogram (EOG) artifact is not removed
in our analysis process. Considering the above vigi-
lance state transition properties, we extract features in
each frequency band. Experimental results show that
light drowsiness state can be correctly distinguished
from alert state and the sleep state by EEG.
This paper is organized as follows. In Section
2, vigilance experimental setup is introduced and the
method of estimating the vigilance level is presented.
In Section 3, experimental results are described. Fi-
nally, conclusions are given in Section 4.
131
Liu H., Ren Q. and Lu H. (2010).
ESTIMATE VIGILANCE IN DRIVING SIMULATION BASED ON DETECTION OF LIGHT DROWSINESS.
In Proceedings of the First International Conference on Bioinformatics, pages 131-134
DOI: 10.5220/0002724201310134
Copyright
c
SciTePress

2 METHOD DESCRIPTION
2.1 Experimental Setup and Data
Collection
In this study, ten healthy young volunteers, aged from
18 to 28 years old, were selected to take part in the
driving simulation experiment. They were required
to abstain from alcohol and caffeine drinks one day
before the experiment.
In the driving simulation environment, each sub-
ject was required to drive with a steering wheel. There
is a 19’ LCD screen which displays the simulating
driving scenes in front of the subject. The simulated
driving map consists of two long straight roads and
two spin turns. The completion of a circle needs about
10 minutes at the speed of 60km/h. The sceneries are
so monotonous that the subject may feel drowsy eas-
ily and even fall asleep. The simulated driving lasted
one and half an hour which was carried on in special
room whose temperature was about 27
◦
C and humid-
ity was between 40% and 60%.
The experiment data was acquired through 64
channels of signal system including 62 channels of
EEG and 2 channels of EOG. Electrodes are arranged
based on extended 10/20 system. The Ag/AgCl elec-
trodes are mounted inside the cap subject wore with
bipolar references behind ears. The EEG signal was
recorded at the sampling rate of 100Hz while the sub-
ject’s facial expression was recorded by a DV cam-
era in the same time, which was used for labeling
the EEG data. The EEG data from five subjects, who
had shown a tendency to fall asleep during the driv-
ing simulation, were selected for data analysis in this
paper.
2.2 Data Processing
The whole process consists of 3 steps. In the first step,
EEG pulse artifacts were removed by visual inspec-
tion, and then the raw EEG data were filtered using
Finite Impulse Response (FIR) filter with a pass band
of 1-40Hz. The filtered data were manually classified
into ’alert’ and ’light drowsiness and sleep’ classes
based on inspection of the video using two key iden-
tifiers:1) dominant EEG activity and 2) eye blink pat-
terns. The EEG data were labeled on two kinds of
time window with 5s and 15s. These data were ran-
domly divided into 50% of the test set and 50% of
the training set. In the second step, features were
extracted from the filtered 62 EEG signal channels,
and then a mutual information based feature selection
method was used to reduce the dimension of feature.
In the last step, SVM was used in classifying the EEG
feature data into two classes.
2.3 Feature Extraction
In this study, features are extracted by transforming
each afore-mentioned 5s or 15s EEG epochs into fea-
ture vectors. Various features are extracted based on
the power spectrum of EEG epochs, capturing both
spatial and temporal information that are useful for
optimally distinguishing from ’alert’ to ’sleep’ EEG
epochs. We use Fourier transform to extract the Power
Spectral Density (PSD) on each EEG data epoch.
The PSD was then divided into 5 segments accord-
ing to the 5 standard EEG frequency bands: delta (1-
4Hz), theta (4-8Hz), alpha (8-13Hz), beta (13-20Hz)
and gamma (20-40Hz) according to (Noachtar et al.,
2004). The following four features were extracted for
each frequency band:
2.3.1 Power Proportion (PR)
Because energy in each frequency band of every per-
son is quite different from each other, especially in al-
pha rhythm, total power of each band is useless. The
proportion of the energy in each band to total energy
of channel is very important to identify the vigilance
level. For example, the state in which alpha dropout
and theta appearance can be classified into sleep state
1 according to (Niedermeyer and Silva, 2004).
2.3.2 Variance of Power (VP)
Variance of power can characterize energy dispersion
in each frequency band. If subject falls into light
drowsiness state, energy in his alpha band will cen-
ter on a particular value range and VP will reduce in
the same time.
2.3.3 Average of Frequency (AF)
It is defined as
AF =
∑
i
P( f
i
) × f
i
(1)
where f is frequency and P(f) is the probability dis-
tribution of frequency. It can reflect the changes in
frequency over time.
2.3.4 Variance of Frequency (VF)
Variance of frequency is different from the feature VP
whose value is much larger. If the spectrum for a con-
sidered frequency band has two frequency peaks, the
value of VF will become larger. AF and VF have been
proved very useful in multilevel vigilance EEG clas-
sification (Shen et al., 2007).
BIOINFORMATICS 2010 - International Conference on Bioinformatics
132

2.4 Feature Selection
After feature extraction, each EEG epoch is con-
verted into a 1240 × 1 vector of quantitative
EEG features (62 channels × 5 f requency bands ×
4 kinds o f f eatures). The number of features is so
large that the computing speed and correct rate of
classification in light drowsiness detection will both
decline. Information of adjacent channels also has re-
dundancy. For these two reasons, we use a mutual
information based feature selection method called
mRMR (Peng et al., 2005) to reduce the dimension
of feature vector. This method selects feature subset
by optimizing max-relevance between feature subset
and target class, and min-redundancy among the fea-
ture subset.
Denote the i-th feature of EEG signals by x
i
and
the vigilance states by c. We just use labeled informa-
tion mentioned above to select the feature subset. Let
I(x
i
;c) denote the mutual information between x
i
and
c. Then the relevance between feature subset S
m
and
class c can be defined as
D =
1
| S
m
|
∑
x
i
∈S
m
I(x
i
;c) (2)
and the redundancy among the feature subset can be
defined as
R =
1
| S
m
|
2
∑
x
i
,x
j
∈S
m
I(x
i
;x
j
) (3)
where I(x
i
;x
j
) is the mutual information between x
i
and x
j
. The criterion of mutual information based
feature selection method is to maximize D − R. The
criterion operator can be defined as
Φ = D − R. (4)
Thus, the select feature subset should maximize Φ. In
practice, we reduce the number of features to about
10%.
2.5 Light Drowsiness Detection
SVM is a supervised learning method widely used
for classification and regression (Boser et al., 1992;
Cortes and Vapnik, 1995). In the research of vigilance
field based on EEG, SVM has been proved a pretty
effective classifier (Yeo et al., 2009). Classification
accuracy rate usually can be 90% or more. In this
study, SVM is also used for the purpose of classifi-
cation between ’alert’ and ’light drowsiness and sleep
state’ after the feature selection process. For the reli-
able detection of drowsiness, a nonlinear SVM is used
with the popular Gaussian kernel.
3 EXPERIMENTAL RESULTS
3.1 Choose Optimal Feature Number
After feature selection which is described in section
2.4, 1240 features are ordered by descending accord-
ing to their values of Φ. Figure 1 shows the curve in
which classification error rate changes with the num-
ber of features for different subjects. Depending on
the error rate curve, we choose 150 features as the
number of features in final classification.
Figure 1: SVM error rate using mRMR features.
3.2 Classification Rate
For the five chosen subjects, we test both SVM classi-
fication correct rate between ’alert’ and ’light drowsi-
ness and sleep state’ with 5s and 15s time window.
The training and test accuracies for these subjects are
shown in Table 1. The result on test date reaches
91.5% on average.
Table 1: The training and test correct rates of 5 subjects.
Sub1 Sub2 Sub3 Sub4 Sub5
5s Training 98.75% 99.86% 99.24% 100% 99.52%
5s Test 87.50% 92.60% 91.13% 97.71% 88.72%
15s Training 100% 100% 100% 100% 100%
15s Test 92.35% 93.48% 91.60% 97.75% 91.13%
The result of classification can be shown in Figure
2. Overlapping part in the figure describes that the
subject fought for keeping alert.
According to the features of sleep state 1 and sleep
state 2 in EEG (Schomer, 2007), we also labeled sleep
states for each EEG data with 5s time window. The
result in which sleep state is extracted can be shown in
Figure 3. The correct rate of separating ’sleep state’
from ’light drowsiness and sleep state’ can reach to
98%.
ESTIMATE VIGILANCE IN DRIVING SIMULATION BASED ON DETECTION OF LIGHT DROWSINESS
133
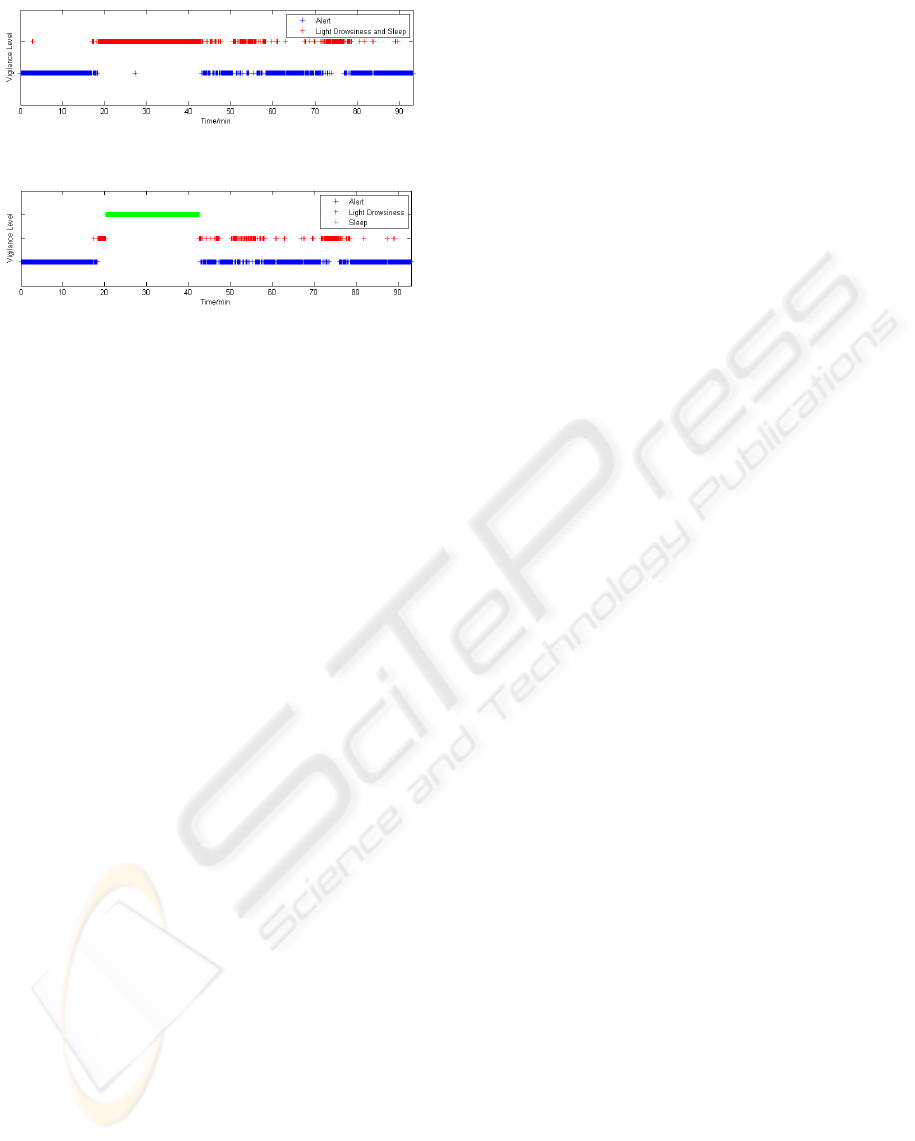
Figure 2: Classification of two vigilance states.
Figure 3: Classification of three vigilance states including
sleep state.
4 CONCLUSIONS
In this paper, an EEG signal processing method is
presented for distinguishing ’light drowsiness’ from
other vigilance level in driving simulation environ-
ment. Firstly, we extract 4 features for each frequency
band in every EEG channel. Then we use a mutual
information based feature selection to reduce the di-
mension of features. Finally, SVM is used to classify
light drowsiness state from alert on labeled EEG data.
Our experiment results give over 91% average accu-
racy with 5s time resolution for five subjects. This
study also shows that the light drowsiness state can
be classified very precisely from alert state. Accord-
ing to the result of this classification, accidents caused
by driver sleep can be prevented efficiently.
ACKNOWLEDGEMENTS
This work was supported by the National High Tech-
nology Research and Development Program of China
(No.2008AA02Z310). The authors also would like to
thank Prof. Bao-Liang Lu and other researchers in his
laboratory for their helpful work on EEG data acqui-
sition.
REFERENCES
Boser, B. E., Guyon, I. M., and Vapnik, V. N. (1992). A
training algorithm for optimal margin classifiers. In
Proceedings of the fifth annual workshop on Compu-
tational learning theory (pp.144-152). ACM.
Cortes, C. and Vapnik, V. (1995). Support-vector net-
works. In Machine Learning 1995 (vol.20,pp.273-
297). Springer.
Doughty, M. J. (2002). Further assessment of gender-
and blink pattern-related differences in the sponta-
neous eyeblink activity in primary gaze in young
adult humans. In Optometry and Vision Science
(vol.79,pp.439-447). Williams Wilkins.
Hori, T., Hayashi, M., and Morikawa, T. (1994). To-
pographical eeg changes and the hypnagogic experi-
ence. In Sleep onset: Normal and abnormal processes
(pp.237-253). American Psychological Association.
Lal, S. K. and Craig, A. (2001). A critical review of the
psychophysiology of driver fatigue. In Biological Psy-
chology (vol.55,pp.173-194). Elsevier.
Li, M., Fu, J.-W., and Lu, B.-L. (2008). Estimating vig-
ilance in driving simulation using probabilistic pca.
In Engineering in Medicine and Biology Society 2008
(pp.5000-5003). IEEE.
Lin, C.-T., Ko, L.-W., Chung, I.-F., Huang, T.-Y., Chen,
Y.-C., Jung, T.-P., and Liang, S.-F. (2006). Adaptive
eeg-based alertness estimation system by using ica-
based fuzzy neural networks. In IEEE Transactions
on circuits and systems (vol.53,pp.2469-2476). IEEE.
Makeig, S., Jung, T.-P., and Sejnowski, T. J. (1996). Us-
ing feedforward neural networks to monitor alertness
from changes in eeg correlation and coherence. In
Advances in Neural Information Processing Systems
(pp.931-937). MIT Press.
Niedermeyer, E. and Silva, F. L. D. (2004). Electroen-
cephalography: basic principles, clinical applica-
tions, and related fields (pp.194-209). Lippincott
Williams & Wilkins.
Noachtar, S., Binnie, S., Ebersole, C., Mauguiere, J.,
Sakamoto, F., Westmoreland, A., and Westmoreland,
B. (2004). A glossary of terms most commonly used
by clinical electroencephalographers and proposal for
the report form for the eeg findings. In Klinische Neu-
rophysiologie (vol.35,pp.5-21). George Thieme Ver-
lag.
Peng, H., Long, F., and Ding, C. (2005). Feature selec-
tion based on mutual information: Criteria of max-
dependency, max-relevance, and min-redundancy. In
IEEE Transactions on Pattern Analysis and machine
Intelligence (vol.27,pp.1226-1238). IEEE.
Schomer, D. L. (2007). The Clinical Neurophysiology
Primer (pp.57-71). Humana Press.
Shen, K.-Q., Ong, C.-J., Li, X.-P., Hui, Z., and Wilder-
Smith, E. P. V. (2007). A feature selection
method for multilevel mental fatigue eeg classifica-
tion. In IEEE Transactions on Biomedical Engineer-
ing (vol.54,pp.1231-1237). IEEE.
Shi, L.-C., Yu, H., and Lu, B.-L. (2007). Semi-supervised
clustering for vigilance analysis based on eeg. In Neu-
ral Networks 2007 (pp.1518-1523).
Weinger, M. B. (1999). Vigilance, boredom, and sleepi-
ness. In Journal of Clinical Monitoring and Comput-
ing (vol.15,pp.549-552). Kluwer.
Yeo, M. V., Li, X., Shen, K., and Wilder-Smith, E. P.
(2009). Can svm be used for automatic eeg detection
of drowsiness during car driving? In Safety Science
(vol.47,pp.115-124). Elsevier.
BIOINFORMATICS 2010 - International Conference on Bioinformatics
134
