
HYBRID PHYSIOLOGICAL MODELING OF SUBJECTS
UNDERGOING CYCLIC PHYSICAL LOADING
A. Nassef
*
, M. Mahfouf
*
, C-H. Ting
**
, E. Elsamahy
*
, D. A. Linkens
*
and M. Denaï
*
*
Dept. of Automatic Control, University of Sheffield, Mappin Street, Sheffield, U.K.
**
Dept of Biomechatronic Engineering, National Chiayi University, Taiwan
Keywords: Modeling, Signal Processing, Biomedical Systems, Fuzzy Systems, Genetic Algorithms.
Abstract: This paper investigates the influence of physical stress on the physiological parameters of the cardiovascular
system (CVS). The work aims at estimating the physiological variables such as the Heart Rate (HR), Blood
Pressure (BP), Total Peripheral Resistance (TPR) and respiration in a subject underging physical workload.
The core of the model was based on the model architecture previously developed by Luczak and his co-
workers. Luczak's model was first reconstructed and the original published figure plots were used to identify
some of the missing parameters via Genetic Algorithms (GA). The model was then modified using real
experimental data extracted from healthy subjects who underwent two-session experiments of cyclic-
loading based physical stress. Neuro-Fuzzy models were elicited via the data in order to describe the non-
linear components of the model. The model response has also been significantly improved by including a
dynamics-based component represented by 'time' as an extra input. The final model, as well as being of a
‘hybrid’ nature, was found to generalize better, to be more amenable to expansions and to also lead to better
predictions.
1 INTRODUCTION
Life is full of stresses and human beings are more
often than not likely to be exposed to one or more of
stress types during their regular daily activities.
Many studies revealed that the human physiological
variables are affected by physical stress. Among
these variables, which have a direct relationship with
the physical workload, one can cite the
Cardiovascular System (CVS) parameters and the
brain activity. The CVS parameters of interest
include the Heart-Rate (HR), blood-pressure (BP),
total peripheral resistance (TPR), and respiration.
CVS models are important for understanding
cardiovascular physiology and the interactions
among the different hemodynamics involved. CVS
models usually integrate a circulatory model with a
model of control mechanisms of the autonomous
system (Chiu and Kao, 2001). One of the earliest
models describing the relationships between the
CVS physiological variables, such as HR, BP, TPR
and respiration, was developed by Luczak and
Raschke (Luczak and Raschke, 1975). This model
describes the influence of physical and mental
stresses on these signals. The original model was
later extended by the same authors to take into
account the effect of workload on the amplitude and
frequency of the respiration (Luczak et al., 1980).
This model was adopted in the present work because
of its transparency (it leads to a relatively good
understanding of CVS physiology) and also because
it can be extended and modified easily.
The research work described here consists of
analyzing the original Luczak model and identifying
the key sub-model components which should be
updated in order to achieve better interpretability
and prediction accuracy overall without adding too
much complexity. This paper is organized as
follows: Section 2 overviews the original Luczak
model. Section 3 outlines the modeling strategy
adopted when substituting key sub-models in the
original Luczak model and presents the simulation
results. Finally, Section 4 draws some conclusions in
relation to this overall study, including some future
research issues.
252
Nassef A., Mahfouf M., Ting C., Elsamahy E., Linkens D. and Denaï M. (2010).
HYBRID PHYSIOLOGICAL MODELING OF SUBJECTS UNDERGOING CYCLIC PHYSICAL LOADING.
In Proceedings of the Third International Conference on Bio-inspired Systems and Signal Processing, pages 252-257
DOI: 10.5220/0002724702520257
Copyright
c
SciTePress
2 RECONSTRUCTION OF THE
ORIGINAL LUCZAK MODEL
In earlier Luczak's publications, it was found that
some of the equations parameter values were
missing and no quantitative values were available
(Luczak et al., 1980; Luczak and Raschke, 1975).
Therefore, an optimisation procedure was used to
identify these parameters.
2.1 Signal Discretization
A data discretization process has been applied to the
original plots of Luczak's model output. There were
two plots combining the model responses (HR, BP,
TPR, and respiration) due to 50-W and 200-W
physical workload. These plots were scanned using a
high resolution scanner, to transform them to their
digital format. Each curve image was then saved into
a separate digital-image file. A discretization process
was applied by recording, manually the curve plot
point-by-point. This process was accomplished by
using a program called “Discretizer” that works
under the environment of “Origin6.0
©
” (OriginLab
Corporation, USA). The time-series equivalents
were finally obtained with a reasonable accuracy.
Fig. 1 shows the resulting discretized signals related
to the original 50-W workload data for a 300 sec
time duration.
Figure 1: Plots of the physiological signals after
discretization; (a) Heart rate, (b) Blood pressure, (c) Total
Peripheral Resistance.
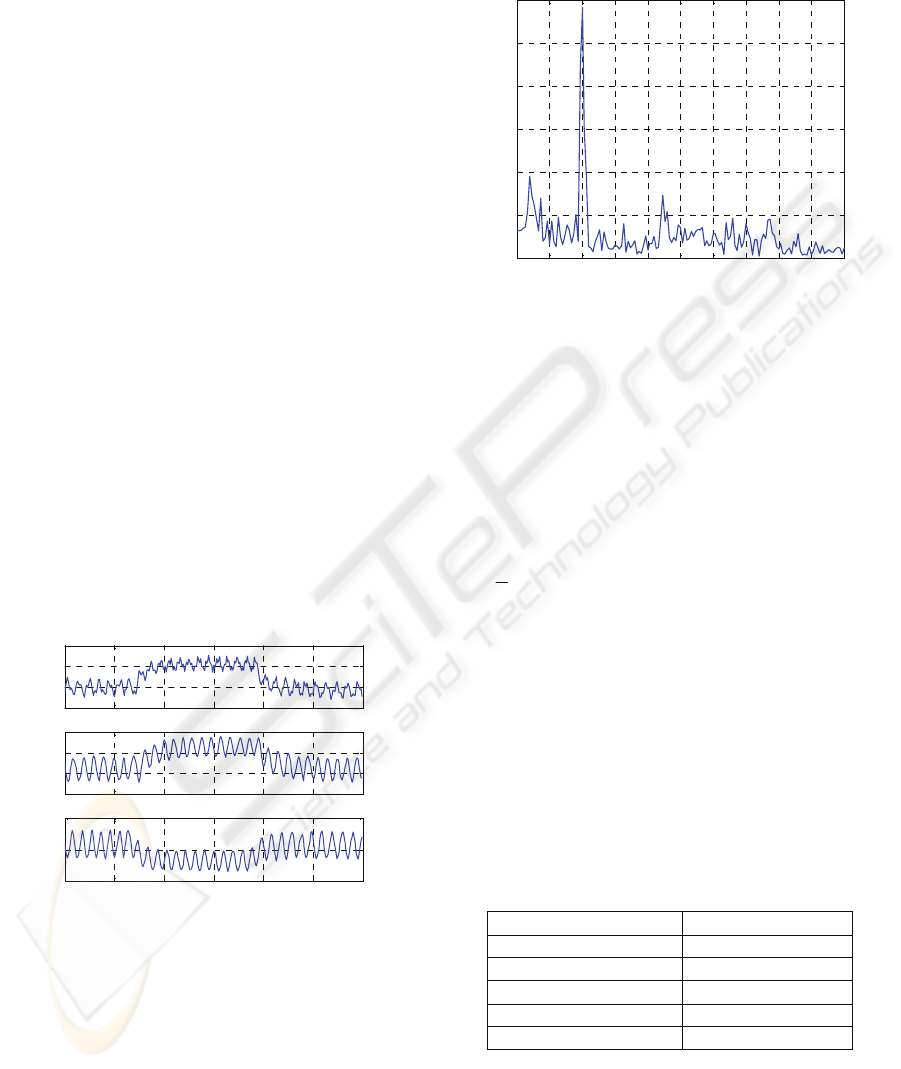
The reliability of this discretization process was
verified by recalculating the frequency components
of the reconstructed signals using a Fast Fourier
Transform (FFT) algorithm. The power spectra of
the reconstructed HR, BP and TPR due to a
workload of 50-W in Fig. 2 shows clearly the 0.1 Hz
frequency component (Mayer wave) (Penaz, 1978)
thus confirming the subject’s entrainment.
Figure 2: The power spectrum of the reconstructed HR
signal.
2.2 Parameter Optimisation
The Genetic Algorithm (GA) (Goldberg, 1989) was
considered as a suitable candidate to estimate the
unknown parameters.
The sum of the Mean Squared Errors (MSE) of
the three physiological variables was used as the
cost-function, J:
J =
TPRerror)BPerror)HRerror)
22
1
2
(((
1
kk
n
k
k
n
++
∑
=
(1)
Where HRerror = Heart Rate error = HR – HR
*
,
BPerror = Blood Pressure error = BP – BP
*
,
TPRerror = Total Peripheral Resistance error = TPR
–TPR
*
; HR, BP, and TPR are the assumed measured
real data extracted from the plots; and HR
*
, BP
*
, and
TPR
*
are the corresponding estimated signals
respectively and n = Number of samples, k = the
instantaneous time-index of the data point.
Table 1 shows the GA parameters that were
chosen as recommended by (Grefenstette, 1986).
Table 1: GA optimisation parameters.
Number of generations 500
Number of populations 200
Mutation factor 0.02
Crossover factor 0.95
Fitness scaling Rank
Selection method Stochastic uniform
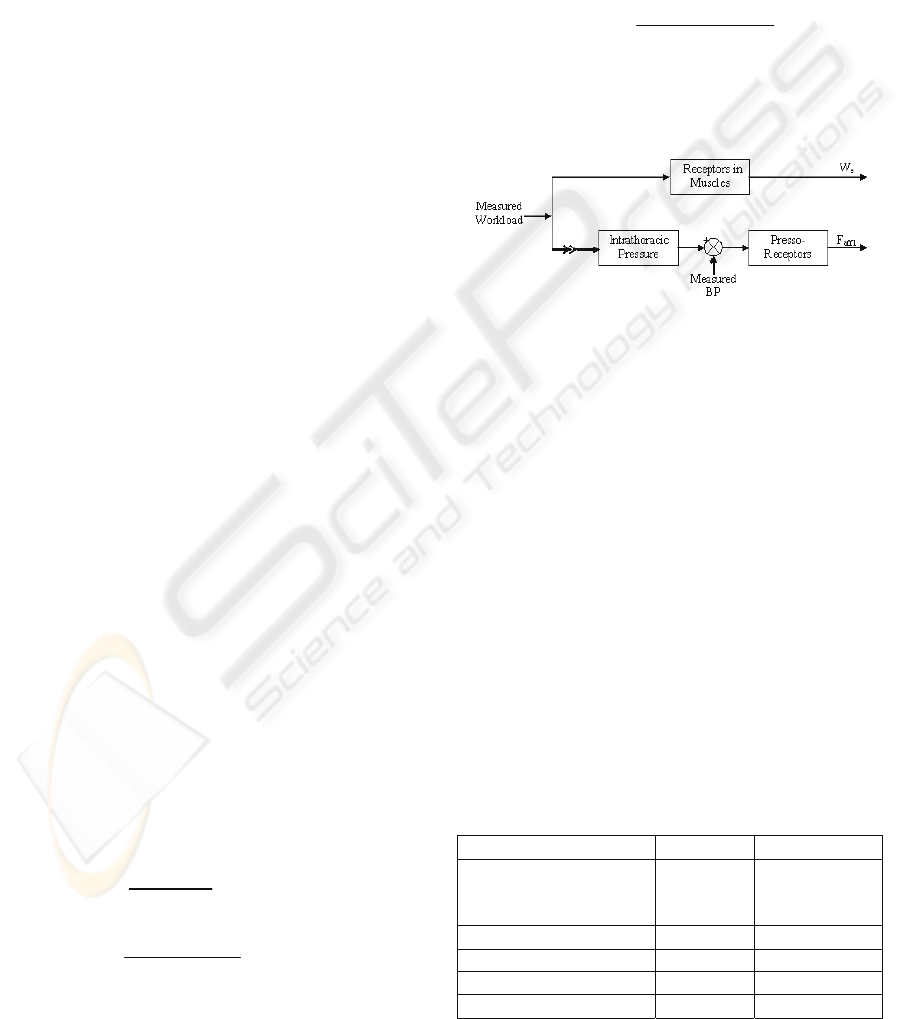
The model output for the HR, BP and respiration
signals, given an input excitation equivalent to a 50-
W physical workload is shown in Fig. 3.
0 50 100 150 200 250 300
60
80
100
120
HR (beats/min)
0 50 100 150 200 250 300
80
90
100
110
BP (mmHg)
0 50 100 150 200 250 300
10
15
20
TPR (mmHg/L.min)
Ti m e ( s )
(a)
(b)
(c)
0 0.05 0.1 0.15 0.2 0.25 0.3 0.35 0.4 0.45 0.5
0
100
200
300
400
500
600
Frequency (Hz)
Power spectrum of HR (Arbitrary units)
HYBRID PHYSIOLOGICAL MODELING OF SUBJECTS UNDERGOING CYCLIC PHYSICAL LOADING
253
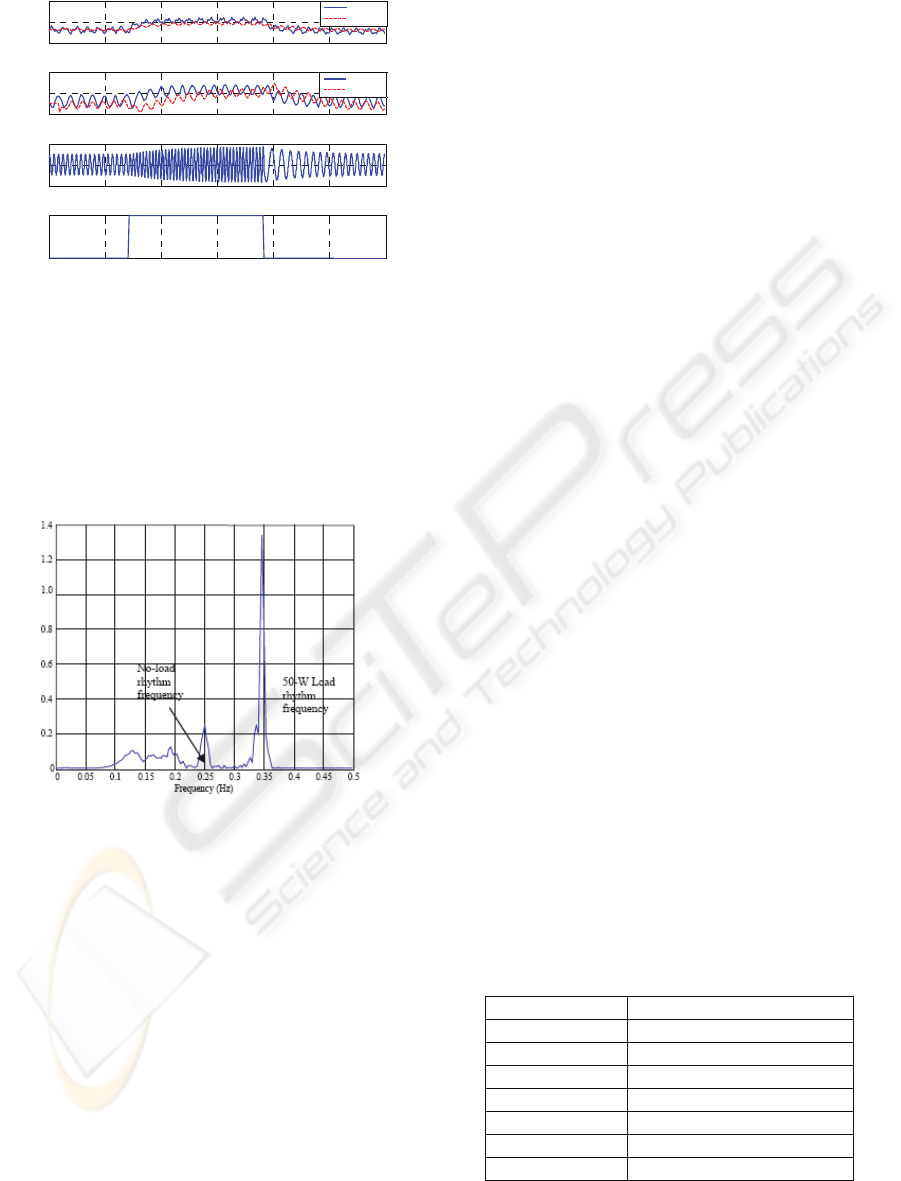
Figure 3: The actual versus estimated HR, BP, and
respiration signals for 50-W physical workload.
Fig. 4 shows the respiration power spectrum and
it can be seen that there are two frequency peaks; the
first is at 0.25Hz which represents the rest frequency
while the other is around 0.35 Hz which represents
the load frequency. Thus, the accuracy of the
estimated respiration signal was deemed reasonable.
Figure 4: The respiration power spectrum due to a 50-W
workload.
Most of the studies relating physical stress to the
CVS were concerned with models capable of
simulating behaviour within a five (5) minute-period
(Chiu and Kao, 2001, Elsamahy et al., 2003).
However, to the best of knowledge of the authors of
this paper, studies involving long-term physical
workload and its effect on the CVS have not yet
been explored. Therefore, the objective of this work
is to build a model that includes the following
features:
1- The model must be able to estimate the
physiological variables such as HR, BP, TPR, and
respiration for simulating physical workload for time
periods longer than five (5) minutes;
2- The model must be reliable and able to
generalise predictions by including intelligent blocks
to replace the 'physical' non-linear blocks;
3- The workload profile has to be designed so as
to assess the effect of a stepwise cyclic-loading on
the CVS.
The reconstructed model was modified to suit
such a long-term study and this is discussed in detail
in the next section.
3 MODELING WITH REAL TIME
DATA
To proceed with the current study, real-time
experiments were conducted on 15 young and
healthy volunteer subjects. All the experiments took
place in the Human Performance Laboratory (HPL).
3.1 Experimental Setup and Data
Acquisition
The experimental set-up included the following
equipment:
• Cateye Ergociser EC-3700 high performance fitness
bicycle for simulating physical stress and equipped
with an ear lobe sensor to acquire the average HR
signal at sampling frequency of 1 Hz.
• Ohmeda 2300 Finapres
®
blood pressure monitor for
continuous measurements of blood pressure and
beat-to-beat heart-rate;
• Two PCs for data capture and analyses.
Each volunteer underwent two experiments,
each lasing 31 min. The first and last 5-min periods
were 'rest' states while the in between 21-min period
was assigned for the workload state. The workload
profile was a cyclic-loading scheme (stepwise) as in
Table 2 and the subject was asked to pedal with a
constant speed of 60 rpm with each step lasting 3
min.
Table 2: Workload values in kg-m.
Step Number Workload Torque (kg-m)
1 0.6
2 1.1
3 1.6
4 2.1
5 1.6
6 1.1
7 0.6
0 50 100 150 200 250 300
50
100
150
(a)
HR
(beats/min)
Actual vs. estimated HR signal
Actual
Es ti ma te d
0 50 100 150 200 250 300
80
100
120
(b)
BP
(mmHg)
Actual vs. estimated BP signal
Actual
Es t i m at e d
0 50 100 150 200 250 300
0
50
Workload
(d)
Workload
(W)
Ti m e ( s e c)
0 50 100 150 200 250 300
-0. 5
0
0.5
Estimated respiration signal
(c)
Ventilation
(L)
BIOSIGNALS 2010 - International Conference on Bio-inspired Systems and Signal Processing
254
The second experimental session was organised
to be at the same time of the day to avoid any
significant changes in the subjects' cardiac
circulation. The first session data were used for
model training while the second session data were
for model checking.
3.2 Data Pre-processing
Data pre-processing was carried-out by removing
the spurious values, caused by the sensor
movements while pedalling. These unreliable data
values were removed and then replaced by the
average value of the data before and after the
artefact. Additionally, another filtering operation
was carried-out by using curve smoothing to remove
the high frequency components (Moon, 1998). The
most appropriate physiological signals needed for
this study were HR, the mean arterial BP and the
power consumption signals.
3.3 Data Modeling
A comparative study between TSK(Takagi-Sugeno)-
type fuzzy model (ANFIS) (Jang, 1993), Mamdani-
type fuzzy model, and neural-networks (NN) ability
to reproduce the non-linear blocks in the Luczak's
original model has been carried out. The non-linear
blocks are normally found in the two controlling
paths, i.e. in the TPR and the HR paths. More
specifically in the sinus node and the vascular nerves
blocks. For simplicity, the whole model was divided
into two sub-models: the BP and HR sub-models.
The blood pressure sub-model is responsible for
predicting the BP signal and the heart-rate sub-
model predicts the HR signal.
3.3.1 Training and Checking Data
Reproduction
The instantaneous HR is normally stimulated by the
sinus node, which can be seen as the arithmetic unit
combining the effect of several sympathetic and
vagal pathways. The equations which regulate the
HR signal using the vasomotor centre and the sinus
node are as follows (Luczak et al., 1980, Luczak and
Raschke, 1975):
HR=HR
0
·(1-
veff
veff
bFa
F
+
)·(1+F
seffo
+K
PF
Ws)·
(
2
nn
2
2
n
ωsηω2s
ω
++
) (2)
F
veff
= KK · F
aff1
(3)
Where HR
o
= heart rate at rest (without vagus
activity) = 120 beats/min; F
veff
= Efferent vagus
activity;
a
= 1.74; b = 0.96; K
PF
= 0.0074; F
seffo
=
efferent sympathetic activity at rest = 0.64;
W
s
= reference variable of sympathico-tonic activity
under workload; ω
n
= 1 rad/s, η = 0.65; F
aff1
=
afferent impulses from presso-receptors. On the
other hand, the BP equation is given as follows
(Luczak et al., 1980):
BP = TPR · Q ·
2
nn
2
2
n
ωsηω2s
ω
++
(4)
Where Q = Cardiac output (flow-rate) (L/min);
ω
n
= 0.4 rad/s; η = 1.
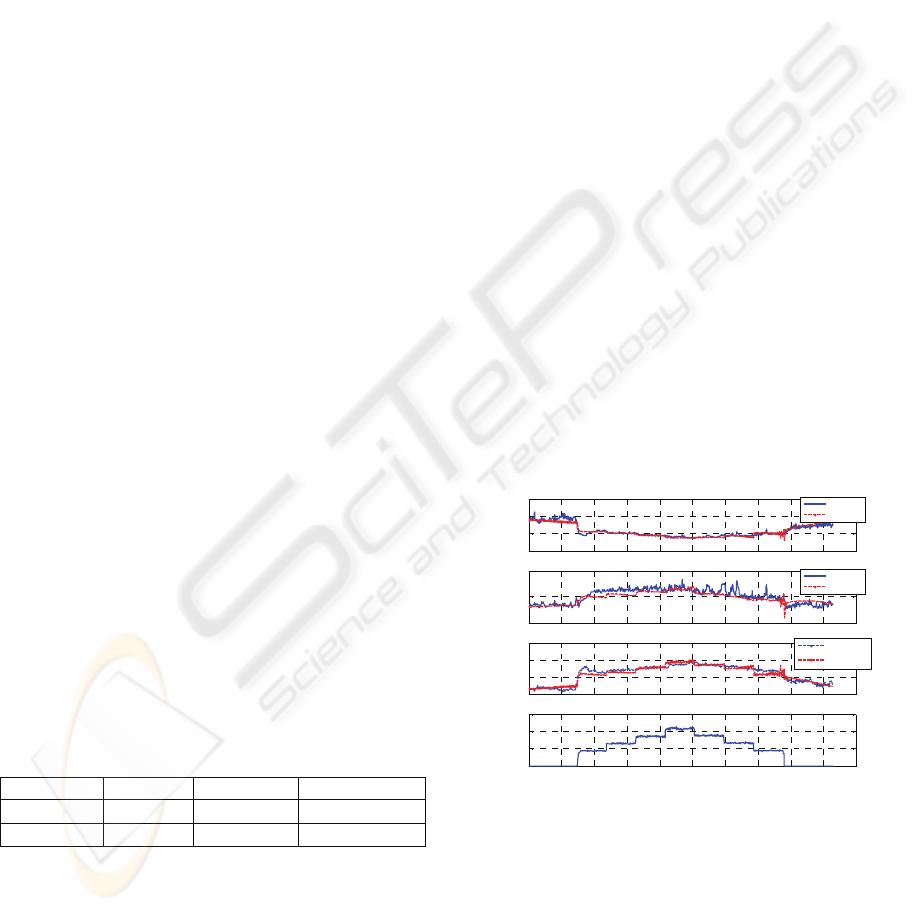
Figure 5: The model scheme for generating the training
data of the input variables for the HR model; the cut-arrow
in the Faff1 path denotes some hidden blocks which were
omitted for clarity.
The study focused initially on the HR signal path
and the target was to select the best model type that
is able to predict the HR signal as an output from the
sympathetic activity (W
s
) and the efferent signal
(F
aff1
) as inputs (Fig. 5). To help capture the systems
dynamics, a time index was added as an extra input
to help improve the models' predictions.
3.3.2 ANFIS-type Fuzzy Model
The Adaptive Neuro Fuzzy Inference System
(ANFIS) (Jang, 1993) was used and the rule-base
construction was based on Grid Partitioning (GP)
and Subtractive Clustering (SC) techniques. Table 3
summarizes the parameters assigned to each method.
Table 3: Training parameters for the Grid Partitioning
(GP) and Subtractive Clustering (SC) methods.
GP SC
Number of input
membership functions
(MFs)
[5 5] Radius = 0.3 to
give [5 5]
MFs shape Gaussian Gaussian
Output function Linear Linear
Optimisation method Hybrid Hybrid
Training epochs 500 500
HYBRID PHYSIOLOGICAL MODELING OF SUBJECTS UNDERGOING CYCLIC PHYSICAL LOADING
255
The SC technique was adopted because it
showed a smaller validation MSE than the GP
technique in addition to the bounded 3D surface of
the former over the later.
3.3.3 Mamdani-type Fuzzy Model
The general rule structure of the Mamdani-type
model is:
R
i
: IF x
1
is A
i1
AND x
2
is
A
i2
AND … AND x
m
is A
im
,
THEN y
i
is B
i
(5)
Where
[]
m
T
m
xx ℜ⊂∈= Ux ,,
1
"
is the input
vector, y the output, A
i1
, A
i2
, ...., A
im
, B
i
are linguistic
labels.
For the sake of consistency in comparisons, the
inputs were assigned 5 Gaussian MFs each, with 5
rules, were applied. The same rules were chosen as
in the case of the SC technique.
3.3.4 Neural Networks Based Model
The study started by training a feed-forward neural
network (FFNN) with the training data from
Group1. The NN includes 2 hidden layers each
having 5 neurons. The tangent sigmoid was chosen
as a transfer function for all hidden layers' neurons,
and the output transfer function was chosen to be
linear. The NN was trained with the back-
propagation optimisation method with the same
inputs combination and the same training and
validating data as for the previous two models. The
number of training epochs was set to 500; however
the training process stopped after 38 epochs as the
minimum MSE was reached.
Table 4 summarises the
HR MSEs and the correlation values of the checking
data for final comparison. The table shows that
ANFIS model was the best choice, because it had
the minimum MSE and the maximum correlation
values in this case study.
Table 4: The MSEs and correlations of the checking data
for the proposed models.
ANFIS Mamdani NN
MSE 119.05 608.26 130.44
Correlation 0.9587 0.6677 0.9586
Due to the predominating dynamics in the BP
signal, it was necessary to predict the BP signal as
accurately as possible to ensure in turn the accurate
prediction of the HR signal. In fact, the non-linear
block located in the TPR path was deemed to be
replaced by ANFIS. Therefore, the model was
implemented by constructing an ANFIS model
which was used to predict the TPR first, then
predicting the BP signal using the mean arterial
pressure equation (4). There was no available sensor
for measuring the TPR signal; therefore, it was
inferred via equation (6) which is a simplified
version of equation (4):
BP = TPR × Q (6)
It was necessary to divide the ANFIS model into
two sub-ANFIS models. The first sub-ANFIS was
for predicting the 'rest' state and the other for the
'load' state. From the input/output correlation test,
the inputs of the TPR sub-ANFIS models were
defined for the training procedure as the workload
(WL) and the blood flow rate (Q) in addition to the
afferent signal (F
aff2
). The former is a mandatory
input because it represents the feedback signal for
controlling the BP through the slow control path.
The HR sub-ANFIS models were elicited using
the same procedure as the TPR sub-ANFIS and the
candidate inputs were the WL and F
aff1
in addition to
the time-index. F
aff1
is mandatory for feedback
control. The estimated outputs of the final model
versus the measured signals of a subject's data from
'Session 2' are shown in Fig. 6. This figure shows
that the model predictions are good during this long-
term case of 1800sec. Furthermore, Fig. 7 shows that
the 0.1 Hz component clearly appears in all spectra
which reinforces the previous argument that the
elicited model is valid.
Figure 6: The predicted versus the measured physiological
variables of the final model
.
0 200 400 600 800 1000 1200 1400 1600 1800 2000
0
10
20
30
TPR
(mmHg/Min)
Me as ure d
Estimated
0 200 400 600 800 1000 1200 1400 1600 1800 2000
50
100
150
HR
(beats/min)
Me as ure d
Estimated
0 200 400 600 800 1000 1200 1400 1600 1800 2000
50
100
150
200
BP
(mmHg)
Me as ure d
Estimated
0 200 400 600 800 1000 1200 1400 1600 1800 2000
0
50
100
150
Workload
(W)
Ti me ( s )
BIOSIGNALS 2010 - International Conference on Bio-inspired Systems and Signal Processing
256
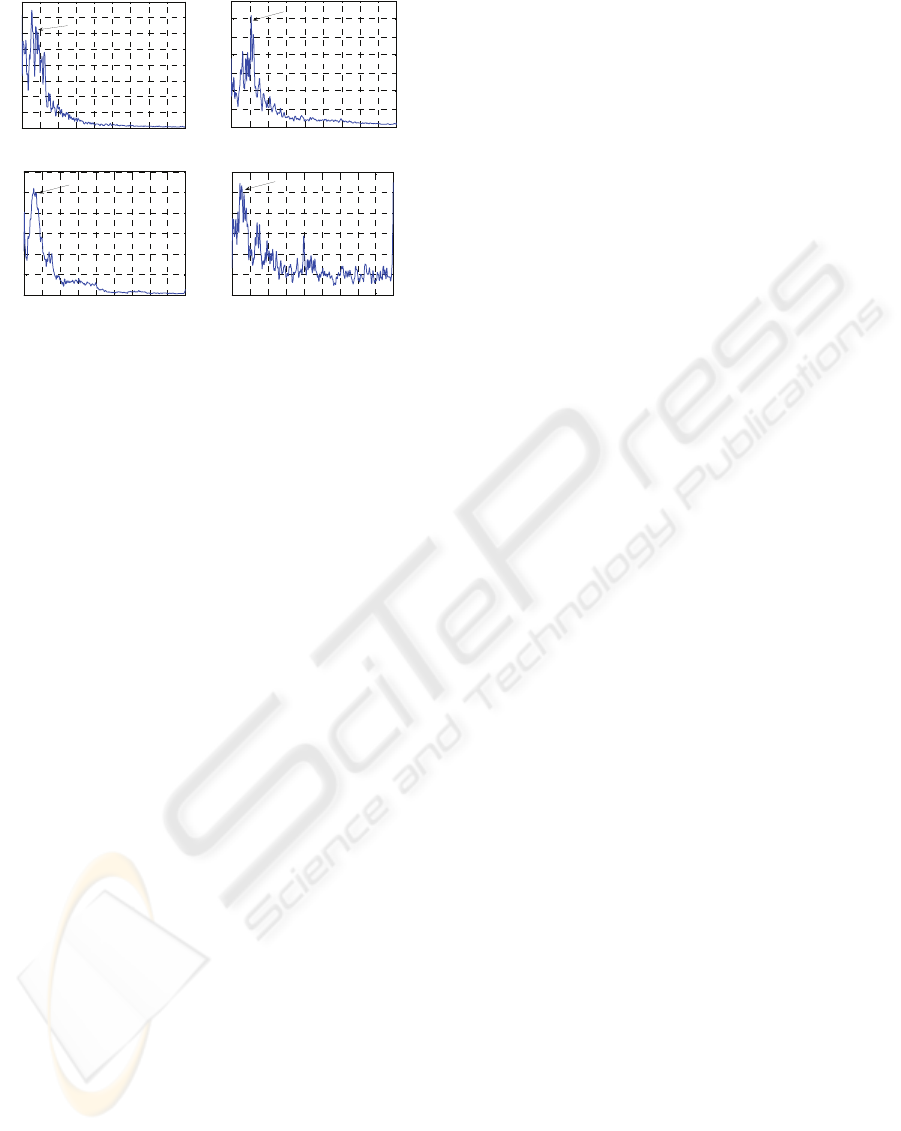
Figure 7: Power spectra of the measured and estimated HR
and BP signals.
4 CONCLUSIONS
The work described in this paper is concerned with
modeling the cardiovascular system (CVS) in terms
of its physiological variables such as the heart-rate
(HR), blood-pressure (BP), total peripheral
resistance (TPR) and respiration based on Luczak's
models. The reconstructed model outputs and their
power spectra showed that this model can be used as
a kernel model for studying the influence of physical
stress on the CVS physiological variables. The
model was tuned using real-time data collected from
a population of 15 healthy subjects. A comparative
study between the Neural Network (NN), the
Mamdani-type fuzzy model, and the TSK-type
model (ANFIS) was carried-out. The TSK- type
model produced good predictions in terms of the
MSE and input/output correlation values. The inputs
pattern used for building the ANFIS model was
chosen on the basis of their correlation values vis-à-
vis the desired output. A time-index was added as an
extra input to the input pattern to incorporate the
system dynamics and this improved the model
predictions. Two different ANFIS models were
developed to predict the physiological variables
during the rest and load periods separately. A time-
switch was then used to toggle between each period.
The power spectra showed that the model captures
the relevant frequencies of the system. It is
envisaged to exploit this model as a mechanism for
switching between human and machine for task
allocation in high-risk environments via the use of
predefined HR and/or BP thresholds, similarly to the
study used in the case of mental stress (Ting et al.,
2008).
ACKNOWLEDGMENTS
The authors gratefully acknowledge financial
support from the UK-EPSRC under Grant
GR/S66985/01.
REFERENCES
Chiu, H.-W. and Kao, T. (2001) A Mathematical Model
for Autonomic Control of Heart Rate Variation. IEEE
Engineering In Medicine And Biology, 20(2), pp.69-
76.
Elsamahy, E., Mahfouf, M. and Linkens, D. (2003) A
Hybrid Intelligent Closed-Loop Model for Exploration
of Cardiovascular Interactions. 4
th
Annual IEEE
Conference on Information Technology Applications
in Biomedicine, UK. pp.165-168.
Goldberg, D. E. (1989) Genetic Algorithms in Search,
Optimization and Machine Learning, Addison-
Wesley.
Grefenstette, J. J. (1986) Optimization of Control
Parameters for Genetic Algorithms. IEEE
Transactions on Systems, Man, and Cybernetics,
16(1), pp.122-128.
Jang, J. (1993) Anfis: Adaptive-Network-Based Fuzzy
Inference System. IEEE Trans. on Systems, Man and
Cybernetics, 23(3), pp.665-685.
Luczak, H., Philipp, U. and Rohmert, W. (1980)
Decomposition of Heart-Rate Variability under the
Ergonomic Aspect of Stressor Analysis. IN KITNEY,
R. I. & ROMPELMAN, O. (Eds.) The Study of Heart
Rate Variability. Oxford University Press, New York.
Luczak, H. and Raschke, F. (1975) A Model of the
Structure and Behaviour of Human Heart Rate
Control. Biological Cybernetics, 18, pp.1-13.
Moon, B. S. (1998) A Curve Smoothing Method by Using
Fuzzy Sets. Fuzzy Sets and Systems, 96(3), pp.353-
358.
Penaz, J. (1978) Mayer Waves: History and Methodology.
Automatica, 2(1), pp.135-141.
Ting, C. H., Mahfouf, M., Linkens, D. A., Nassef, A.,
Nickel, P., Roberts, A. C., Roberts, M. H. and Hockey,
G. R. J. (2008) Real-Time Adaptive Automation for
Performance Enhancement of Operators in a Human-
Machine System. 16
th
Mediterranean Conference on
Control and Automation, Ajaccio, Corsica, France.
June 25-27, 2008, pp.552-557.
0.05 0.1 0.15 0.2 0.25 0.3 0.35 0.4 0.45 0.5
0
50
100
150
200
250
300
350
400
Measured HR Power Spectrum
Frequency (Hz)
Power spectrum (Arbitrary units)
0.1 Hz
Component
0.05 0.1 0.15 0.2 0.25 0.3 0.35 0.4 0.45 0.5
0
50
100
150
200
250
300
350
Measured BP Power Spectrum
Frequency (Hz)
Power spectrum (Arbitrary units)
0.1 Hz
Component
0.05 0.1 0.15 0.2 0.25 0.3 0.35 0.4 0.45 0.5
0
50
100
150
200
250
300
Estimated HR Power Spectrum
Frequency (Hz)
Power spectrum (Arbitrary units)
0.1 Hz
Compo nent
0.05 0.1 0.15 0.2 0.25 0.3 0.35 0.4 0.45 0.5
0
50
100
150
200
250
300
Estimated BP Power Spectrum
Frequency (Hz)
Power spectrum (Arbitrary units)
0.1 Hz
Component
HYBRID PHYSIOLOGICAL MODELING OF SUBJECTS UNDERGOING CYCLIC PHYSICAL LOADING
257
