
HOLY-II: IMPROVED HIERARCHICALLY ORGANIZED
LAYOUT FOR VISUALIZATION OF BIOCHEMICAL COMPLEX
PATHWAYS
Jyh-Jong Tsay, Bo-Liang Wu and Guo-Gen Huang
Dept. of Computer Science & Information Engineering, National Chung-Cheng University, Taiwan, R.O.C.
Keywords: Pathway layout, Forced-directed layout, Hierarchical layout, Pathway visualization.
Abstract: Many complex pathways are described as hierarchical structures in which a pathway is recursively
partitioned into several sub-pathways, and organized hierarchically as a tree. The hierarchical structure
provides a natural way to visualize the global structure of a complex pathway. Recently, a hierarchically
organized layout algorithm HOLY which takes the advantages of the hierarchical structures inherent in
complex pathways has been proposed. In this paper, we present a new layout algorithm HOLY-II which
follows the basic principle of HOLY, but improves HOLY by introducing a new algorithm for joining
layouts, one of the crucial tasks in HOLY. Experiment shows that HOLY-II is able to produce layouts
which clearly render both the global structures and the local structures of complex pathways, and gives
better visualization for many examples from MetaCyc, CADLIVE and HOLY.
1 INTRODUCTION
Automatic drawing and visualization of pathways
plays an important role in understanding biological
systems. Recently, several pathway editors (Trost et
al., 2003; Brandenburg et al., 2004; Salamonsen et
al., 2004) have been developed. Such editors provide
graphical interfaces, and graphical components that
match pathway components. However, pathway data
is increasing very rapidly, and updated frequently.
That makes drawing and maintaining of pathway
data tedious and time-consuming, even we use
graphical editors. A solution to the problem is to
develop software tools that can automatically layout
and visualize pathways.
One of the main problems in automatic
pathway drawing is the layout problem. We can
transform therelation between pathway components
into a directed graph, and the drawing problem then
becomes a graph layout problem. There are two
well-known graph layout approaches: hierarchical
layout (Sugiyama et al., 1981; Eades and Sugiyama,
1990; Carmel et al., 2004) and forced directed layout
(Fruchterman and Reingold, 1991; Gansner and
North, 1998). However, both approaches can only
handle simple pathway structures such as hierarchies
and cycles. Recently, a number of approaches (Karp
and Paley, 1994; Becker and Rojas, 2001; Li and
Kurata, 2005; MetaCyc Encyclopedia of Metabolic
Pathways, 2008) have been proposed to layout
pathways. Karp and Paley (Karp and Paley, 1994)
gave a pioneering work in which they pointed out
that rather than searching for one single, all-purpose
graph layout algorithm, different algorithms should
be applied to parts of the pathway with different
topologies. They devised an algorithm for drawing
metabolic pathways which breaks the graph into
cyclic, linear and tree-structured components and
then applies different layout methods to each of
these individually. Their algorithm has been
implemented in MetaCyc (MetaCyc Encyclopedia of
Metabolic Pathways, 2008) that will be used in this
paper as a baseline to evaluate our approach. Becker
and Rojas (Becker and Rojas, 2001) presented an
algorithm that combines circular, hierarchical and
force-directed layouts. Their approach is particularly
designed for pathways that have a main cycle. Li
and Kurata (Li and Kurata, 2005) proposed a LK-
grid layout algorithm that applies force-directed
layout over grid points. They employed a cost
function defined over connection structures in the
graph. LK-grid layout is the first algorithm to
produce clustered layouts in which nodes involved
in the same functional module are clustered together.
LK-grid layout has been integrated into CADLIVE
(CADLIVE, 2008) for automatic generation of
pathway visualization. However, as observed from
the examples in (CADLIVE, 2008), LK-grid layout
135
Tsay J., Wu B. and Huang G. (2010).
HOLY-II: IMPROVED HIERARCHICALLY ORGANIZED LAYOUT FOR VISUALIZATION OF BIOCHEMICAL COMPLEX PATHWAYS.
In Proceedings of the First International Conference on Bioinformatics, pages 135-140
DOI: 10.5220/0002725501350140
Copyright
c
SciTePress

can induce large number of edge crossings, and local
structures, such as hierarchies and cycles, are not
clearly visualized. Kato, Magasaki, Doi and Miyano
(Kato et al., 2005) presented an improved grid
layout algorithm that reduces the number of
crossings, and incorporates subcomponent
information. In this paper, we aim to develop new
layout algorithms that produce clustered layouts,
reduce edge crossings, and render global structures
as well as local structures nicely.
Observe that many complex pathways are
described as hierarchical structures in which a
pathway is recursively partitioned into several sub-
pathways, and organized hierarchically as a tree. The
hierarchical structure provides a natural way to
visualize the global structure of a complex pathway.
Recently, Tsay et al. (Tsay et al., 2009) presented
the first hierarchically organized layout, HOLY, that
takes the advantages of the hierarchical structures
inherent in complex pathways, and produces
clustered layouts that render both global structures
and local structures nicely. In this paper, we present
a new hierarchically organized layout algorithm,
HOLY-II, which improves HOLY-I for complex
pathways. Our main contribution is the development
of new algorithms for joining layouts. Experiment
shows that our approach can clearly render the
global structure of complex pathways as well as the
local structure in each sub-pathway, and gives better
visualization for many examples from MetaCyc and
CADLIVE. Furthermore, with the joining capability
of our approach, one is able to visualize any
collection of pathways, selected from pathway
databases, to study their interactions.
The remainder of this paper is organized as
follows. Section 2 reviews pathway visualization
and conventional layout algorithms. Section 3
presents our hierarchically organized layout
algorithm. Section 4 gives experimental results, and
section 5 concludes.
2 PATHWAY VISUALIZATION
We follow the Petri Net representation of pathways
(Pinney et al., 2003) that consists of two types of
nodes: place nodes and transition nodes. Place nodes
represented as circles denote compounds, and
transition nodes represented as boxes denote
reactions. Reaction nodes are labelled by Enzyme
Commission numbers (EC numbers). A Petri Net
becomes a directed graph if we treat both place
nodes and transition nodes as the same. The problem
of pathway layout thus becomes a graph layout
problem.
Layout is a transformation from topology to
geometry; that is, it generates coordinates for
components. Forced-directed layout (Kamada and
Kawai, 1989; Gansner and North, 1998;
Fruchterman and Reingold, 1991) is one of the
widely used methods to produce a two-dimensional
layout. The basic idea is to model a graph as a
physical system where the nodes are repulsive
particles and the edges are attractive interactions. All
the repulsive and attractive interactions are
represented by an energy function. The algorithm
iterates to update node coordinates by calculating all
repulsive and attractive forces, and the graph will
iteratively become a regular shape. A layout is
determined when the forces drive the system to a
steady state (a local minimum of energy). Force-
directed layout can be applied to both directed
graphs and undirected graphs, and results in layouts
with the following aesthetic properties (Fruchterman
and Reingold, 1991): distribute the vertices evenly
in the frame, minimize edge crossings, make edge
lengths uniform, reflect inherent symmetry and
conform to the frame. In this paper, we will use
force-directed layout for pathways that are mainly
cycles.
Hierarchical layout (Sugiyama et al., 1981;
Eades and Sugiyama, 1990; Carmel et al., 2004;
Friedrich and Schreiber, 2004) is another widely
used method that features producing a layered
downward diagram and highlighting the main
direction or flow within a directed graph. Cyclic
dependencies of nodes will be automatically
detected and resolved. Nodes will be placed in
hierarchically arranged layers. Additionally, the
ordering of the nodes within each layer is chosen in
such a way that the number of edge crossings is
small. In this paper, we will use hierarchical layout
for pathways that are hierarchies.
Some research (Masui, 1994; Barreto and
Barbosa, 2000) has proposed to integrate
evolutionary search, such as genetic algorithms.
Though this kind of approaches could intuitively
achieve a nice solution, running time is still an issue
when drawing large graphs. We will not consider
them in this paper.
3 HIERARCHICALLY
ORGANIZED LAYOUT
In this section, we present our layout algorithm
HOLY-II for hierarchically organized pathways that
BIOINFORMATICS 2010 - International Conference on Bioinformatics
136

Figure 1: The hierarchical organization of super-pathway
of Glycolysis/TCA/Glyox-Bypass.
are recursively partitioned into sub-pathways, and
represented as trees. HOLY-II was implemented in
Java with Eclipse platform (Eclipse.org, 2007). It is
able to run under both Windows XP and Linux.
As in HOLY, HOLY-II assumes that a complex
pathway is hierarchically organized as a tree. For
example, the tree in Figure 1 represents a
hierarchically organized pathway that consists of
three sub-pathways, GLYCOLYSIS and
TCA/GLYOX-BYPASS and PYRUVDEH-RXN.
The sub-pathway TCA/GLYOX-BYPASS is
composed of two sub-pathways, TCA and GLYOX-
BYPASS. HOLY-II performs the following three
major stages to produce layouts for hierarchically
organized pathways.
The Decomposition Stage that decomposes a
hierarchically organized pathway into
hierarchical groups of components.
The Layout Stage that produces layouts for
basic components.
The Joining Stage that joins component layouts
to form a final pathway layout.
3.1 Pathway Decomposition
The objective of the decomposition stage is to
partition a pathway into component groups such that
both global structures and local structures are
preserved, and can be explored in the final layout.
The stage consists of a grouping phase and a
partitioning phase. In the grouping phase, sub-
pathways are grouped into sub-pathway groups
recursively along the hierarchical tree, starting from
the root node, until all nodes are assigned to groups.
Two types of grouping are performed: cycle
grouping and overlap grouping. Cycle grouping is to
group sub-pathways whose separation breaks global
cycles, and overlap grouping is to group sub-
pathways who are highly overlapped. Note that
cycles are important features that usually form
“backbones” of metabolic processes. We thus group
sub-pathways whose separation breaks cycles to the
same group. High degree of overlapping between
sub-pathways implies that they are highly related.
We also group highly overlapped sub-pathways to
the same group. We set 30 percent of nodes as the
threshold for overlap grouping. Consider the
pathway in Figure 1. As sub-pathway TCA and
Glyox-Bypass highly overlap each other, they will
be assigned to the same group. The grouping
procedure will produce 3 groups: two singleton
groups, one for Glycolysis and the other for
Pyruvdeh-rxn, and the group composed of TCA and
Glyox-Bypass. Note that global structures can be
naturally preserved as sub-pathway grouping is
performed along hierarchical trees.
Each sub-pathway group identified in
grouping phase defines a group pathway that is the
union of all sub-pathways in that group. In the
partitioning phase, we examine each group pathway.
If the group pathway contains cycles, we then
partition the pathway into components so that cycles
are extracted and preserved. In particular, we will
first partition the group pathway into strongly
connected components, and then connect trivial
components to form maximal acyclic components.
The stage produces a tree of component groups.
Each component is either strongly connected or
acyclic.
3.2 Component Layout
In the layout stage, HOLY performs layout on each
component. We use force-directed layout for
strongly connected components to emphasize
symmetry and uniform edge lengths, and
hierarchical layout for acyclic components to stress
the direction and flow within a directed graph. With
careful selection of algorithms, our implementation
is able to produce layout in real time.
For efficiency, we use the force-directed layout
developed by Koren and Harel (Koren and Harel,
2003). Unlike traditional node-by-node optimization
(Kamada and Kawai, 1989), Koren and Harel use
the idea of axis-by-axis optimization, which is a one-
dimensional optimization and runs much faster.
Their method can be used for two-dimensional graph
layout by interleaving 1-D optimizations on x-
coordinate and y-coordinate.
For hierarchical layout, we use the algorithm
developed by Sugiyama, Tagawa and Toda
(Sugiyama et al., 1981) that consists of four major
steps: cycle removal, layering, crossing reduction, x-
coordinate assignment. We use the greedy method
(Eades and Sugiyama, 1990) to remove cycles and to
layer nodes. As for the crossing reduction, we use
the layer-by-layer sweep approach (Eades and
Sugiyama, 1990) that keeps looping until no layer is
HOLY-II: IMPROVED HIERARCHICALLY ORGANIZED LAYOUT FOR VISUALIZATION OF BIOCHEMICAL
COMPLEX PATHWAYS
137
rearranged. However, the process to determine a
permutation between two layers is very slow. We
thus apply the barycentric (BC) heuristic (Sugiyama
et al., 1981) to find a node ordering within a layer.
3.3 Joining Component Layouts
Before joining sub-pathways, we need to place
junction nodes that connect components on the
boundary of each component layout; otherwise
joining them could cause a large number of edge
crossings. Our solution is to insert pseudo-nodes to
push junction nodes outward to the boundary of the
layout. Our node insertion has two policies: one for
cycles and the other for hierarchies. We insert
pseudo-nodes into both sides of a junction node that
is in a cycle. This will force the path containing the
junction node to get flipped outward while forced-
directed layout is performed. For hierarchies, we
simply insert pseudo-nodes between the junction
node and its parent node. Junction nodes will then be
pushed to the bottom of the layout.
To join component layouts, we traverse the tree
in a bottom-up fashion, and at each node, we join all
layouts from its child nodes. To join layouts, we
choose a layout as the first main component, and
join other layouts one at a time to the main
component. Conceptually, we need to search over all
possible joining orders to find the best result. This
will take time exponential to the number of layouts,
and will not be practical for interactive applications.
In our implementation, we determine the joining
order heuristically by priorities defined over
component sizes. The priority of a component is
defined as the number of nodes in that component,
and is doubled if it contains cycles. Note that cycles
often form “backbones” of metabolic pathways. In
that case, one usually draws the cycle first, and adds
remaining parts to the cycle. We thus give higher
priority to cycles. Experiment shows that our
approach produces nice results in real time.
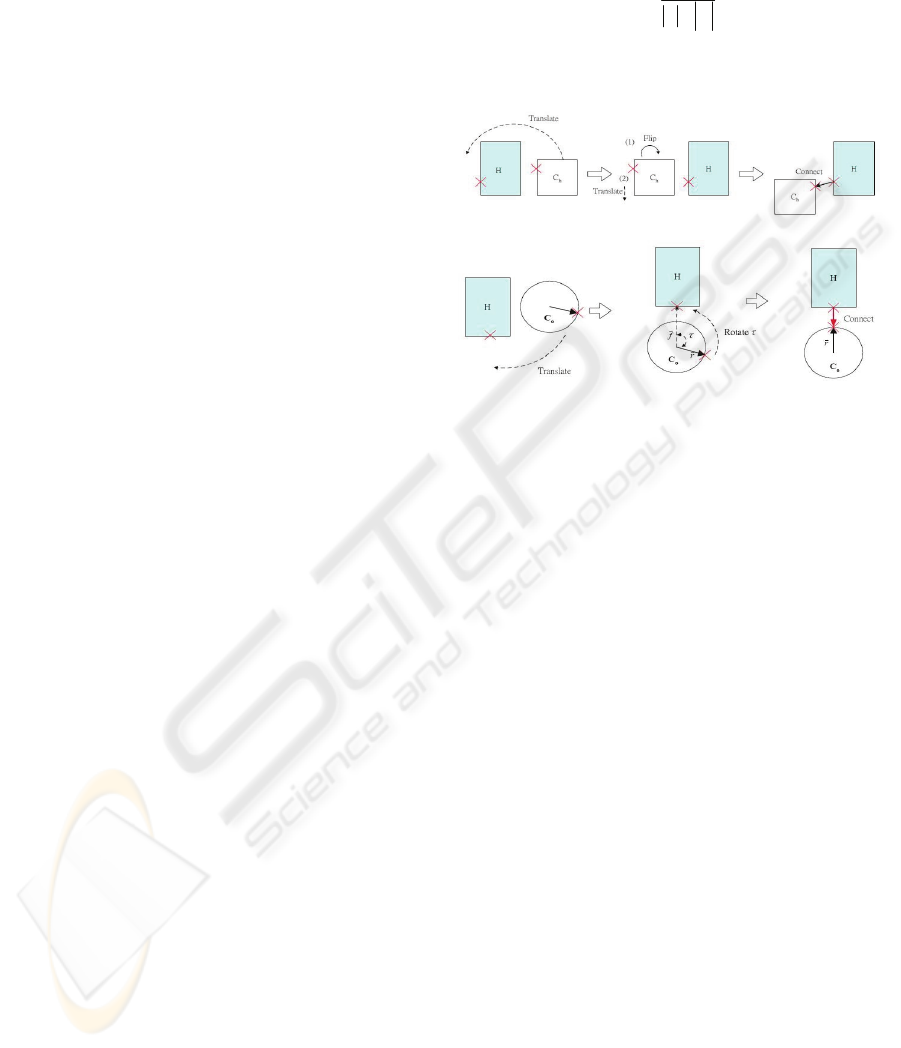
Component layouts are classified into two
categories: hierarchical and cyclic. Each hierarchical
layout is abstracted as a rectangle with its junction
nodes mapped to the boundary of the rectangle.
Similarly, cyclic layouts are abstracted as circles.
We introduce 3 operations for joining two layouts:
translation, rotation and flipping, and develop rules
to apply these operations to join layouts. Rules are
selected based on layout categories and relative
positions of junction nodes. Figure 2(a) illustrates
one of the rules to join two hierarchical layouts. The
red crosses denote the junction nodes. Translation
and flipping are applied to perform the join. Figure
2(b) illustrates one of the rules, which applies
translation and rotation to attach a cyclic layout to a
hierarchical layout. The rotation angleτcomputed
as equation 1.
)
*
.
arccos(
fr
fr
G
G
G
G
=
τ
(1)
where
f
G
and
r
G
denote the vectors from the centroid
of the cyclic layout to the junction nodes.
(a)
(b)
Figure 2: Illustrations of rules for (a) joining two
hierarchical layouts, and (b) joining a cyclic layout to a
hierarchical layout.
4 EXPERIMENTAL RESULTS
We compare layouts produced by HOLY-II and
examples from CADLIVE (CADLIVE, 2008), a
software system for computer-aided design of living
systems, and HOLY (Tsay et al., 2009), the previous
hierarchically organized layout.
4.1 Comparison to CADLIVE
We compare HOLY-II and CADLIVE for the
metabolic pathway given in (CADLIVE, 2008)
which consists of (1)pentose-phosphate,
(2)glycolysis and (3)TCA cycle. Figure 3 gives the
result. Both HOLY-II and CADLIVE successfully
produce clustered pathway layouts in which nodes in
the same sub-pathway are clustered together.
However, HOLY produces much better layout inside
each cluster. In the layout from CADLIVE, reactions
(arcs) are entangled with each other, and the
structure of each cluster is difficult to read. In the
layout from HOLY, the sub-pathway in component
(1) is drawn as a layout of multiple hierarchies,
which reveals the real inner structure of that sub-
pathway. The main structure of component(2) is a
long path, and component (3) consists of two
overlapped cycles.
BIOINFORMATICS 2010 - International Conference on Bioinformatics
138
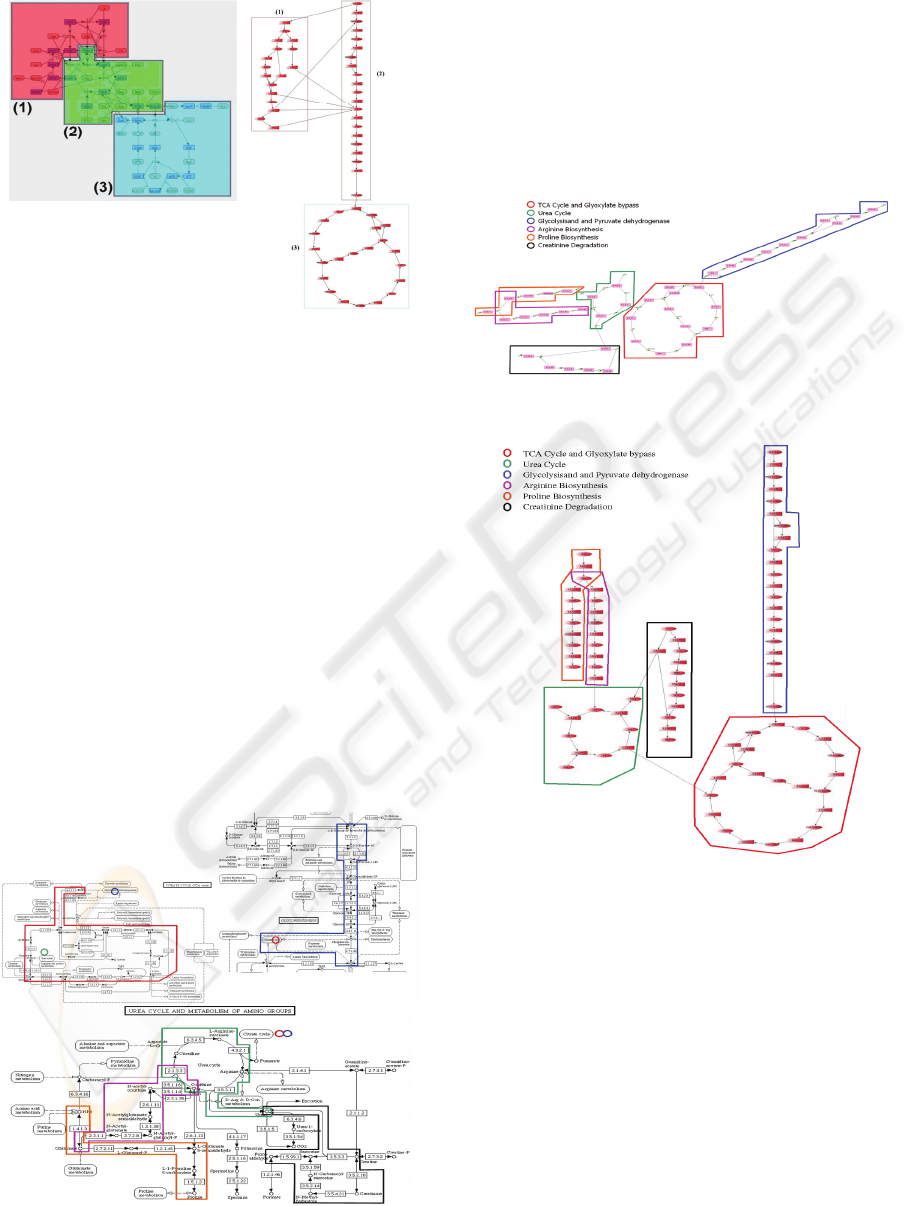
Figure 3: Comparison of layouts produced by
CADLIVE(a) and HOLY-II(b).
4.2 Comparison to HOLY
In Kyoto Encyclopedia of Genes and Genomes
(KEGG) (Kanehisa and Goto, 2000), pathway maps
are drawn by human, and stored in the computer for
retrieval. It is difficult to take several pathways from
the databases, and study their relations in KEGG. In
HOLY-II, it is easy to join pathways selected from
databases, For example, consider a set of selected
pathways that consists of 6 pathways: (1)TCA Cycle
and Glyoxylate bypass, (2)Urea Cycle,
(3)Glycolysisand and Pyruvate dehydrogenase,
(4)Arginine Biosynthesis, (5)Proline Biosynthesis
and (6)Creatinine Degradation. Note that in KEGG,
these pathways are distributed in several maps as
shown in Figure 4. It is difficult to study their
interactions in maps from KEGG.
Figure 4: Layouts are distributed in different maps from
KEGG.
With the joining capability of HOLY and
HOLY-II, one can join these pathways, visualize and
study their relations in one map. Figure 5 and 6
gives the visualization of the pathways selected from
KEGG by HOLY and HOLY-II, respectively. Note
that the visualization produced by HOLY-II is more
compact, and the directions of arcs are more
consistent than the visualization produced by HOLY.
Figure 5: Joining of pathways selected from KEGG by
HOLY.
Figure 6: Joining of pathways selected from KEGG by
HOLY-II.
5 CONCLUSIONS
Experiment shows that HOLY-II is able to give
comprehensible visualization for pathways with
hierarchies, cycles as well as complex structures. In
addition, HOLY-II runs very fast, and has been used
in (Jeng, 2006) to develop an interactive pathway
visualization system.
(a) (b)
HOLY-II: IMPROVED HIERARCHICALLY ORGANIZED LAYOUT FOR VISUALIZATION OF BIOCHEMICAL
COMPLEX PATHWAYS
139

ACKNOWLEDGEMENTS
Part of this research was supported by National
Science Council, Taiwan, ROC, under grant NSC
98-2221-E-194-064-.
REFERENCES
Barreto, A.M.S. and Barbosa, H.J.C., 2000. Graph Layout
Using a Genetic Algorithm. In VI Brazilian
Symposium on Neural Networks IEEE Computer
Society. Los Alamitos, USA, 179-184.
Becker M.Y. and Rojas I., 2001. A Graph Layout
Algorithm for Drawing Metabolic Pathways. In
Bioinformatics, 17(5), 461-467.
Brandenburg F.J., Forster M., Pick A., Raitner M., and
Schreiber F., 2004. Biopath: Exploration and
Visualization of Biochemical Pathways. In Graph
Drawing Software, Mathematics and Visualization.
Springer Verlag.
CADLIVE, 2008. http://kurata21.bse.kyutech.ac.jp/cadlive
(Accessed: 10, July 2008).
Carmel L., Harel D. and Koren Y., 2004. Combining
Hierarchy and Energy for Drawing Directed Graphs.
IEEE Transactions on Visualization and Computer
Graphics, 10(1) 46-57.
Eades P. and Sugiyama K., 1990. How to draw a directed
graph, Journal of information processing 13(4), 424-
437.
Eclipse.org, 2007. http://www.eclipse.org/ (Accessed: 5,
August 2007).
Friedrich C. and Schreiber F., 2004. Flexible Layering in
Hierarchical Drawings with Nodes of Arbitrary Size.
In 27th Conference on Australasian Computer Science
ACM, New York, 369-376.
Fruchterman T. and Reingold E., 1991. Graph Drawing by
Force-Directed Placement. Software-Practice and
Experience, 21(11), 1129- 1164.
Gansner E.R. and North S.C., 1998. Improved Force-
directed Layouts, International Symposium on Graph
Drawing, Lecture Notes In Computer Science. 1547,
Springer-Verlag, Germany, 364 – 373.
Jeng Y.S., 2006. VisualPathway: Biochemical Pathway
Layout and Visualization System. Master Thesis,
Department of Computer Science and Information
Engineering, National Chung-Cheng University, 2006.
Kamada T. and Kawai S., 1989. An algorithm for drawing
general undirected graphs. In Information Processing
Letters 31(1),7-15.
Kanehisa M. and Goto S., 2000. KEGG: Kyoto
Encyclopedia of Genes and Genomes. In Nucleic
Acids Research. Oxford University Press, 28(1), 27-
30.
Karp P.D. and Paley S., 1994. Automated Drawing of
Metabolic Pathways. In The 3rd Intl. Conference on
Bioinformatics and Genome Research World Scientific
Publishing Company, New Jersey, 225-238.
Kato M., Magasaki M., Doi A., and Miyano S., 2005.
Automatic Drawing of Biological Networks Using
Cross Cost and Subcomponent Data. In Genome
Informatics
16(2), 22-31.
Koren Y. and Harel D.,2003. Axis-by-Axis Stress
Minimization. In 11th Inter. Symposium on Graph
Drawing Springer Verlag, Germany, 450-459.
Li W. and Kurata H., 2005. A Grid Layout Algorithm for
Automatic Drawing of Biochemical Networks. In
Bioinformatics 21(9), 2036-2042.
Masui T., 1994. Evolutionary Learning of Graph Layout
Constraints from Examples. In ACM Symposium on
User Interface Software and Technology ACM, New
York, 103-108.
MetaCyc Encyclopedia of Metabolic Pathways, 2008.
http://metacyc.org/ (Accessed: 10, July 2008).
Pinney J.W., Westhead D.R., and McConkey G.A., 2003.
Petri Net Representations in Systems Biology. In
Biochemical Society Transactions 31(6),1513-1515.
Salamonsen W., Mok K., Kolatkar P., and Subbiah S.,
2004. BioJAKE: A Tool for the Creation,
Visualization and Manipulation of Metabolic
Pathways. In Pacific Symposium on Biocomputing.
World Scientific Publishing Company, New Jersey,
392-400.
Suderman M. and Hallett M., 2007. Tools for Visually
Exploring Biological Networks. In Bioinformatics,
23(20), 2651-2659.
Sugiyama K., Tagawa S., and Toda M.,1981. Methods for
Visual Understanding of Hierarchical Systems. IEEE
Transactions on Systems, Man, and Cybernetic, SMC,
11(2), 109-125.
Sugiyama K., 1987. A Cognitive Approach for Graph
Drawing. In Cybernetics and Systems: An
International Journal, 18 (6) ,447-488.
Trost E., Hackl H., Maurer M., and Trajanoski Z, 2003.
Java Editor for Biological Pathways, Bioinformatics 19(6).
Tsay J.J., Wu B.L. and Jeng Y.S., 2009. Hierarchically
Organized Layout for Visualization of Biochemical
Pathways. accepted for publication in International
Journal Artificial Intelligence in Medicine.
BIOINFORMATICS 2010 - International Conference on Bioinformatics
140
