
A NICHED PARETO GENETIC ALGORITHM
For Multiple Sequence Alignment Optimization
Fernando José Mateus da Silva
Dept. of Informatics Engineering, School of Technology and Management, Polytechnic Institute of Leiria, Portugal
Juan Manuel Sánchez Pérez, Juan Antonio Gómez Pulido, Miguel A. Vega Rodríguez
Dept. Tecnologías Computadores y Comunicaciones, Escuela Politécnica, Universidad de Extremadura, Spain
Keywords: Multiple sequence alignments, Genetic algorithms, Multiobjective optimization, Niched Pareto, Equivalence
class sharing, Bioinformatics.
Abstract: The alignment of molecular sequences is a recurring task in bioinformatics, but it is not a trivial problem.
The size and complexity of the search space involved difficult the task of finding the optimal alignment of a
set of sequences. Due to its adaptive capacity in large and complex spaces, Genetic Algorithms emerge as
good candidates for this problem. Although they are often used in single objective domains, its use in
multidimensional problems allows finding a set of solutions which provide the best possible optimization of
the objectives – the Pareto front. Niching methods, such as sharing, distribute these solutions in space,
maximizing their diversity along the front. We present a niched Pareto Genetic Algorithm for sequence
alignment which we have tested with six BAliBASE alignments, taking conclusions regarding population
evolution and quality of the final results. Whereas methods for finding the best alignment are mathematical,
not biological, having a set of solutions which facilitate experts’ choice, is a possibility to consider.
1 INTRODUCTION
The alignment of protein, DNA and RNA sequences
is a very frequent task in bioinformatics. Multiple
sequence alignment is an optimization problem
which consists on finding the best alignment from
large complex search spaces (Horng et al., 2005). Its
main goal is to help in the comparison of sequence
structure relationship, by identifying sequences’
similarities and differences (Pal et al., 2006).
Genetic Algorithms (GAs) are search algorithms
based on the principals of natural evolution and
genetics (Goldberg, 1989). They are able to take
advantage of gathering information about an initially
unknown search space, in order to bias subsequent
search into useful subspaces. This quality makes
them suitable for problems with large, complex, and
poorly understood search spaces (De Jong, 1988),
such as multiple sequence alignment. Although GAs
are often used in single objective problems, they can
also be used in multiobjective problems, on which
the GA is used to find all possible tradeoffs among
the multiple conflicting objectives (Horn et al.,
1994). The resulting non-dominated solutions lie on
the Pareto optimal frontier, meaning that there are no
other solutions superior in all objectives.
Niching methods, such as sharing, helps in
maintaining the diversity of certain properties within
the population, preventing the convergence to a
single point in the Pareto front and allowing parallel
convergence into multiple good solutions (Shir and
Back, 2006).
In our prior investigation we have developed
AlineaGA, a genetic algorithm which performs
multiple sequence alignment. In our first approach,
we tested AlineaGA with a single objective fitness
function – the sum-of-pairs (Silva et al., 2008).
Later, we tested the weighted sum of the
sum-of-pairs value with the number of fully identical
columns to perform alignment evaluation (Silva et
al., 2009). Now, we present a multiobjective strategy
which tries to maximize both the sum-of-pairs and
the number of fully identical columns by means of a
niching mechanism named equivalence class sharing
(Horn et al., 1994). Our objective is to evaluate the
quality of the found solutions using this approach.
For this matter, we have tested AlineaGA with six
BAliBASE (Thompson et al., 1999) alignments.
323
José Mateus da Silva F., Manuel Sánchez Pérez J., Antonio Gómez Pulido J. and A. Vega Rodríguez M. (2010).
A NICHED PARETO GENETIC ALGORITHM - For Multiple Sequence Alignment Optimization.
In Proceedings of the 2nd International Conference on Agents and Artificial Intelligence - Artificial Intelligence, pages 323-329
DOI: 10.5220/0002729303230329
Copyright
c
SciTePress

This paper is organized as follows. In the next
Section we introduce concepts underlying our
research. In Section 3, we present a brief explanation
regarding AlineaGA methods. Section 4 presents
AlineaGA’s niched Pareto approach. The
experiments performed in order to observe the
impact of these strategy are discussed in Section 5.
Finally, the concluding Section presents final
considerations and topics for future work.
2 BACKGROUND
Although it may not be obvious, multiple sequence
alignments are present in most of the computational
methods used in molecular biology. They are used in
different areas such as functional genomics,
structure modelling, mutagenesis experiments,
evolutionary studies and drug design.
There are several approaches to the sequence
alignment. The two most important ones are based
on progressive and iterative methods.
When progressive methods are used, the
alignment is gradually built up by aligning the two
most similar sequences first, and adding the less
similar ones one after another. This fast and simple
method has a critical problem: if a mistake is made
at an intermediate step, it cannot be corrected later
by adding the remaining sequences. Also, it does not
provide a metric which allows the comparison of
two different alignments of the same set of
sequences, or which can be used to say that the best
possible alignment, for a set of parameters, have
been found (Notredame and Higgins, 1996).
Iterative methods try to optimize a scoring
function which reflects the biological events which
took place in the evolution of the sequences.
Optimizing this score leads to a correct alignment
(Lassmann and Sonnhammer, 2002). One example
of iterative methods are GAs, other examples may
be found in our prior review (Silva et al., 2007).
2.1 Alignment
An alignment is an arrangement of two or more
sequences in a way which reveals where the
sequences are similar, and where they differ. An
optimal alignment exhibits the most
correspondences and the fewest differences, even if
it will not be biologically meaningful (Pal et al.,
2006). Figure 1 shows an example of an alignment
of four hypothetical protein sequences.
Figure 1: Example of a multiple sequence alignment.
Sequences may have different lengths and each
one is represented in a different line. Columns with
the same characters, presented in bold, show that in
that specific position, no mutation occurs among the
sequences. On the other hand, columns which
present different characters show that mutation
events have taken place. The characters used to
represent the elements of the molecular sequences
are often referred as residues.
Gaps can be introduced in the sequences,
allowing the alignment to be extended into regions
where its sequences may have lost or gained
residues. These gaps are usually represented by the
symbol “–”.
2.2 Genetic Algorithms
GAs, are a class of evolutionary algorithms
introduced by Holland (Holland, 1975). Its search
methods model some natural facts: genetic
inheritance and Darwinian strife for survival
(Michalewicz, 1996).
In GAs, the adaptation is done by keeping a
population of structures from which new structures
are produced through genetic operators, such as
crossover and mutation(De Jong, 1988).
In crossover, characteristics of two randomly
chosen individuals (parents), are combined to form
two similar offspring by swapping corresponding
segments of parents. Mutation randomly alters some
values within the individual by a arbitrary change
(Anbarasu et al., 2000). Each structure of the
population has a fitness score, which is used to
choose which structures will be used to form new
ones (De Jong, 1988).
The ability to gather information about a search
space, initially unknown, to direct the search for
useful subspaces, is a distinguishing characteristic of
GAs. This ability makes them suitable for solving
problems with large, complex and unknown search
spaces (De Jong, 1988).
2.3 Fitness Sharing
Fitness sharing (Goldberg and Richardson, 1987) is
a mechanism for maintaining population diversity. It
distributes the population over different peaks in the
search space by reducing the fitness of highly
similar solutions.
-TISCTGNIGAG-NHVKWYQQLPG
-RLSCSSIFSS--YAMYWVRQAPG
L-LTCTVSFDD--YYSTWVR
Q
PPG
ICAART 2010 - 2nd International Conference on Agents and Artificial Intelligence
324

Equation 1 presents the shared fitness of an
individual i, where f
i
is the individual raw fitness and
m
i
is the nich count, representing how crowded is the
neighborhood of individual i.
i
i
share
i
m
f
f =
(1)
The nich count is computed by adding a sharing
function over all members of the population as
follows:
()
∑
=
=
n
j
jii
dShm
1
,
(2)
Where Sh(d
i,j
) represents the sharing function,
presented in Equation 3, and d
i,j
is the distance
between the i and j individuals, which can be based
on either phenotype or genotype similarity.
Sh(d
i,j
) =
share
ji
d
σ
,
1−
if d ≤ σ
share
0 if d > σ
s
hare
(3)
The niche radius is given by σ
share
. Solutions
within this radius are in the same neighborhood,
reducing each other’s fitness.
3 AlineaGA METHODS
In AlineaGA, the initial population is randomly
generated, and then the individuals are selected,
combined and mutated in order to produce new
solutions through the course of a defined number of
generations. This section presents a brief explanation
regarding AlineaGA’s representation, evaluation,
crossover and mutation.
3.1 Representation
We use a non-codified representation of the
individuals. Real multiple sequence alignments, as
the one presented in Figure 1, are used as data
structures for each individual. Chromosomes are
represented by arrays of characters on which each
line corresponds to a sequence in the alignment, and
each column represents a residue at a specific
position.
3.2 Evaluation
To perform the evaluation of each solution, two
attributes are used: the sum-of-pairs and the identity
of the alignment. The sum-of-pairs function,
presented in Equation 4, is assessed by scoring all of
the pairwise comparisons between each residue in
each column of an alignment and adding the scores
together (Wang and Lefkowitz, 2005).
),(
1
11
j
n
i
n
ij
i
llrixScoringMatPairsofSum
∑∑
−
=+=
=−−
(4)
For this purpose, a scoring matrix which
determines the cost of substituting a residue for
another is used, as well as a gap penalty value to
determine the cost of aligning a residue with a gap.
We use the PAM 350 (Dayhoff et al., 1978) scoring
matrix with a gap penalty of -10 (Silva et al., 2008).
The identity of the alignment is simply the
number of fully identical columns in the alignment.
3.3 Crossover
AlineaGA uses one of the two crossover operators,
randomly selected within each generation. The One
Point crossover derives from Goldberg’s standard
one point crossover operator (Goldberg, 1989) with
an extension that treats the existing gaps in each
sequence. On RecombineMatchedCol (Chellapilla
and Fogel, 1999), the fully identical columns of the
first parent which do not appear in the second one
are identified, and then, one of these fully aligned
columns is randomly selected and is generated in the
second alignment, originating the offspring.
3.4 Mutation
Each mutation operator is randomly selected from a
pool of six operators and it is applied to an
individual according with the defined mutation
probability. Whenever the mutated solution is worst
than the original one, a new mutation must be
applied to the mutated individual. This process is
repeated until the fitness improves or during a
specific number of attempts. We opted for the
maximum of 2 tries. This strategy allows a good
tradeoff between speed and robustness, without
transforming completely the solutions in a single
generation.
The Gap Insertion operator extends the
alignments by inserting gaps into the sequences in a
random fashion, such as in GenAlignRefine (Wang
and Lefkowitz, 2005) gap insertion operator.
Shifting gaps is another way to introduce new
alignment configurations. In the Gap Shifting
mutation operator, a gap is randomly chosen in an
alignment and it is moved to another position in the
same sequence (Notredame et al., 1997).
The Merge Space operator merges together two
or three spaces of a sequence (Horng et al., 2000). It
randomly selects two or three consecutive gaps of a
sequence, adjacent or not adjacent, and then merges
these gaps together. After that, they are shifted to a
randomly chosen position in the same sequence.
A NICHED PARETO GENETIC ALGORITHM - For Multiple Sequence Alignment Optimization
325

The Smart Merge Space is similar to the Merge
Space operator, but it only applies the mutation if
the fitness of the mutated solution is greater than the
fitness of the original one (Silva et al., 2009).
The Smart Gap Insertion is a variation of the Gap
Insertion operator which only produces the mutation
when the fitness of the mutated alignment is greater
than the fitness of the original one (Silva et al.,
2008). The insertion of additional gaps is determined
by a direction probability which reflects the success
of inserting gaps at the beginning or at the end of the
alignment. If the operator does not improve the
alignment at the first attempt, it chooses a new
random position of insertion and repeats the whole
process. The defined number of maximum attempts
is set to 3, but it can be customized according to
user’s needs.
The Smart Gap Shifting, tries to move the gaps
of an alignment until its fitness improves (Silva et
al., 2008). As in the Smart Gap Insertion operator,
the shift direction is determined by a direction
probability which is updated when better alignments
are found. Likewise, the mutation occurs only if the
fitness of the generated alignment is greater than the
original one.
The use of crossover and mutation operators can
produce columns completely formed by gaps in the
alignment. To remove these gap columns we use the
Gap Column Remover (Silva et al., 2008), which is
not conditioned by the mutation probability and it is
applied at the end of each generation.
4 NICHED PARETO GA
The Niched Pareto GA is characterized by its
selection mechanism. In previous works (Silva et al.,
2008, Silva et al., 2009), we use tournament
selection to choose the solutions of the current
generation that will prevail for the next one.
However, throughout the generations, this technique
tends to lead the population to a single point in the
search space. To maintain multiple Pareto optimal
solutions and avoid convergence, we use Pareto
domination tournaments and equivalence class
sharing (Horn et al., 1994), which we now present.
4.1 Pareto Domination Tournaments
In a normal binary tournament, two randomly
selected individuals compete for domination. If one
dominates the other, it wins. However, this condition
does not produce a sufficient domination pressure.
Pareto domination tournaments (Horn et al., 1994)
use a sampling scheme which offers control over the
domination pressure. In this method, two candidate
solutions are randomly chosen from the population
for selection purposes. Also, a comparison set is
formed by randomly choosing individuals from the
population. Then, each candidate solution is
compared with every individual in the comparison
set. The candidate which dominates all the
individuals in the comparison set is selected for
reproduction. If both candidates dominate or are
dominated by the comparison set, then sharing is
used to select the winner, as section 4.2 explains.
Adjusting the size of the comparison set allows
the control of the domination pressure. High values
for this parameter tend to increase the pressure
towards a small portion of the front. On the other
hand, small comparison sets result in many
dominated solutions. Typically, a comparison set
with size of 10% of the population, yields a tight and
complete distribution over the front (Horn et al.,
1994).
4.2 Equivalence Class Sharing
To avoid genetic drift, whenever the candidate
solutions are both dominated or both non-dominated
by the comparison set, the winner is selected by
equivalence class sharing (Horn et al., 1994).
This particular method of sharing does not
degrade the fitness of the individuals. Instead, it
assumes that candidates, mutually dominated or
non-dominated, are equally fit. Therefore, in order to
maintain diversity along the Pareto front, this
method computes the nich count of both candidates
and selects the one which has the smallest number of
individuals on its neighbourhood.
4.2.1 Distance Metric
The distance metric may be based on either
phenotype or genotype similarity. In our particular
case, the genotype and phenotype representation are
the same. As we are trying to maximize two
different objectives represented in a 2 dimensional
space, we opt for using the Euclidean distance as a
similarity measure.
4.2.2 Niche Radius σ
share
Defining the radius which determines each nich
range is not a trivial mater. Such as (Shir and Back,
2006), we determine the σ
share
value according with
Equation 5.
n
share
q
r
=
σ
(5)
ICAART 2010 - 2nd International Conference on Agents and Artificial Intelligence
326
Table 1: Results for the AlineaGA Niched Pareto test configurations.
Dataset
BAliBASE
Number of
Peaks
AlineaGA
SOP ID Avg. Best SOP Avg. Best ID Best SOP Best ID
1aho 2015 12
81 1974,83 10,90 2155 13
49 1974,60 11,03 2141 13
4 1960,03 10,93 2112 13
1fmb 1706 25
36 1817,03 24,97 1864 27
100 1811,07 24,93 1860 27
4 1807 25,40 1864 27
1plc 2403 18
4 2356 17,33 2590 20
25 2353,87 17,60 2589 20
100 2340,60 17,10 2576 20
1hpi 1208 10
4 1135,43 12,17 1198 14
81 1128,30 12,37 1198 14
36 1120,17 12,64 1201 15
1pfc 2216 13
16 2442,97 14,23 2519 15
4 2435,90 14,33 2536 17
49 2425,17 14,17 2533 16
1ycc 963 11
36 883,93 6,9 1091 10
9 864,03 7,2 1093 10
64 859,47 6,7 1045 11
SOP, sum-of-pairs; ID, identity; Avg., Average. Avg. Best SOP and Avg. Best ID were obtained by averaging the results of 30 runs.
The existing theory for setting this value,
assumes that the solution set has a previously known
finite number of peaks q (Shir and Back, 2006).
By knowing the upper and lower bounds of each
objective, r is defined as follows:
()
∑
=
−=
n
k
kmsxk
xxr
1
2
min,,
2
1
(6)
Where n defines the number of objectives, which
in our particular case, is 2.
The lower and upper bounds of each dimension
are computed on every generation, presenting
different values as population evolves. However, in
multiple sequence alignment, there is no practical
way of knowing the maximum number of peaks
beforehand. Therefore, we opt to test several values
for this parameter, as next section describes.
5 TESTING AND RESULTS
Our goal is to find the best possible solutions which
maximize the sum-of-pairs and the identity of each
alignment. We test the sharing function with
different σ
share
values, which are obtained by
computing the nich radius for various peak values.
In our tests, we use six datasets from the
Reference 1 alignments of BAliBASE (Thompson et
al., 1999). Three of these datasets (1aho, 1fmb,
1plc,) have more than 35% of identity among its
sequences; and the rest (1hpi, 1pfc, 1ycc) present
20% to 40% of identity. We have measured the
sum-of-pairs score and the identity of each one of
these datasets. Later we use these reference results to
evaluate the different test configurations.
5.1 Test Configurations
Although we have tested all our datasets for 4, 9, 16,
25, 36, 49, 64, 81 and 100 peaks, we only present
the results for the 3 configurations which obtained
the best results on each dataset. Also, we have
started by executing the algorithm during 10000
generations with a mutation probability of 0.05, but
we have realized that an equivalent final solution set
could be achieved in 2000 generations in less time,
by increasing the mutation probability to 0.4.
Therefore, we have opted for this latter setting. The
remaining parameters are the same in all
configurations: the population size is 100, the
crossover probability is 0.8 and the number of
inserted gaps by the Gap Insertion and Smart Gap
Insertion operators is 10. Finally, the size of the
comparison set for the Pareto domination
tournaments is set to 10.
5.2 Results
Next we present the results of tests performed. All
the results were obtained by averaging the
sum-of-pairs and the identity scores, from 30 runs of
AlineaGA, for each configuration/dataset.
5.2.1 Performance
Table 1 summarizes the performance of the top 3
configurations for each test dataset. The “SOP” of
BAliBASE alignment column, presents the
sum-of-pairs score for the different datasets. This
value was computed using the PAM 350 scoring
matrix and a gap penalty of -10. The “ID” of
BAliBASE shows the number of fully aligned
A NICHED PARETO GENETIC ALGORITHM - For Multiple Sequence Alignment Optimization
327
columns on each BAliBASE’s alignment. Columns
“Avg. Best SOP” and “Avg. Best ID”, show the
average sum-of-pairs and the average identity scores
obtained in 30 runs of AlineaGA. The best values
found for the sum-of-pairs and identity scores are
presented in columns “Best SOP” and “Best ID”.
As the results state, it is not possible to establish
a direct relation between the number of peaks and
the percentage of identity of the alignments. This
parameter is directly related with each particular
alignment and can not be determined in such generic
way. Comparing with the BAliBASE alignments,
and with the exception of 1hpi dataset, it is possible
to find equal or higher values for both objectives
simultaneously in our results. However, the average
sum-of-pairs and average identity of the 30
executions of each test are superior only in 1fmb and
1pfc datasets.
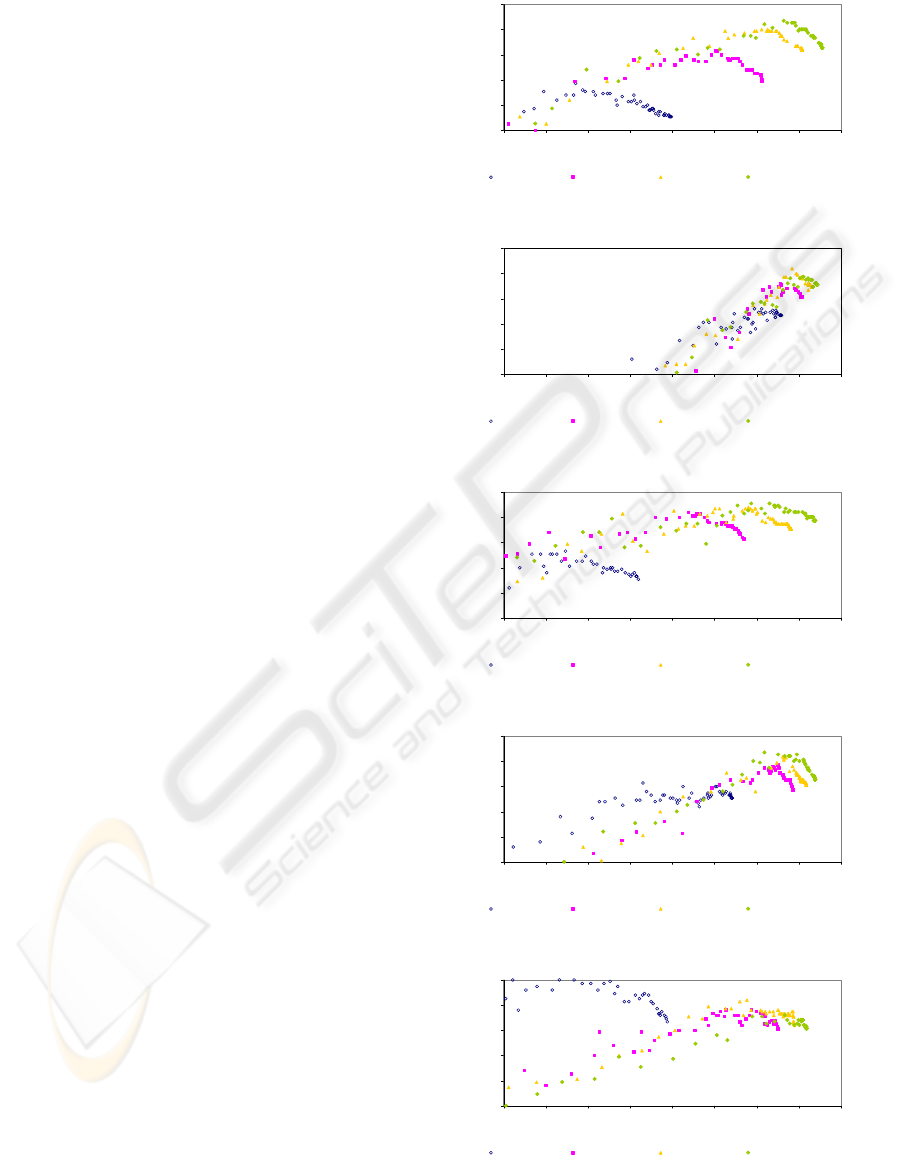
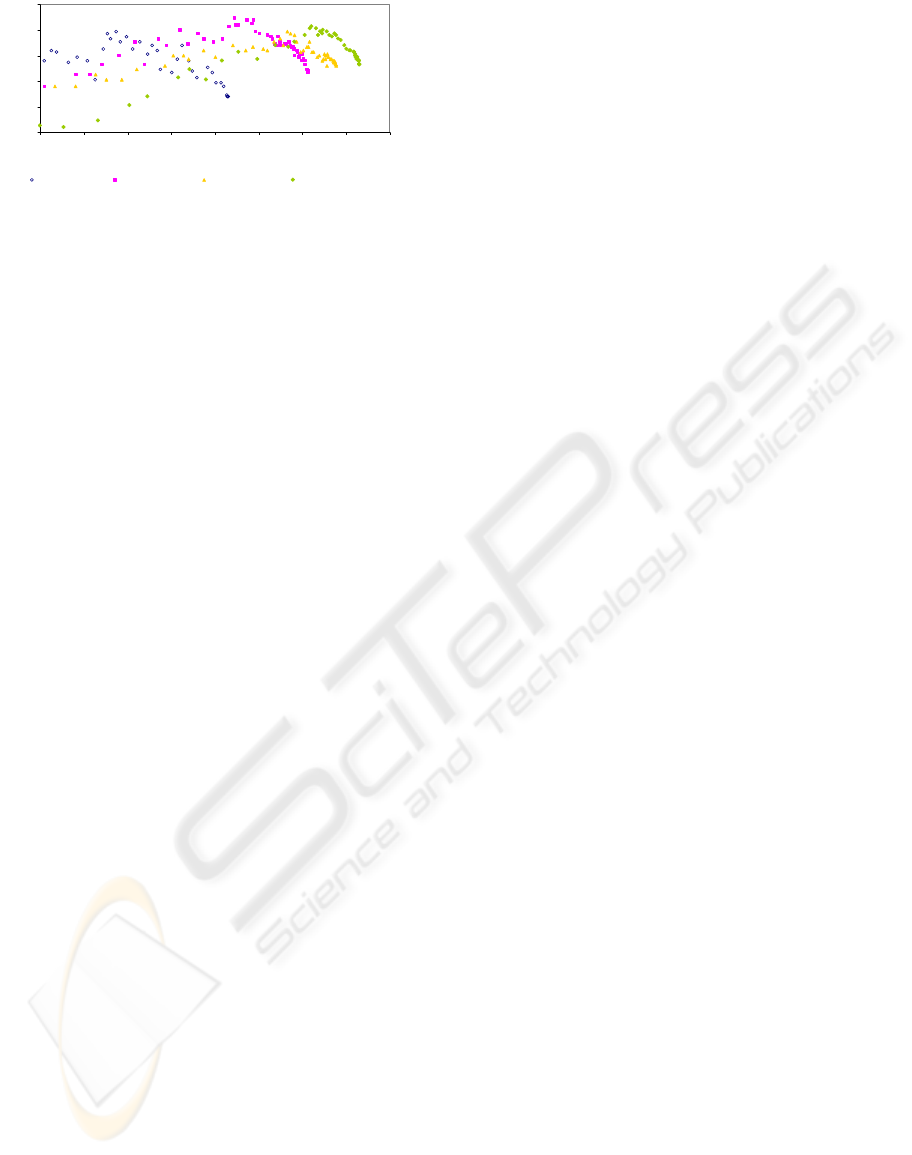
5.2.2 Population’s Evolution
Figures 2 to 7, present the population’s fitness
evolution for the best configurations on each dataset.
These values were obtained by averaging each
solution’s sum-of-pairs and identity scores from the
30 runs of the program. Each figure shows the
representation of the population throughout the
generations in 4 particular moments: generations
500, 1000, 1500 and 2000 - the final solution set.
We can observe that high values for one of the
objectives, will necessarily lower other objective’
score. Also, after 2000 generations, we can see that
the majority of the population is tightly distributed
along the front. Nevertheless, there are a few
dominated solutions. These solutions result of
crossover and mutation, but generally, they are not
held. Dataset 1pfc, shown in Figure 6, presented the
most atypical evolution, with the resulting front
solutions distributed in a small space on which could
have featured some individuals with higher identity
values present in generation 1500.
6 CONCLUSIONS
By using a multiobjective approach in this domain,
we try to offer a solution to a very significant
limitation of multiple sequence alignment: its
mathematical approach. As stated before, the best
alignment is the one which presents the most
correspondences and the fewest differences, but
which may or may not be biologically meaningful
knowledge is needed to validate the results of an
alignment tool. By presenting a set of solutions
instead of a single one, it is possible for a biologist
to observe several hypotheses and so choose the one
which is closer to the biological reality.
9
9,5
10
10,5
11
11,5
1600 1650 1700 1750 1800 1850 1900 1950 2000
SOP
ID
Generation: 500 Generation: 1000 Generation: 1500 Generation: 2000
Figure 2: Population average fitness for 1aho, 81 peaks.
23
23,5
24
24,5
25
25,5
1450 1500 1550 1600 1650 1700 1750 1800 1850
SOP
ID
Generation: 500 Generation: 1000 Generation: 1500 Generation: 2000
Figure 3: Population average fitness for 1fmb, 36 peaks.
15
15,5
16
16,5
17
17,5
2000 2050 2100 2150 2200 2250 2300 2350 2400
SOP
ID
Generation: 500 Generation: 1000 Generation: 1500 Generation: 2000
Figure 4: Population average fitness for 1plc, 4 peaks.
10
10,5
11
11,5
12
12,5
775 825 875 925 975 1025 1075 1125 1175
SOP
ID
Generation: 500 Generation: 1000 Generation: 1500 Generation: 2000
Figure 5: Population average fitness for 1hpi, 4 peaks.
11,5
12
12,5
13
13,5
14
2100 2150 2200 2250 2300 2350 2400 2450 2500
SOP
ID
Generation: 500 Generation: 1000 Generation: 1500 Generation: 2000
Figure 6: Population average fitness for 1pfc, 16 peaks.
ICAART 2010 - 2nd International Conference on Agents and Artificial Intelligence
328
5
5,5
6
6,5
7
7,5
525 575 625 675 725 775 825 875 925
SOP
ID
Generation: 500 Generation: 1000 Generation: 1500 Generation: 2000
Figure 7: Population average fitness for 1ycc, 36 peaks.
The main drawback of this method, as it is
implemented, is its dependence of previously
knowing the expected number of peaks in the search
space. This problem may be overcome by trying to
identify the number of peaks in the population
dynamically, or by using a different approach when
computing the nich radius, σ
share
.
Alternative objectives, such as minimizing the
number of gaps, may be used instead of maximizing
the identity. However, this kind of approach may
have poor results when several gaps are needed to
maximize the similarity among the sequences. A
possible solution is to increase the complexity of the
problem by optimizing three objectives: maximize
identity and sum-of-pairs scores, and minimize the
number of gaps in the alignment.
REFERENCES
Anbarasu, L. A., Narayanasamy, P. & Sundararajan, V.
(2000) Multiple molecular sequence alignment by
island parallel genetic algorithm. Current Science, 78,
858-863.
Chellapilla, K. & Fogel, G. B. (1999) Multiple sequence
alignment using evolutionary programming. IN
Angeline, P. J., Michalewicz, Z., Schoenauer, M.,
Yao, X. & Zalzala, A. (Eds.) Proceedings of the 1999
Congress on Evolutionary Computation. Washington
DC, USA, IEEE Press.
Dayhoff, M. O., Schwartz, R. M. & Orcutt, B. C. (1978) A
Model of Evolutionary Change in Proteins. Atlas of
Protein Sequence and Structure. National Biomedical
Research Foundation.
De Jong, K. (1988) Learning with genetic algorithms: An
overview. Mach Learning, 3, 121-138.
Goldberg, D. E. (1989) Genetic Algorithms in Search,
Optimization, and Machine Learning Reading, MA,
Addison-Wesley Publishing Company.
Goldberg, D. E. & Richardson, J. (1987) Genetic
algorithms with sharing for multimodal function
optimization. Proceedings of the Second International
Conference on Genetic Algorithms on Genetic
algorithms and their application. Cambridge,
Massachusetts, United States, L. Erlbaum Associates
Inc.
Holland, J. H. (1975) Adaptation in natural and artificial
systems, Univ Mich Press. Ann Arbor.
Horn, J., Nafpliotis, N. & Goldberg, D. E. (1994) A niched
Pareto genetic algorithm for multiobjective
optimization. Proceedings of the First IEEE
Conference on Evolutionary Computation, IEEE
World Congress on Computational Intelligence 1, 82-
87.
Horng, J.-T., Lin, C.-M., Liu, B.-J. & Kao, C.-Y. (2000)
Using Genetic Algorithms to Solve Multiple Sequence
Alignments. IN Whitley, L. D., Goldberg, D. E.,
Cantu-Paz, E., Spector, L., Parmee, I. C. & Beyer, H.-
G. (Eds.) Proceedings of the Genetic and Evolutionary
Computation Conference (GECCO-2000). Las Vegas,
Nevada, USA, Morgan Kaufmann.
Horng, J., Wu, L., Lin, C. & Yang, B. (2005) A genetic
algorithm for multiple sequence alignment. Soft
Computing, 9, 407-420.
Lassmann, T. & Sonnhammer, E. L. L. (2002) Quality
assessment of multiple alignment programs. FEBS
Letters, 529, 126-130.
Michalewicz, Z. (1996) Genetic algorithms + data
structures = evolution programs - Third, Revised and
Extended Edition, Springer.
Notredame, C. & Higgins, D. G. (1996) SAGA: sequence
alignment by genetic algorithm. Nucleic Acids
Research, 24, 1515-1524.
Notredame, C., O'Brien, E. A. & Higgins, D. G. (1997)
RAGA: RNA sequence alignment by genetic
algorithm. Nucleic Acids Research, 25, 4570-4580.
Pal, S. K., Bandyopadhyay, S. & Ray, S. S. (2006)
Evolutionary computation in bioinformatics: A
review. IEEE Transactions on Systems Man and
Cybernetics Part C-Appl and Rev, 36, 601-615.
Shir, O. M. & Back, T. (2006) Niche radius adaptation in
the cma-es niching algorithm. Lecture Notes in
Computer Science, 4193, 142.
Silva, F. J. M., Sánchez Pérez, J. M., Gómez Pulido, J. A.
& Vega Rodríguez, M. Á. (2007) Alineamiento
Múltiple de Secuencias utilizando Algoritmos
Genéticos: Revisión. Segundo Congreso Español de
Informática. Zaragoza, Spain, CEDI.
Silva, F. J. M., Sánchez Pérez, J. M., Gómez Pulido, J. A.
& Vega Rodríguez, M. Á. (2008) AlineaGA: A
Genetic Algorithm for Multiple Sequence Alignment.
IN Nguyen, N. T. & Katarzyniak, R. (Eds.) New
Challenges in Applied Intelligence Technologies.
Springer-Verlag.
Silva, F. J. M., Sánchez Pérez, J. M., Gómez Pulido, J. A.
& Vega Rodríguez, M. Á. (2009) AlineaGA - A
Genetic Algorithm with Local Search Optimization for
Multiple Sequence Alignment. Applied Intelligence, 1-
9.
Thompson, J. D., Plewniak, F. & Poch, O. (1999)
BAliBASE: a benchmark alignment database for the
evaluation of multiple alignment programs.
Bioinformatics, 15, 87-88.
Wang, C. & Lefkowitz, E. J. (2005) Genomic multiple
sequence alignments: refinement using a genetic
algorithm. BMC Bioinformatics, 6.
A NICHED PARETO GENETIC ALGORITHM - For Multiple Sequence Alignment Optimization
329
