
AN AGENT-BASED MODEL FOR RECREATIONAL FISHING
MANAGEMENT EVALUATION IN A CORAL REEF
ENVIRONMENT
Lei Gao, Jeff Durkin and Atakelty Hailu
School of Agricultural and Resource Economics, University of Western Australia
35 Stirling Highway,Crawley, WA 6009, Australia
Keywords: Agent-based model, Random utility model, Recreational fishing, Management strategy Evaluation,
Economic surplus, Non-market valuation.
Abstract: This paper presents an integrated agent-based model of recreational fishing behaviour within a reef
ecosystem as a platform for the evaluation of recreational fishing management strategies. Angler behaviour
is described using econometrically estimated site choice models. Site choice among anglers is driven by site
attributes and angler characteristics. The biophysical model represents the marine reef environment as a
system with different trophic levels identifying algal and coral growth as well as two types of fish
(piscivores and herbivores). Ecosystem dynamics are driven by interactions within the trophic levels and
fishing activities. The model is capable of simulating the biophysical and economic welfare impacts of
management strategies in a manner that accounts for feedback effects.
1 INTRODUCTION
Recreational fishing provides economic benefits that
can be substantial but are not reflected in market
transactions. At the same time, fishing activities can
threaten valuable fish stocks and cause damage to
marine environments. Consequently the
management of recreational fishing is a
controversial subject in most jurisdictions. A careful
balance needs to be struck between providing
opportunities to enrich the experiences of
recreationists and minimizing impacts on the natural
environment and fish stock sustainability.
Causality in recreational fishing choices runs in
both directions: fishing choices are affected by the
availability of fish stocks and the condition of
fishing sites; and fishing activities affects not only
fish stocks but also other trophic layers in the marine
environment. Formulating management strategies
for these complex systems requires the use of
integrated models. Through model-based simulation,
resource managers are able to explore the
implications of different management scenarios and
then make informed decisions.
This paper presents an agent-based model that
combines a fishing site choice model and a
biophysical model of a coral reef environment. An
agent-based model (ABM) is a bottom-up approach
that abstracts a complex system as a collection of
interacting, autonomous agents. ABM provides a
number of significant advantages over traditional
methods (Jennings, 2001). In our model, anglers as
well as components of the biophysical model are
represented as agents. The behaviour of the angler
agents is represented by empirically based Random
Utility Models (RUMs) (Schuhmann and Schwabe,
2004) that rationalize choices on the basis of
attributes of the individuals, the features of
alternative choices and recreational experience. It is
possible not only to simulate fishing behaviour but
also construct welfare estimates at the individual
level. Then, these welfare estimates can then be
aggregated up to the population level for use in cost-
benefit analysis and the economic evaluation of
changes in recreational management. The model
makes it possible to undertake “what-if” scenario
analysis and allows researchers and managers to
better understand the economic and environmental
implications of different management strategies.
While ABMs have been used to study natural
resource management problems, there have been
very few studies that have employed behavioural
models that are grounded in econometrically
200
Gao L., Durkin J. and Hailu A. (2010).
AN AGENT-BASED MODEL FOR RECREATIONAL FISHING MANAGEMENT EVALUATION IN A CORAL REEF ENVIRONMENT.
In Proceedings of the 2nd International Conference on Agents and Artificial Intelligence - Agents, pages 200-205
DOI: 10.5220/0002729702000205
Copyright
c
SciTePress

estimated choice models. The trophic-dynamic
model is used to simulate the interactions among
algae, corals, herbivorous and piscivorous fish in the
recreational angler’s chosen site. This model is
incorporated into the ABM-RUM framework as a
means of attributing the environmental changes to
the recreational fishing site.
The paper is organized as follows. The next
section describes the structure of the ABM-RUM
model. This is followed by a description of strategy
evaluation for recreational fishing management. An
application case study for the Ningaloo marine park
and preliminary simulation results for recreational
management strategy evaluation are presented in
Section 4. Finally, the paper concludes in Section 5.
2 AN INTEGRATED MODEL OF A
CORAL REEF FISHING
The proposed ABM-RUM model has six sub-
models: trip demand model, site choice model, trip
timing model, trip length model, catch rate model,
and trophic-dynamic model.
Trip Demand Model
How many trips in a year?
Site Choice Model
Which site to go?
Trip Timing Model
When to go?
Trip Length Model
How long is a trip?
Simulation flow
Recreational
Angler i
Recreational
Fishing Site j
Catch Rate Model
How many fishes caught?
Trophic-Dynamic
Model
Management
Strategies
Trip Demand Model
How many trips in a year?
Site Choice Model
Which site to go?
Trip Timing Model
When to go?
Trip Length Model
How long is a trip?
Simulation flow
Recreational
Angler i
Recreational
Fishing Site j
Catch Rate Model
How many fishes caught?
Trophic-Dynamic
Model
Management
Strategies
Figure 1: The framework of the ABM-RUM model.
Recreational anglers and angling sites are all
modeled as agents. A recreational angler has
demographic attributes (such as age, income,
education level, employed status, and so on) and
behaviors (such as choosing sites and catching fish).
A fishing site has environmental attributes (such as
coral cover, algal cover, herbivorous fish biomass,
piscivorous fish biomass, area, and coastal length)
and biophysical activities (interactions among
dynamical environmental attributes).
Five econometric models (trip demand model,
site choice model, trip timing model, trip length
model, and catch rate model) underpin the decision-
making and expected behaviors for a recreational
angler agent. These models predict, respectively, the
number of fishing trips an angler takes in a year, the
choice of recreational site in any one trip, the timing
of a trip in a year, the length or duration of a trip,
and the agent’s expected catch. All of these models
were estimated based on a national survey of
recreational fishers (Burton et al., 2008).
Trophic-dynamic model describes interactions
among four components in a reef environment,
namely, algal growth, coral cover as well as
herbivores and piscivores. The structure of the
model makes it possible to evaluate, at a reasonably
detailed level, the impact on the ecosystem.
2.1 Recreational Behaviour Models
Site choice, trip demand and catch rate models
Site choice models, or models that focus on discrete
alternatives in general, are usually formulated as
multinomial logit (McFadden, 1974) models. These
models describe the relationship between individual
and/or alternative characteristics and the predicted
probability of choice. In the case of fishing site
choice problems, for example, the interest is in
determining the probability,
ij
prob
, that an angler
agent
i chooses a recreational angling site j out of
M
sites. In a logit model, this probability takes the
form expressed in equation (1).
∑
=
=
M
k
U
U
ij
ik
ij
eeprob
1
(1)
where,
ij
U
is the utility that i derives from
recreating at site
j
and is dependent on the attributes
of the site and the individual as shown as follows.
∑
∑
⋅+⋅+⋅+=
k
kjk
f
ijffijcjij
SCRCostU
ββββ
(2)
where
j
β
is the base utility of a site,
ij
Cost is the cost
to
i of recreating at site
j
(mostly travel cost),
ijf
CR represents the number of fish of type f that
the individual expects to catch at the site, and
kj
S
stands for other site attributes that affect choice (e.g.
coastal length). The expected catch rates depend on
fish stocks and the angler’s experience. In our
model, these rates are generated by another
econometric model, the catch rate model, estimated
by (Burton et al., 2008). An angler’s propensity to
visit a site is negatively affected by cost but is
positively affected with increases in expected catch
rates and other desirable site attributes such as
coastal length.
The number of fishing trips taken by an angler
can vary. While it is possible to use a distribution
histogram based on empirical data to determine trip
numbers, a more general approach would be to link
AN AGENT-BASED MODEL FOR RECREATIONAL FISHING MANAGEMENT EVALUATION IN A CORAL REEF
ENVIRONMENT
201

trip demand to the utility of fishing trips (and thus to
site attributes) and to demographic variables that
measure the influence of employment, age and other
relevant influences on recreational behaviour. In trip
demand model used here, the actual number of trip
demanded is predicted as a Poisson distribution
(Burton et al., 2008). The logarithm of number of
trips in a year
i
λ
is specified as a function of the
expected maximum utility from a fishing trip,
known as “inclusive value” (IV) in the economics
literature, and a set of socio-economic characteristics
of the angler. In particular, the model is specified as
equation (3).
∑
+⋅+=
m
mmii
yIV
βββλ
10
ln
(3)
where
m
y
represents individual characteristics such
as age, education, employment, etc. IV is calculated
from site utility data as in equation (4).
5772.0)ln(
1
+=
∑
=
M
j
U
i
ij
eIV
(4)
Anglers’ expectations regarding fish catch
influence their site selection. These expected catch
rates are inputs into the trip demand model. Instead
of using historical rates, it is more useful to estimate
functions that predict rates depending on angler
characteristics and fish availability. Catch rates for
each type of fish is estimated using a negative
binomial model with the following specifications
(Burton et al., 2008).
Sstock
jkijk
⋅+⋅+=
βββλ
10
ln
(5)
where:
ijk
λ
is the expected catch per trip of angler
agent
i at site j of fish type k ;
jk
stock
is the
annual total stock at site
j of fish type k ; S is the
vector of the attributes (such as if it is man-made, if
it is a beach, and so on) of fishing site
j and the
demographic characteristics (such as age, education,
employment, experience, whether the fish was a
target species or not etc.) of angler
i that influence
expected catch.
Trip timing and length models
As in the case of trip numbers, one can use empirical
data to determine trip timing and trip length which
both vary between individuals. However, a more
versatile approach is to describe these as function of
day or calendar and person attributes. Geographic
location of the destination site also affects timing
and length of trip. For example, an angler who is
employed will be inclined to choose a weekend or
public holidays for a fishing trip. Further a trip to
cooler (warmer) regions is more likely in the
summer (winter) months than in the winter
(summer) months. We used actual survey data to
estimate a logit model for trip timing; this model is
used in the agent-based model to determine the dates
for fishing trips by angler agents.
Likewise, trip length prediction is done using a
Tobit model that we estimated. Tobit models link
explanatory variables to non-negative dependent
variables such as trip length. The explanatory
variables in our model include the socio-economic
characteristics of the individuals, the characteristics
of the day, and an interaction between the direction
of the trip and the time of the year. These two model
specifications and the results are based on (Gao and
Hailu, 2009).
2.2 Trophic-dynamic Model
To describe interactions among algae, corals, and
fish at a site, we use a a trophic-dynamic model
based on a modified Lotka-Volterra model of
predator-prey interactions and inter species
competition developed by Kramer (Kramer, 2008).
Since difference equations are most appropriate
when organisms have discrete, non-overlapping
generations (Allen, 2007), our trophic-dynamic
model converts the continuous model (Kramer,
2008) into difference equations using a numerical
scheme (Liu and Elaydi, 2001). Further, the fish
harvest variables in the trophic model are based on
the agent-based model for fishing site choice
described above. The difference equation version of
the model is presented below. The equations
describing the dynamics in algal growth, coral cover,
herbivorous fishes, and piscivorous fishes, are
shown in equations (6)-(9):
)]()()([)(1
)(])(1[
)1(
nHanC
K
ar
nA
K
r
h
nArh
nA
AH
A
ACA
A
A
A
AA
⋅+⋅
⋅
+⋅⋅+
⋅⋅+
=
+
φ
φ
(6)
where
)(nA
is algal cover as proportion of sea floor
at time step
n ,
A
r
is algal intrinsic rate of growth,
A
K is algal carrying capacity as cover,
AC
a is a
competition coefficient of coral on algae, and
AH
a
is an interaction coefficient of herbivores on algae.
]
)(
)(
)([)(1
)(])(1[
)1(
SlopeSlope
Slope
C
CAC
C
C
C
CC
HAnA
nA
K
ar
nC
K
r
h
nCrh
nC
+
⋅
⋅
+⋅⋅+
⋅⋅+
=
+
φ
φ
(7)
where
)(nC is coral cover as proportion of sea floor
at time
n ,
C
r is coral intrinsic rate of growth,
C
K is
ICAART 2010 - 2nd International Conference on Agents and Artificial Intelligence
202

coral carrying capacity,
CA
a is a competition
coefficient of algae on coral,
Slope and HA
are the
slope and a half saturation constant of Hill function.
∑
=
−
⋅+⋅−⋅+
⋅
⋅
−
=+
N
i
i
H
HPHAH
HHH
nCatch
nPanAah
nHah
nH
1
)(
)]()([)(1
)(])(1[
)1(
φ
φ
(8)
where
)(nH is herbivorous fish density at time step
n ,
HH
a is a density-dependent coefficient of
herbivorous fish,
HA
a
is an interaction coefficient of
algae on herbivorous fish,
HP
a is an interaction
coefficient of piscivores on herbivores,
N is the
number of recreational anglers, and
)(nCatch
i
H
is the
biomass of herbivorous fish caught by angler
i .
∑
=
−
⋅⋅−
⋅⋅−
=+
N
i
i
P
PHP
PPP
nCatch
nHah
nPah
nP
1
)(
)()(1
)(])(1[
)1(
φ
φ
(9)
where
)(nP is the piscivorous fish density at time
step
n ,
PP
a is the density-dependent coefficient of
piscivorous fish,
PH
a is an interaction coefficient of
herbivores on piscivores, and
)(nCatch
i
P
is the
biomass of piscivorous fishes caught by angler
i .
)(h
X
φ
(X is A, C, H, or P) in equations (6)-(9) is
a conversion function, and
X
r
r
e
h
X
1
)(
5.0
−
=
⋅
φ
(10)
where
X
r is an intrinsic rate of growth of X (algae,
coral, herbivourous fish, or piscivorous fish).
3 EVALUATION OF
MANAGEMENT STRATEGIES
There are a range of strategies at the disposal of
resource managers when it comes to regulating
recreational fishing. Commonly used measures
include: site closure, limits to fish harvest (or bag
limits), and exclusion of fish species from the
allowable list of target species. Resource managers
can also employ incentive-based strategies such as
license fees, which are used in many jurisdictions.
The model presented above can be used to
evaluate both the economic and reef ecosystem
impacts of management scenarios. The economic
impacts that should be central to decision making
are the economic surplus that anger’s derive from
fishing activities. These surpluses are not measured
by the values observed in market transactions that an
angler undertakes as part of a fishing trip or activity.
The true measure of the benefits of recreational
fishing is the satisfaction that the angler derives
from the activity over and above the costs incurred.
For the site choice model presented above, this
economic surplus measure is captured by the
inclusive sum and can be aggregated over anglers to
obtain the social impact of a management change.
The welfare impact of a management change can
be calculated as the difference between the inclusive
sums after and before the change in management, as
follows:
∑∑∑∑
⎟
⎟
⎟
⎠
⎞
⎜
⎜
⎜
⎝
⎛
⋅−
⎟
⎟
⎟
⎠
⎞
⎜
⎜
⎜
⎝
⎛
⋅=
==
N
i
M
j
U
N
i
M
j
U
ijij
eeW )ln(
1
)ln(
1
11
01
ββ
(11)
where
β
is the marginal utility of income from the
site choice model;
ij
U
1
and
ij
U
0
are the utility angler
i ’s derives from site j after and before the change,
respectively;
M
is the number of recreational sites
for fishing; and
N is the number of anglers.
The management strategies explored in this
paper are changes to site access rules and bag limits.
Changes to site access rules will have an impact on
site choice and the value of recreation. For the case
of site access changes, the model is capable of
generating site values specific for each angler. These
angler values can be aggregated to generate social
welfare changes resulting from access changes. Bag
limits specify the maximum number of fish that an
angler can harvest. Changes to these limits affect the
upper end of the expected catch rates and have no
direct effect on anglers who achieve lower catch
rates. If the new bag limits are binding, i.e. below
the angler’s expected catch rate, the changes imply a
loss in welfare for that individual. These changes in
benefits can be estimated from the model using the
welfare change formula in equation (11).
While management changes that limit the
opportunity for recreational fishing diminish
economic welfare among the anglers, the impact of
the changes on the coral reef and fish stocks is not
captured in the measures described above. There
could be benefits derived by other segments of
society who recreate in the marine environment and
are thus affected by fishing activity directly or
indirectly. Changes in the coral reef can also be
valued by non-users, and these non-use values are
not reflected in these welfare measures. However,
the model presented here makes it possible to
simulate the impact on fish stocks and coral reefs,
both of which are valued by society, and allows
resource managers to make better informed
decisions in resource allocation. Currently, resource
management decisions are made with very little
knowledge of the extent of recreational fishing
AN AGENT-BASED MODEL FOR RECREATIONAL FISHING MANAGEMENT EVALUATION IN A CORAL REEF
ENVIRONMENT
203
values and the impact of fishing or management
changes on marine resources and habitats (Westera
et al., 2003). In Western Australia, the formulation
of management strategies for commercial and
recreational users is a difficult task due to the lack of
definite information on abundance of many fish
stocks and environment variations (Fisheries, 2000).
4 A CASE STUDY
Situated on the North West Cape of Western
Australia, Ningaloo Reef is one of a declining
number of relatively pristine major coral reefs in the
world. Much of the 200-km long reef system falls
within the Ningaloo Marine Park. The reef supports
a wide diversity of marine species that attracts the
recreational tourist and the reef fish are very popular
with anglers (Wood and Glasson, 2005). Three
recreational sites (Mandu, Osprey and Maud)
located in the park have been chosen as case study
sites for the modeling results presented in this paper.
Below we report results from a simulation of
recreational angling activities and their interactions
with recreational environment for a period of 16
years, from 2010 to 2025. First, we have a baseline
or ‘business-as-usual’ strategy where there is no
management change. Then, the following two
separate management strategies are evaluated and
compared with outcomes under the baseline
strategy:
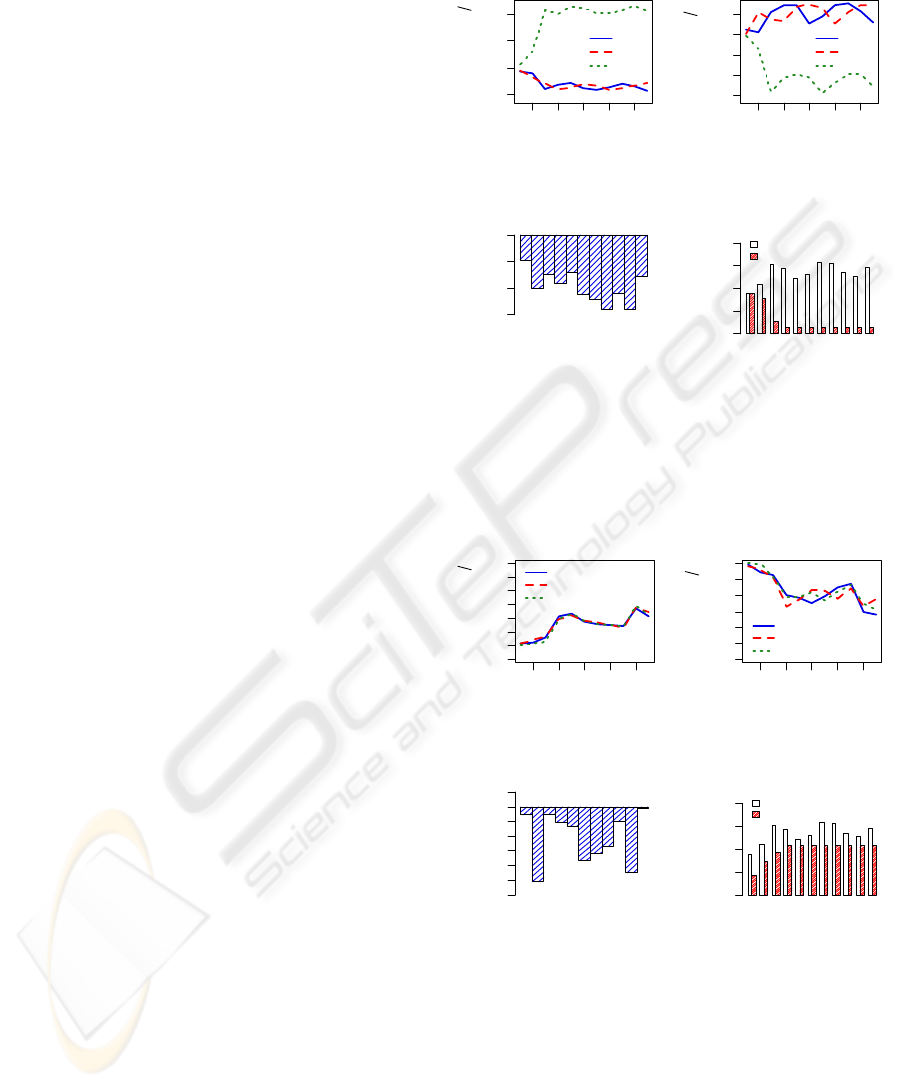
(1) The number of accessible sites is taken from
three to two with Osprey closing in 2015. The
effects of this change are shown in Figures 2(a)-(d).
(2) The bag limits in three sites are all reduced to
25% from 2015. The effects of these changes are
shown in Figures 3(a)-(d).
The closure of a site reduces aggregate welfare.
This welfare loss is matched by continuous increases
in piscivores fish population in the closed site during
the first three years after closure. The additional fish
biomass gains per dollar lost in welfare change leads
to about 0.01kg of piscivores biomass increments, as
shown in Figure 2(a). However, these beneficial
environmental effects (rises in piscivore
populations) lead to lower herbivore populations,
which leads to higher algal but lower coral covers in
the site. Coral covers are major attraction for non-
fishing recreationists. These cover changes are likely
to have negative effects on recreational activities
such as snorkeling, swimming, etc. However, as
shown in Figure 2(b), the changes in coral cover are
minimal. However, closing the target site, Osprey,
brings opposite effects on the other two sites. One
dollar
lost in welfare change leads to about 0.003kg
(a)
Time (year)
Δ
(
Piscivorous fish biomass
)
Δ
(
Welfare
)
2016 2020 2024
-0.005 0.005
Mandu
Maud
Osprey
(b)
Time (year)
Δ
(
Coral cover percentage
)
Δ
(
Welfare
)
2016 2020 2024
-1.5e-06 0.0e+00
Mandu
Maud
Osprey
2015 2018 2021 2024
(
c
)
Time (year)
Δ
(
Number of trips
)
-600 -200 0
2015 2018 2021 2024
(
d
)
Time (year)
Average catches (weight) per trip
02468
Baseline
Site Closure
Figure 2: Piscivorous fish biomass and coral covers gains
with changes in welfare, changes in number of trips, and
average catches per trip after closing Osprey.
(a)
Time (year)
Δ(Piscivorous fish biomass) Δ(Welfare)
2016 2020 2024
-0.5 0.5 1.5 2.5
Mandu
Maud
Osprey
(b)
Time (year)
Δ(Coral cover percentage) Δ(Welfare)
2016 2020 2024
-0.00030 -0.00010
Mandu
Maud
Osprey
2015 2018 2021 2024
(
c
)
Time (year)
Δ(Number of trips)
-300 -150 -50 50
2015 2018 2021 2024
(
d
)
Time (year)
Average Catches (weight) per trip
02468
Baseline
Bag Limit
Figure 3: Piscivorous fish biomass and coral covers gains
with changes in welfare, changes in number of trips, and
average catches per trip after reducing bag limits.
of piscivores biomass reduction and almost no
change in coral covers in Mandu or Maud. Although
the above biophysical effects and changes in welfare
are not significant, after site closure, the average
number of trips for all anglers decrease by 400 per
year, 2.5% reduction per year. Average real catches
ICAART 2010 - 2nd International Conference on Agents and Artificial Intelligence
204

(weight) per trip goes down from 6 kilograms to
0.55 kilograms after closing Osprey.
Bag limit changes have more significant
biophysical effects compared to the effects obtained
with site closure. Piscivorous fish biomass gains per
dollar lost for all sites increase during the first four
years, and then vibrate at about 1 kilogram per dollar.
Correspondingly, coral covers losses with changes in
welfare decrease during the first four years, and then
vibrate at about 0.01% per dollar. In addition, after
imposing a reduction of 75% to bag limits, the
number of trips to all sites reduces by about 7% per
year, and average real catches (weight) per trip
reduces from 6 kilograms to 4.6 kilograms.
The simulation experiments conducted here are
by no means comprehensive. They are presented to
demonstrate the potential of the model. Further
revisions to this study are under way and there will
be a more comprehensive assessment of alternative
management strategies. However, the results
presented here do show that the effectiveness of
different management strategies could be very
different. For example, a naive look at a three-fourth
reduction in the bag limit would lead one to expect
substantial changes in catch rate per trip. What the
results above show is that the effects of the closure
were much more dramatic in this particular
simulation. With better modeling tools, resource
managers would be able to evaluate alternatives and
choose strategies that are effective but also minimize
impact less on recreational values.
5 CONCLUSIONS
This paper has provided the structure of our
integrated model for simulating recreational fishing
and reef ecosystem dynamics. The management of
coral reefs such as Ningaloo and the Great Barrier
Reefs in Australia is always the subject of
controversy. The value of models that allow
resource managers to evaluate both the welfare and
biophysical impacts of proposed or potential
changes in management cannot be overstated.
Some preliminary results from a simulation of
two management changes show how the
effectiveness of strategies and the distribution of
their impacts can be very different from what one
would expect without the benefit of an integrated
model. Single site closure had substantial effect on
real catches per trip compared to fishing bag limits
that appear drastic and are likely to be resisted more
by anglers. These simulations are presented as a
demonstration of the benefits of integrated resource
use modeling and not to generate information
regarding implications of policy changes.
ACKNOWLEDGEMENTS
Research reported here has been funded through the
Ningaloo Collaboration Cluster, CSIRO Wealth
from Oceans Flagship Program.
REFERENCES
Allen, L. J. S. (2007). An Introduction to Mathematical
Biology,
New Jersey, Prentice Hall.
Burton, M. P., Raguragavan, J. & Hailu, A. (2008). State-
wide recreational fishing site choice study (technical
report). School of Agricultural and Resource
Economics, University of Western Australia.
Fisheries, W. A. (2000). Protecting and Sharing Western
Australia's Coastal Fish Resources.
Fisheries
Management Paper No. 135
.
Gao, L. & Hailu, A. (2009). Modelling Recreational Trip
Timing and Length.
University of Western Australia,
School of Agricultural and Resource Economics,
Technical Report of Ningaloo Cluster Project 4
.
Jennings, N. R. (2001). An agent-based approach for
building complex software systems.
Communications
of the ACM,
44, 35-41.
Kramer, D. B. (2008). Adaptive Harvesting in a Multiple-
Species Coral-Reef Food Web.
Ecology and Society,
13, 17.
Liu, P. & Elaydi, S. N. (2001). Discrete competitive and
cooperative models of Lotka-Volterra type.
Journal of
Computational Analysis and Applications,
3, 53-73.
Mcfadden, D. (1974). The measurement of urban travel
demand.
Journal of Public Economics, 3, 303-328.
Schuhmann, P. & Schwabe, K. A. (2004). An analysis of
congestion measures and heterogeneous angler
preferences in a random utility model of recreational
fishing.
Environmental & Resource Economics, 27,
429-450.
Westera, M., Lavery, P. & Hyndes, G. (2003). Differences
in recreationally targeted fishes between protected and
fished areas of a coral reef marine park.
Journal of
Experimental Marine Biology & Ecology,
294, 145-
168.
Wood, D. & Glasson, J. (2005). Giving the Environment a
Voice: the Transformation Potential of Valuing
Tourism in Sensitive Environments: The Case of
Ningaloo Coastal Region Western Australia.
Planning
Practice and Research,
20, 391-407.
AN AGENT-BASED MODEL FOR RECREATIONAL FISHING MANAGEMENT EVALUATION IN A CORAL REEF
ENVIRONMENT
205
