
EMOTIONAL FACIAL EXPRESSION RECOGNITION FROM TWO
DIFFERENT FEATURE DOMAINS
Jonghwa Kim and Frank Jung
Institute of Computer Science, University of Augsburg, Germany
Keywords:
Emotion recognition, Facial expression, Gabor wavelets, Human-computer interaction, Affective computing.
Abstract:
There has been a significant amount of work on automatic facial expression recognition towards realizing
affective interfaces in human-computer interaction (HCI). However, most previous works are based on specific
users and dataset-specific methods and therefore the results should be strongly dependent on their lab settings.
This makes it difficult to attain a generalized recognition system for different applications. In this paper, we
present efficiency analysis results of two feature domains, Gabor wavelet-based feature space and geometric
position-based feature space, by applying them to two facial expression datasets that are generated in quite
different environmental settings.
1 INTRODUCTION
Recently numerous studies on automatic emotion
recognition using audiovisual (facial expression,
voice, speech and gestures) and physiological (elec-
trocardiogram, skin conductivity, respiration, etc.)
channels of emotion expression have been reported
(Cowie et al., 2001) (Kim and Andr
´
e, 2008). Overall,
most approaches achieved average recognition rates
of over 70%, which seems to be acceptable for some
restricted applications. However, it is true that the
recognition rates should be strongly dependent on the
datasets they used and the subjects. Moreover, most
of the recognition results were achieved for specific
users in specific contexts with the ”forced” emotional
states. All these make it difficult to attain a gener-
alized recognition system for different applications.
Particularly, due to the lack of a standard benchmark
of emotional dataset and recognition method, it is al-
most impossible to objectively compare the efficiency
of feature domains and the performance of classifica-
tion algorithms.
For a comprehensive survey of previous works
on the recognition of facial expression we refer the
reader to (Fasel and Luettin, 2003) (Jain and Li,
2005). Generally the feature-based methods for facial
emotion recognition in the literature can be divided
into two general ideas with respect to feature coding
spaces, i.e. transform-based feature coding by using
such as Gabor wavelets (Zhan et al., 2007) and prin-
ciple component analysis (PCA) and geometry-based
distance coding by using extended fiducial points de-
fined in the facial action coding system (FACS) (Pan-
tic and Rothkrantz, 2004), for example. In the FACS,
almost every visible movement of facial muscles is
assigned to Action Units (AU) and a fine grained lan-
guage is given to allow a human annotator the descrip-
tion of facial behavior.
In this paper, we investigate the efficiency of two
well-known feature domains, i.e. Gabor wavelet-
based feature set and geometric position-based fea-
ture set, by using two emotional static image datasets
that are generated in quite different environmental set-
tings. Throughout the paper, we try to derive a spe-
cific characteristic of the feature domains, which can
be generally accepted for designing an universal fa-
cial emotion recognition system.
2 USED DATASETS
Two different datasets are used for our experiment.
The first one is the Japanese Female Facial Expression
Database (JAFFE) (Lyons et al., 1998) consisting of
213 images of ten different subjects. The amount of
samples is roughly equal for each of the seven emo-
tion classes, i.e. neutral, happiness, sadness, surprise,
anger, disgust and fear. The second dataset is the
Facial Expressions and Emotion Database (Wallhoff,
2006) (FEEDTUM) of the Face and Gesture Recog-
nition Research Network (FG-NET). Differently from
631
Kim J. and Jung F. (2010).
EMOTIONAL FACIAL EXPRESSION RECOGNITION FROM TWO DIFFERENT FEATURE DOMAINS.
In Proceedings of the 2nd International Conference on Agents and Artificial Intelligence - Artificial Intelligence, pages 631-634
DOI: 10.5220/0002737306310634
Copyright
c
SciTePress
the JAFFE which is a set of photo images, FEEDTUM
is generated by collecting images taken out of video
streams and contains a bigger amount of images avail-
able, recorded in three sessions for each of the 18
subjects and each of the seven emotion classes. For
testing, one image of each session has been selected
picturing the subject in the apex phase of the facial
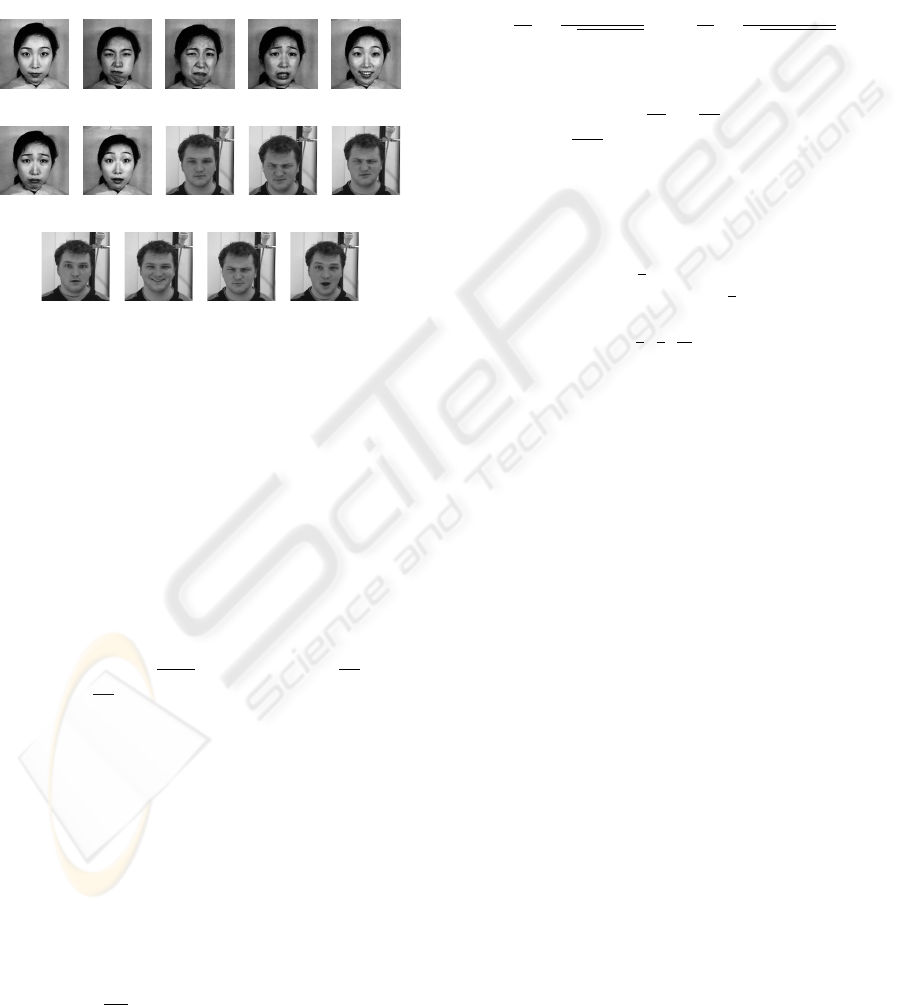
deformation. Figure 1 shows some example images
sampled from both datasets corresponding the seven
emotional expressions.
(a) Neutral (b) Anger (c) Disgust (d) Fear (e) Happy
(f) Sad (g) Surprise (h) Neutral (i) Anger (j) Disgust
(k) Fear (l) Happy (m) Sad (n) Surprise
Figure 1: Examples of facial expression images. (a)-(g) are
sampled from the JAFFE and (h)-(n) from the FEEDTUM.
3 METHODOLOGY
3.1 Feature Extraction in Gabor-filter
Domain
A two-dimensional Gabor wavelet is a plane wave
that is enveloped by a Gaussian, i.e.
Ψ(k, x) =
k
2
σ
2
e
−
k
2
x
2
2σ
2
e
(ikx)
−e
−
σ
2
2
(1)
where k is the frequency of the plane wave, and σ
is the relative width of a Gaussian envelope function.
Field (Field, 1987) pointed out that most cells in the
visual cortex of mammals come in pairs with even and
odd symmetry, similar to the real and imaginary part
of Gabor wavelets. Following this we used Gabor
filter with the elliptic Gaussian which approximates
even more exactly the neurons in the visual cortex,
Ψ(x, y) =
αβ
π
e
−
α
2
x
02
+ β
2
y
02
e
j2π f
0
x
0
(2)
x
0
= xcosθ +y sin θ (3)
y
0
= −xsinθ +y cos θ (4)
where f
0
is the frequency, θ the orientation and α and
β the scaling factors for the elliptic Gaussian enve-
lope. The orientation of the Gaussian rotates together
with the orientation of the filter. To get the same num-
ber of waves over all scales the ratio between the fre-
quency and the Gaussian is fixed. The ratios that ap-
proximate the cells in the visual cortex are:
γ =
f
0
α
=
1
√
0.9025π
, η =
f
0
β
=
1
√
0.58695π
(5)
The normalized filter in the spatial domain is then:
Ψ(x, y) =
f
2
0
πγη
e
−
f
2
0
γ
2
x
02
+
f
2
0
η
2
y
02
e
j2π f
0
x
0
(6)
For the design of Gabor filter bank in our exper-
iment, we used the following parameters: the rela-
tive width σ has been set to π and six orientations and
three spatial frequencies have been used. The orien-
tations φ range from
π
6
to π in an equidistant man-
ner. The maximal frequency is
π
4
and the different
scales are separated by the factor two which results in
three scales with k =
π
4
,
π
8
,
π
16
. For normalization the
interocular distance is 60 pixels and if the three-point-
method is employed the distance between mouth mid-
dle point and the straight line between the eye centers
is as well 60 pixels.
3.1.1 Points of Interest
Since we apply the Gabor filter to each fiducial point,
instead of whole image, it is necessary to identify the
points of interest (POI) that are relevant to affective
facial expressions. For this, focusing on wrinkles and
bulges is a rather poor choice. This makes sense when
one considers that the appearance and visibility of
such are highly influenced by illumination, age and
even contexts like tiredness of an individual. They
can be altered by make-up, even completely covered
by facial hair and are highly dependent on the indi-
vidual. Considering the issues above and the com-
mon evidence that the mouth area holds most infor-
mation related to facial expression recognition, fol-
lowed by eyes and then eyebrows, we identified 26
POIs as shown in figure 2, where the points 14, 15
and 23-25 are for image normalization, not for filter-
ing purposes.
3.1.2 Normalization and Feature Calculation
Images are converted to gray scale in order to avoid
problems with filtering in different planes and appli-
cation of feature reduction algorithms. It is clear that
ICAART 2010 - 2nd International Conference on Agents and Artificial Intelligence
632

Figure 2: Left: the 26 points of interest identified in a
frontal face. Right: considered minimal set of distances.
the Gabor filters are anisotropic and estimating of fre-
quency parameter depends on the face sizes in pix-
els. Since the images in the datasets are generated
by using single camera positioned at front of face,
a pertinent normalization has to be conducted to ad-
dress in-plane rotations and face size. Two methods
based on a three-point-normalization via transforma-
tion matrices are employed. The first one uses three
fixed points, where two are located in the eye centers
and the third in the middle of the mouth determined
by the cutting lines through opposing mouth points. It
maps simply the points onto three predefined points to
determine transform matrix. The second method pre-
serves the relation between the inter-ocular distance
and the perpendicular line distance of the mouth mid-
dle point to that line. Therefore the ”natural appear-
ance” of the face is more preserved, since the face
shape is respected.
After the normalization, the Gabor filters are ap-
plied to the sample at each POI. As a result, we ob-
tained feature vector containing 18 complex coeffi-
cients for each POI and reduced the size of the fea-
ture vector by considering only magnitude of real and
imaginary parts.
3.2 Feature Extraction in Geometric
Domain
To provide a unit system for the intra-face measure-
ments that are comparable across individuals, we need
certain anchor points that have to lie in areas with
sufficient textural information (for easy detection), be
present in a consistent manner across different sam-
ples/models, be at locations that do not move due
to facial deformations and be not located at points
with transient information (e.g. wrinkles, bulges).
Among different candidates illustrated in the Figure
2 the outer points of the left and the right eye turned
out to be the best options. The points at the temples
would be a good choice, too, but can vanish due to
even small out-of-plane rotations or be hard to detect
because of hair. All measured distances will be di-
vided by this span for conversion into the unit system.
As facial landmarks, we used a subset of the points in
the Figure 2, except for point 6, 8, 10, 12, 16-18 and
23-25 which are anchor points.
We calculated geometry-based features by mea-
suring distances of anchor-to-landmark, landmark-to-
landmark points and dividing them by the base unit.
Furthermore, div- and med-features are obtained by
considering two intersecting lines between the corre-
sponding points, for example, the lines of point 20
to 22 and 19 to 21. We then calculated the ratio
and median values based on the lines. Consequently,
these features represent the change of the eye- or
mouth-form. Figure 2 right shows a possible minimal
set of distances. Light gray lines are the spans be-
tween anchor-to-landmark and the dark lines indicate
distances that were used to calculate div- and med-
features.
3.3 Classification
We tested the recognition efficiency of the two feature
sets by employing two well-known statistical classi-
fiers, k-nearest neighbor (k-NN) and support vector
machines (SVM). For k-NN, Euclidean distance mea-
sure is used with k = 3. We used the C-SVM (RBF
kernel) with a fixed γ and high cost factor c by build-
ing binary classifiers in terms of one-vs-one as well
as one-vs-all.
4 RESULTS
Figure 3 illustrates the Fisher projection of the feature
sets in order to get an preview of the distinguishability
according to the seven expression classes. The distri-
butions in the figures show that the class related sam-
ple density for the Gabor approach seems satisfying,
even though some classes (e.g. disgust and anger) in-
tersect each other.
Table 1 and 2 summarize the recognition results.
Through all tests it turned out that the JAFFE dataset
could be easily classified, compared to the FEED-
TUM dataset, regardless which feature set is used.
This should be due to the high consistency of the sam-
ples and the feature extraction favorable setup of the
JAFFE dataset, while the slightly more ”real world”
oriented FEEDTUM samples allowed therefore infe-
rior results.
EMOTIONAL FACIAL EXPRESSION RECOGNITION FROM TWO DIFFERENT FEATURE DOMAINS
633
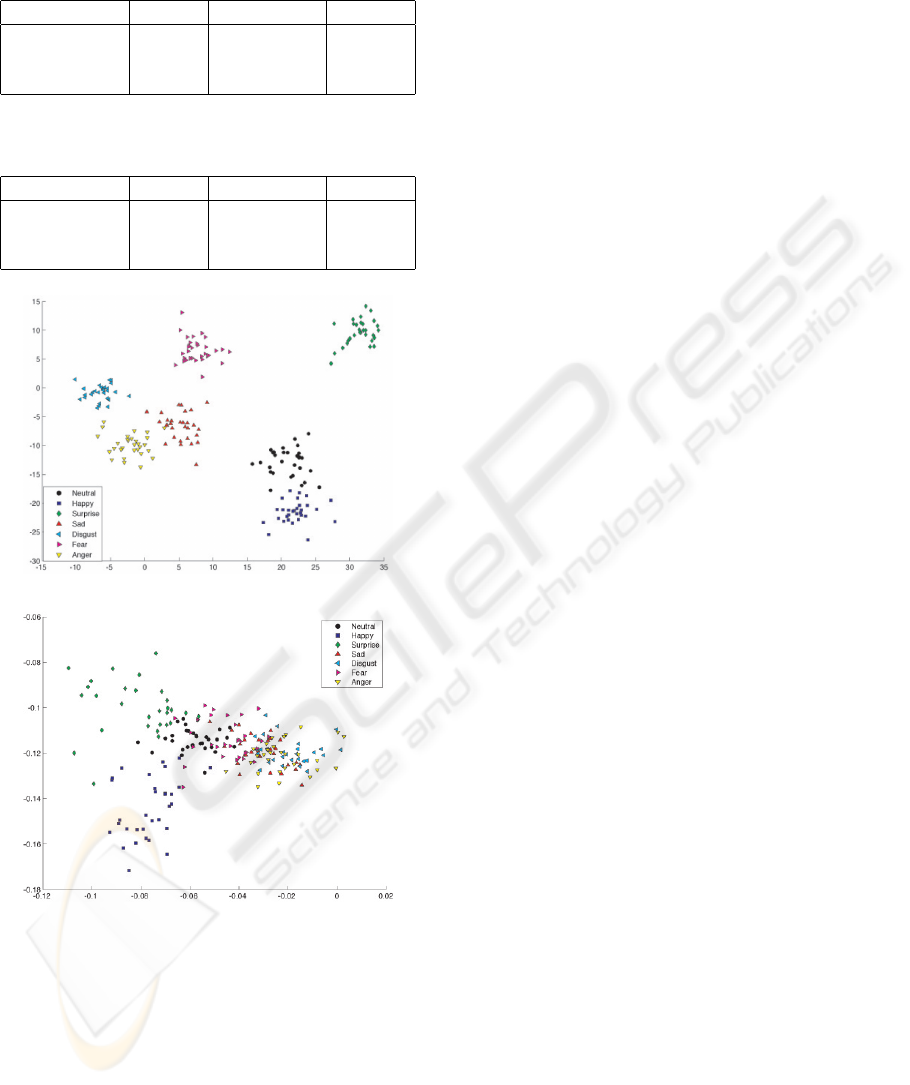
Table 1: Recognition results (accuracy rates in %) by using
the Gabor-filter features. Validation method: leave-one-out.
JAFFE FEEDTUM MIXED
3-NN 87.79 51.78 50.44
C-SVM 1-1 95.31 78.22 65.56
C-SVM 1-all 96.24 80.22 64.67
Table 2: Recognition results (accuracy rates in %) by using
the distance features. Validation method: leave-one-out.
JAFFE FEEDTUM MIXED
3-NN 77.46 35.02 55.78
C-SVM 1-1 79.81 55.70 62.89
C-SVM 1-all 78.87 48.10 54.67
(a)
(b)
Figure 3: Distribution of the Gabor-filter features (a) and
the distance features (b) by using Fisher projection. Dataset:
JAFFE.
5 CONCLUSIONS
In this paper we developed two feature domains, Ga-
bor wavelet-based and geometry-based feature space,
and investigated the efficiency of the feature sets by
applying them to two facial expression image datasets
that are quite differently characterized due to distinct
recording settings. SVM and k-NN are employed to
classify the seven expression classes, i.e. neutral, hap-
piness, sadness, surprise, anger, disgust and fear, by
using the obtained feature vectors.
The results showed that the Gabor filter approach
outperformed the distance approach in all experi-
ments. On the other hand, we note that the distance
approach provided relatively consistent performance
for the mixed dataset, compared to Gabor-filter ap-
proach. This finding should be considered for design-
ing a facial expression recognition system, because it
is one of well-known issues that most systems suf-
fer from low accuracy of subject-independent recog-
nition.
ACKNOWLEDGEMENTS
The work described in this paper is partially funded
by the EU under research grant IST-34800-CALLAS
and ICT-216270-METABO.
REFERENCES
Cowie, R., Douglas-Cowie, E., Tsapatsoulis, N., Votsis,
G., Kollias, S., Fellenz, W., and Taylor, J. G. (2001).
Emotion recognition in human-computer interaction.
IEEE Signal Processing Mag., 18:32–80.
Fasel, B. and Luettin, J. (2003). Automatic facial expression
analysis: A survey. Pattern Recognition, 36(1):259–
275.
Field, D. J. (1987). Relations between the statistics of natu-
ral images and the response properties of cortical cells.
Journal of the Optical Society of America A, 4:2379–
2394.
Jain, A. K. and Li, S. Z. (2005). Handbook of Face Recog-
nition. Springer-Verlag New York, Inc., Secaucus, NJ,
USA.
Kim, J. and Andr
´
e, E. (2008). Emotion recognition based on
physiological changes in music listening. IEEE Trans.
Pattern Anal. Mach. Intell., 30(12):2067–2083.
Lyons, M., Akamatsu, S., Kamachi, M., and Gyoba,
J. (1998). Coding facial expressions with gabor
wavelets. In FG ’98: Proceedings of the 3rd. Inter-
national Conference on Face & Gesture Recognition,
pages 200–205, Washington, DC, USA.
Pantic, M. and Rothkrantz, L. (2004). Facial Action Recog-
nition for Facial Expression Analysis from Static Face
Images. IEEE Transactions on Systems, Man, and Cy-
bernetics - Part B: Cybernetics, 34(3):1449–1461.
Wallhoff, F. (2006). Facial expressions and emotion
database. Universitaet Muenchen.
Zhan, C., Li, W., Safaei, F., and Ogunbona, P. (2007). Face
to face communications in multiplayer online games:
A real-time system. In HCI (4), pages 401–410.
ICAART 2010 - 2nd International Conference on Agents and Artificial Intelligence
634
