
DETECTION OF MICRO ANEURYSMS USING MULTIPLE
CLASSIFIERS AND HIDDEN MARKOV MODELS
Jonathan Goh, Lilian Tang, Lutfiah Al turk
*
, Christina Vrikki and George Saleh**
Department of Computing, University of Surrey, Surrey, GU2 7XH, U.K.
*Department of Statistics, King Abdulaziz University, Kingdom of Saudi Arabia
**Moorfields Eye Hospital NHS Foundation Trust, 162 City Road, London, EC1V 2PD, U.K.
Keywords: Diabetic Retinopathy screening, Micro aneurysms, Ensembles, Multiple classifiers, Contextual reasoning,
Hidden Markov Models.
Abstract: Diabetic retinopathy is a complication of diabetes and early detection is essential for effective treatment. In
this paper, a novel technique for the detection of micro aneurysms is presented. Various features are
extracted using image processing techniques and then fed through multiple classifiers for initial
classification of candidate micro aneurysms. Hidden Markov models are then used to perform contextual
analysis to recognise true micro aneurysms.
1 INTRODUCTION
Diabetic retinopathy (DR) is an eye disease that has
been one of the major causes of blindness in the
world (W.H.O, 2005) and early detection of the
disease through screening can prevent blindness and
allow for maintenance of good vision. A typical
screening process involves the acquisition of
patients’ retinal images followed by a manual
examination of each individual image by medical
experts in order to identify any signs of
deterioration. This process is known to be
inefficient, time consuming and expensive.
Micro aneurysms are one of the first visible
signs of DR and it is known that quantities of this
clinical sign can help diagnose the progression of the
disease. Micro aneurysms are swelling of the
capillaries that are caused by the weakening of the
vessel walls due to high sugar levels in diabetes and
eventually leak to produce exudates. In retina
images, micro aneurysms appear as small reddish
dots with similar intensity as haemorrhages and
blood vessels. This particular sign is an important
early indicator of the disease and can contribute to
helping ophthalmologists identify effective
treatment for the patient at an early stage. The
motivation of this work is to develop a technique
that is able to detect micro aneurysms as part of a
diagnosis system, so that medical experts are able to
diagnose the stage of the disease with ease, saving
screening time, manpower and cost.
In order to detect micro aneurysms, the
technique employed must also be tolerant to the
appearance of fine blood vessels that appear on or
near the vicinity of the main blood vessels.
Furthermore, the technique must also be scalable
over a large volume of images. In the literature, a
few image processing techniques have been applied
in Walter & Klein (2000), Cree et al. (1996),
Niemeijer et al. (2005), Sinthanayothin et al. (2002)
to detect micro aneurysms. However, some of these
techniques (Walter & Klein, 2000; Cree et al., 1996)
require the blood vessels to be removed prior to
micro aneurysm detection. This results in true micro
aneurysms that are near or on the blood vessels to be
removed as well. Furthermore, these techniques use
only a set of rules to identify true micro aneurysms,
which have not been proved to be tolerant to errors
over a large data set.
Classification algorithms have been utilised in
Niemeijer et al. (2005), Sinthanayothin et al. (2002)
to detect micro aneurysms. Image processing
techniques are first applied to extract features
followed by recognition through a classifier, but the
single classifier used is unable to ensure consistent
accuracy over a large volume of diverse images.
In our work, an algorithm has been developed
to detect micro aneurysms. The first stage of the
algorithm aims to divide the image into smaller sub
images, followed by image processing techniques
prior to feature extraction. Due to uneven
269
Goh J., Tang L., Al turk L., Vrikki C. and Saleh G. (2010).
DETECTION OF MICRO ANEURYSMS USING MULTIPLE CLASSIFIERS AND HIDDEN MARKOV MODELS.
In Proceedings of the Third International Conference on Health Informatics, pages 269-274
DOI: 10.5220/0002738302690274
Copyright
c
SciTePress
illumination, the image is firstly partitioned into
32x32 pixel sub images to minimise this effect. In
the second stage, multiple classifiers are used to
classify the candidate micro aneurysms. Contextual
analysis is then performed using Hidden Markov
Models (HMM) to further analyse the regions. This
algorithm has been evaluated over a large-scale
database taken from various sources.
This paper is organised as follows. In Section
II, we present the techniques used in the proposed
algorithm. Experimental results are given in Section
III. Finally, we summarise our work in Section IV.
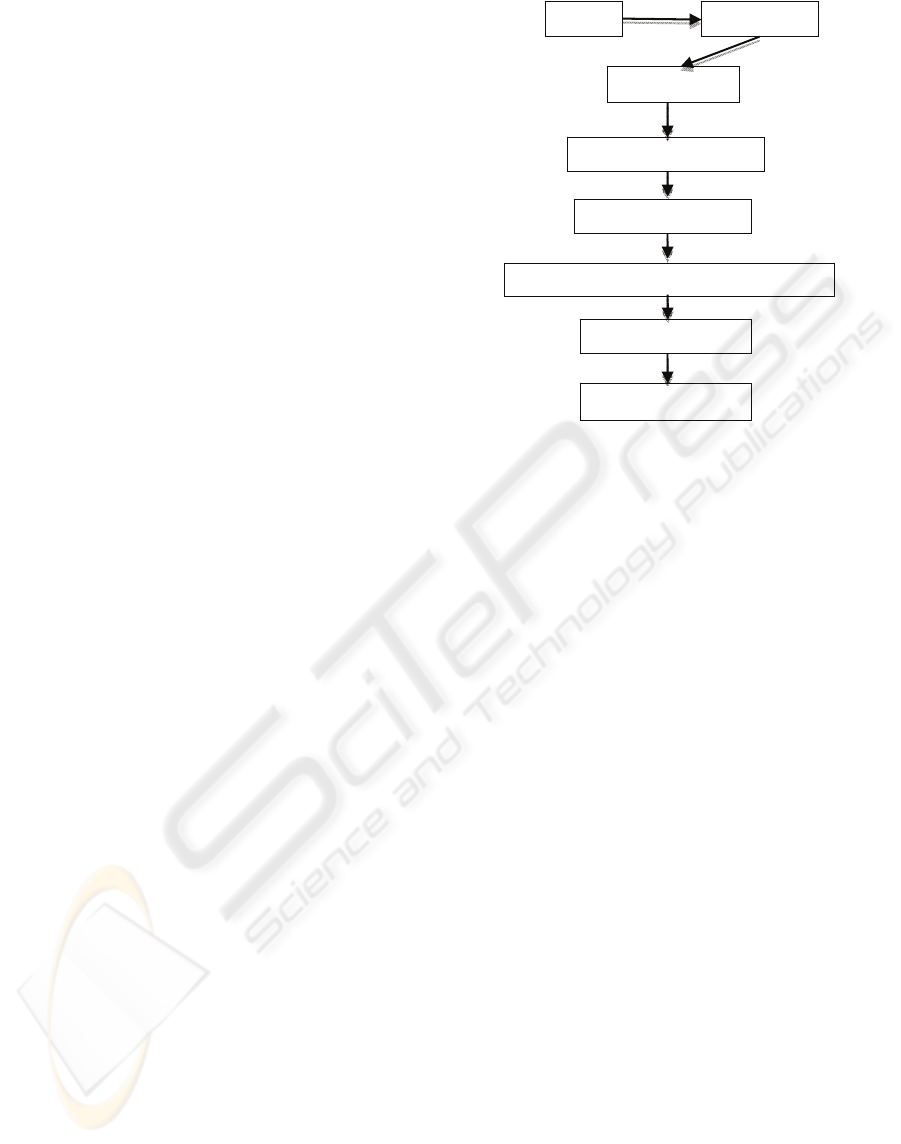
2 PROPOSED FRAMEWORK
In this section, we describe the proposed framework
to detect micro aneurysms. One of the main
obstacles is the variability in the retina image, such
as the degree of pigmentation of epithelium and
choroid in the eye, size of the pupil, illumination,
disease, image settings (which varies even with the
same equipment), patients’ ethnic origin, and other
variants. Another challenge is to identify micro
aneurysms that are near other anatomical structures.
For example, there may be instances where micro
aneurysms appear near blood vessels suggesting that
recognising of such features using classification and
contextual analysis cannot be treated in isolation.
Therefore, an integral approach has been proposed
as illustrated in Figure 1. Detailed explanations of
each component are given in the following sections.
2.1 Image Segmentation
As micro aneurysms appear with low contrast in
retina images, a contrast enhancement algorithm
(Sagar et al, 2007) is first carried out as a pre-
processing stage to enhance the overall contrast.
This is applied to the green component of the image
as blood vessels and other dark lesions appear more
distinct in the green component of a RGB image.
Due to the variability among images, it is impossible
to use a global image segmentation technique to
detect candidate micro aneurysms region while
maintaining consistent accuracy. Also, as micro
aneurysms may appear near or on the blood vessels,
we chose to preserve the structure of the blood
vessels during initial image segmentation.
In order to obtain as many candidate micro
aneurysms regions as possible, we choose to use a
sliding window technique where canny edge
detection is applied to each 32x32 pixel sub image to
detect all closed boundaries. Furthermore, to ensure
Figure 1: Proposed Framework.
candidate regions locating on the boundaries
between two sub images are detected as well, the
edge detection is carried out on overlapping sub
images with 16 pixels width intervals.
Using this technique, all candidate regions are
detected and reduced to seeds for the watershed
segmentation algorithm. Previous work by Spencer
et al., (1996) used region grow algorithm to grow the
candidate regions to their actual size. However,
through experimentations, we found that there is no
definite method to define the stopping criteria, hence
resulting in overgrown regions. This is especially so
when the micro aneurysms are near haemorrhages or
blood vessels, thus, giving erroneous results.
However, the watershed algorithm can
overcome this problem as it performs especially well
where two objects are touching and there exists few
gray levels between the two objects. This technique
is particular useful in our application as it allows
micro aneurysms that are close to blood vessels,
close to haemorrhages or even close to another
micro aneurysm to be segmented accurately. Once
the candidate micro aneurysms have been
segmented, features are extracted from these
regions.
2.2 Multiple Classifiers
Traditionally, to find the best classifier for a single
problem, a few classification schemes will be
developed using different sets of features, training
algorithms, etc. followed by experiments and
evaluation of the application to determine the best
classifier. However, while each of these classifiers
Image Sub Image
Edge Detection
Watershed Segmentation
Feature Extraction
Classification Usin
g
Multi
p
le Classifiers
Contextual Analysis
Analysed Image
HEALTHINF 2010 - International Conference on Health Informatics
270

may be successful to a certain extent, neither of
them would be a perfect solution to a given problem.
It has been reported by Kittler et al. (1998) that
although the best classifier would give the best
performance, samples that are misclassified by the
best classifier would not necessarily be misclassified
by the rest of the classifiers. The combination of
different classifiers may potentially offer
information that can be used to improve the
performance of the best classifier.
In our work, various features are used to
represent the same pattern and a hierarchical
structure has been developed as the classification
strategy as shown in figure 2.
Figure 2: Classification Strategy.
2.2.1 Ensembles of Neural Network
Ensembles of Multiple Layer Perceptron networks
are trained using the model in developed in our
group (Yu & Browne, 2007). Each ensemble is
trained using different training algorithms (Scaled
Conjugate Gradient algorithm, Quasi Newton
algorithm and the Conjugate algorithm), various
hidden units (multiples of 2 ranging from 2 to 20)
and different initial weights are randomly generated
from different ranges (-0.0 to 0.01, -0.001 to
0.001 and -0.0001 to 0.0001) resulting in a total of
90 classifiers for each ensemble. The results from
each of the individual classifiers are combined using
the median rule as the output of the ensemble. The
median rule is then used again to combine the output
of the two ensembles.
2.3 Feature Extraction
Many features could be used to represent micro
aneurysms. However, combining all these features
into a single classifier may cause a high dimension
problem and cause the classifier to hold redundant
information. Therefore, in our work, we separate
these features and represent micro aneurysms using
two different sets of features.
2.3.1 Feature Set 1: Shape and Colour
Features
The first set consisted of 8 different features. The
features can be separated into two groups, shape
features and colour features. The shape features are
used to restrict the shapes to circular objects in order
to eliminate elongated structures such as blood
vessels. The list of features for the first set is listed
in table 1.
Table 1: List of Features.
2.3.2 Feature Set 2: Intensity Distribution
Feature
The second set of features is based on the 3-D shape
of micro aneurysms. The micro aneurysms is
projected onto a three dimensional space using the
intensity values of the 10 by 10 region centred on
the micro aneurysm. As micro aneurysms are lower
in intensity values as compared to the background
area, it is necessary to inverse the values of the
region in such a way that it displays a ‘mole hill’ as
demonstrated in figure 3.
The angles from all locations of the region are then
calculated against the centroid of the region to
determine the steepness of the hill and the angle of
each location is stored in a 10 by 10 array. This
feature is useful in eliminating noise as the
1. Area of the region
2. Perimeter of the region
3. Circularity, c = p
2
/4π*Area
4. Bounding box, the size of the smallest
rectangle containing the object.
5. Extent, scalar that specifies the proportion
of the pixels in the bounding box that are
also in the region
6. Mean of region using pixels from contrast
enhanced image
7. Total energy level of region from contrast
enhanced image
8. Total energy level of background pixels
from contrast enhanced image
Classifier
1
based on
feature set1
Classifier
2
based on
feature set 1
……
Classifier
90
based on
feature set 1
-
Classifier
n
Classifier
1
based
on feature set2
Classifier
2
based
on feature set 2
……
Classifier
90
based
on feature set 2
BV Ensemble 1
Median Rule Median Rule
Median Rule
Output Label
DETECTION OF MICRO ANEURYSMS USING MULTIPLE CLASSIFIERS AND HIDDEN MARKOV MODELS
271

Figure 3: 3D plot of Micro Aneurysms.
region would be small and their angles would be
really steep. On the other hand, there is also a
distinct discrimination against blood vessels as the
angles would be rather constant throughout all
locations in the region.
Since the dimension of the input vector is 10 by
10 and is generally too large to train a neural
network with good generalisation, Principal
Component Analysis (PCA) is applied to reduce the
dimensions of the input space to the top 10
components, hence allowing for good generalisation
accuracy.
2.4 Hidden Markov Models
While using multiple classifiers can effectively deal
with diversity, the hierarchical multiple classifier
combination strategy also provides excellent
tolerance to classification errors. However,
misclassifications still occur due to either visually
similar symptoms or structures of the retina,
therefore, requiring a form of contextual analysis for
further analysis of these candidate regions. In our
work, we propose a stochastic modelling process as
a post processing step to perform this analysis.
Hidden Markov Models has been widely used
in speech recognition (Rabiner, 1989), hand writing
recognition (Parui et al., 2008) and in DNA
sequence analysis (Won et al., 2008). We apply a
similar idea of modelling the data and recognition to
detection micro aneurysms. In our work, we use it as
a means of contextual analysis by taking into
consideration the surroundings of the micro
aneurysms.
The idea is to train a few Hidden Markov
Models based on different kinds of sub images with
different context followed by sequence recognition.
2.4.1 Feature Extraction for HMM
Before development of the models, the outputs from
the multiple classifiers are analysed and based upon
the observations, the relevant models are then
created and listed in table 1.
Table 2: List of Models Created.
Observation Model
Micro aneurysms only MA
Micro aneurysms and Blood vessels MABV
Background BG
Various kinds of sub images are cropped into
15 by 15 sub images pixels from the image after the
contrast enhancement procedure. Following this,
each sub image is again divided into 9 5x5 pixel
smaller sub images as seen in figure 4 to be used as
observation sequences for the HMM.
Figure 4: States of Sub Image.
The Discrete Cosine Transform (DCT) is then
performed to obtain the features for each of the 5x5
pixel sub image. The DCT is used as it can represent
an image in terms of sum of sinusoids of varying
magnitude and frequencies, thus obtaining the most
important information in just a few coefficients.
Once the DCT has been applied for each
observation, the result from the DCT process for
each state is reshaped into a 25x1 column and used
as part of a sequence for inputting into the HMM.
2.4.2 Creation of Hidden Markov Model
In our models, each HMM has 9 states excluding the
start and end states which are common to each of the
models that are created using the HTK toolkit.
In order to train the various models, a large
number of training samples are obtained from retina
images that exhibit micro aneurysms to estimate the
model parameters. The feature vectors of each 5 by
5 pixel sub image are converted into a state so that a
state sequence is obtained for each 15 by 15 pixel
sub image and the models are created using a left to
right topology. The initial state distribution, state
transition probabilities, initial probabilities are then
estimated using the package from the HTK toolkit.
Subsequently, for recognition, each new sequence
will be input into the different HMMs and the model
which best match the sequence would be used as the
output.
HEALTHINF 2010 - International Conference on Health Informatics
272
3 EXPERIMENTAL RESULTS
3.1 Data Set
The training samples used to train the multiple
classifiers and Hidden Markov Models are obtained
from 100 retina images of various sources including
the Optimal Detection and Decision-Support
Diagnosis of Diabetic Retinopathy database.
3.2 Experiment Set Up
1000 training samples are obtained from these 100
retina images and used to train the two multiple
classifiers. 700 background sub images, 1000 micro
aneurysms sub images and 500 micro aneurysms and
blood vessel sub images are used to train the
different HMMs.
In order to determine the effectiveness of our
proposed technique, a further 220 retina images with
micro aneurysms are used to test the system. By
using the data from various sources, this ensures that
the data are more diverse, hence, testing the method
to its full potential.
3.3 Results
The performance of this technique is evaluated by
first labelling the ground truth of the micro
aneurysms followed by a comparison with both the
initial output of the ensemble and the final output of
the HMM. Ideally, the sensitivity and specificity of
the technique should be determined. However, in
certain images, the number of true positives out
weights the number of true negatives resulting in
high sensitivity and low specificity. Hence, in order
to determine the accuracy in detecting the micro
aneurysms, the Precision [Equation 1] which is
defined as the proportion of true positives against
true positives and false positives is calculated.
Precision =
TruePositives
TruePositives +FalsePositives
(1)
Using the ensembles, the method is able to detect
a substantial amount of micro aneurysms. However,
due to the high False Positives Rate at 1.31, the
Precision using the ensembles is only 0.50. Further
analysis showed that the main cause of the false
positives is largely due to background and fine
background vessels that are being misclassified by
the ensembles.
On performing contextual analysis using Hidden
Markov Models, the Precision is increased to 0.80
and the False Positive Rate is greatly reduced to
0.27. Observations from the output of the HMM
shows that the false positives are usually caused by
fine blood vessels which have not yet been modelled
and by background sub images which are nearer the
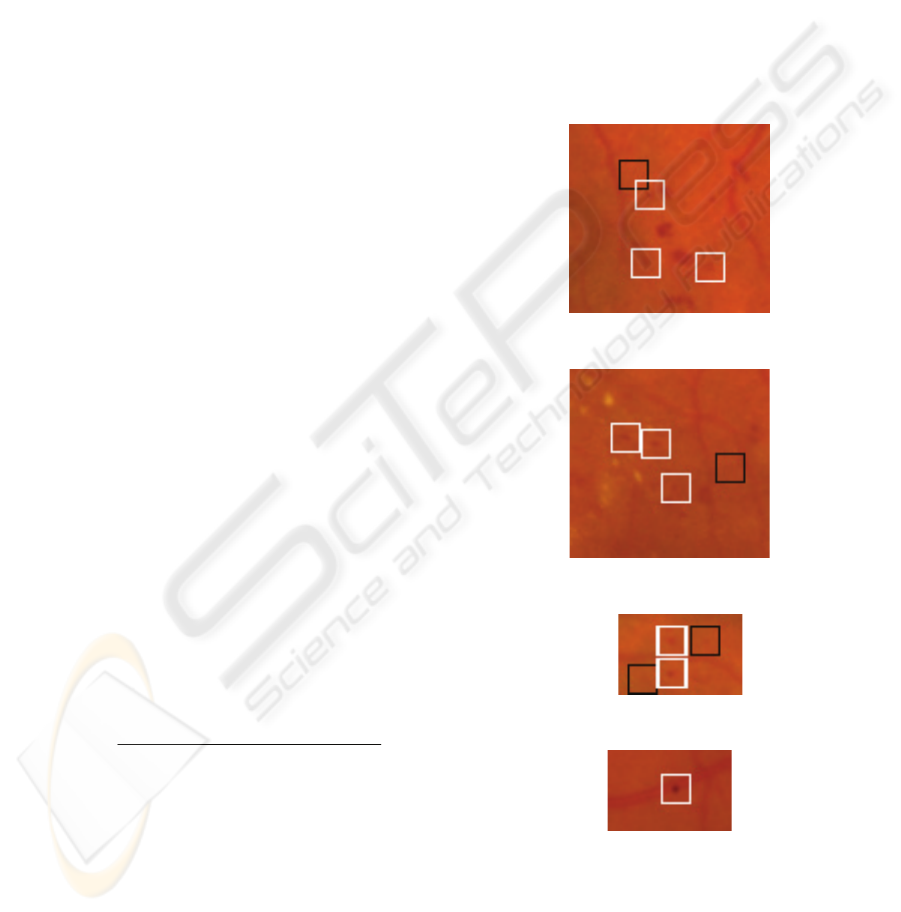
vicinity of the Optic Disc. Figure 5 illustrates the
technique’s ability to detect micro aneurysms while
figure 6 shows the technique’s ability to detect
micro aneurysms along the blood vessel using
watershed segmentation. To present the detected
micro aneurysms clearly, true positives are
represented by a white box, while true negatives are
represented by a black box.
Figure 5a: Detected Micro aneurysms.
Figure 5b: Detected Micro aneurysms.
Figure 5c: Detected Micro aneurysms.
Figure 6: Detected Micro aneurysms on blood vessel.
4 CONCLUSIONS
In summary, a novel way to detect micro aneurysms
using multiple classifiers and Hidden Markov
DETECTION OF MICRO ANEURYSMS USING MULTIPLE CLASSIFIERS AND HIDDEN MARKOV MODELS
273

Models has been demonstrated. The experimental
results have shown that by using Hidden Markov
Models as a contextual analysis model, overall
performance can be greatly improved, demonstrating
its excellent potentials for further development.
While the precision of this technique is only 0.80
with a false positive rate of 0.27, this technique is
evaluated over 220 retina images obtained from
various source, thus demonstrating the ability to
overcome diversity usually found in a large-scale
database.
REFERENCES
Cree M. J., Olson J. A., McHardy K. C., Forrester J. V.,
Sharp P. F., 1996, “Automated Microaneurysms
Detection”, Proceedings of the International
Conference on Image Processing.
Fu Y. and Browne A., 2007, “Using Ensembles of Neural
Networks to Improve Automatic Relevance
Determination”, Proceedings of International Joint
Conference on Neural Networks, Orlando, Florida,
USA.
HTK Toolkit, [Internet], >Available from
http://htk.eng.cam.ac.uk> Last Access [17/08/09].
Kittler J., Mohamad H., Duin R. P. W., Matas J., 1998,
“On Combining Classifiers”, IEEE Transactions on
Pattern Analysis and Machine Intelligence. Vol. 3 (3).
Niemeijer M., Ginneken B., Stal J., Suttorp-Schulten M. S.
A., Abramoff M. D., 2005, “Automatic Detection of
Red Lesions in Digital Color Fundus Photograph”,
IEEE Transaction on Medical Imaging, Vol. 25(5).
Optimal Detection and Decision –Support Diagnosis of
Diabetic Retinopathy (2005), Internet, <Available
from http://www.it.lut.fi/project/imageret/> Last
Accessed [17/08/08]
Parui S. K., Guin K., Bhattacharyam U., Chaudhuri B. B.,
2008, “Online Handwritten Bangla Character
Recognition Using HMM”, IEEE Transaction 2008.
Rabiner L. R., 1989, “A Tutorial on Hidden Markov
Models and Selected Applications in Speech
Recognition”, Proceedings of the IEEE, Vol. 77 (2).
Sagar A. V., S. Balasubramaniam, V. Chandrasekaran,
2007, “A Novel Integrated approach using dynamic
thresholding and edge detection for automatic
detection of exudates in digital fundus retina images”,
Proceedings of the International Conference on
Computing: Theory and Application.
Sinthanayothin C., Boyce J. F., Williamsom T.H., Cool
H.L., Mensah E., Lai S., Usher D., 2002, “Automated
Detection of Diabetic Retinopathy on Digital Fundus
Images”, Diabetic Medicine, Vol. 19, ppl105-112.
Spencer T., Olson J. A., McHardy K. C., Sharp P. F.,
Forrester J. V., 1996, “An Image Processing strategy
for the Segmentation and Quantification of
Microaneurysms in Fluorescein Angiograms of the
Ocular Fundus”, Computers and Biomedical Research,
Vol. 29, pp284-302.
Walter T., Klein J., 2000, “Automatic Detection of Micro
aneurysms in Color Fundus Images of the Human
Retina by means of the Bounding Box Closing”,
Proceedings of the Third International Symposium on
Medical Data Analysis, Rome, Italy.
World Health Organisation. [Internet], <Available from
http://www.who.int/blindness/causes/priority/en/index
6.html Last Access [17/08/09]
Won K., Prugel-Bennet A., Krogh A., 2006, “Evolving the
Structure of Hidden Markob Models”, IEEE
Transaction on Evoutionary Computation, Vol. 10 (1).
HEALTHINF 2010 - International Conference on Health Informatics
274
