
MULTI-AGENTS SYSTEM ON EPILEPTIC NETWORK
Abel Kinie, Jean-Jacques Montois
LTSI-INSERM/GRAID - IUT de Saint-Malo, Bd déportés BP 195, Saint-Malo Cedex, France
Keywords: Epilepsy, Signal processing, Biomedical signal processing, Multi-agent system, Distributed artificial
intelligence, Behaviour approach.
Abstract: This work is focused on the study and interpretation of epileptic signals, based on the analysis of stereo
electroencephalographic (SEEG) signals with signal processing method and multi-agent approach. The
objective is to use this technique to improve information extraction, representation and interpretation as well
as the implemented control strategies in the different processes. Our approach deals with the information
recorded during the intercerebral exploration and it exploits a dynamic selection of the interest’s
information to optimize the processing without truncating the information. We associated signal processing
algorithms (spectrum analysis, causality measure between signals) approved in the analysis of the epileptic
signal in a multi-agent system.
1 INTRODUCTION
The paroxysmal discharges are initiated by a
network (epileptogen network) distributed in
different cerebral structures linked by dynamic
connections and abnormally facilitated (Chauvel et
al., 1987). The identification of this network, in a
given patient, leads to the definition of an optimal
surgical procedure, that is to say minimizing the size
of the resection of the region of origin of the crisis
(Bartolomei et al., 2005).
The proposed methods for treating the signal
could lead to a better definition of the complex
concepts of the irritative and the epileptogenic zone
(Wendling et al., 1999)
as well as those of the
topography (“where is the source of the signal?”)
and of synchronicity (“these two signals are they
synchronic, therefore reflecting a functional
connectivity?”) The response elements only quantify
a part of the information contained in these signals.
These methods rely generally on a downward
approach and realize with difficulty the dynamic of
interactions between cerebral structures implied in
the epileptic process. The problem of analyzing the
propagation of epileptic activity is difficult to solve
with these approaches because the system must face
varied and unforeseeable situations (epileptic
seizures).
The problem is tackled here by a cooperative
distributive system. (J. Ferber, 1995), (G. Weiss,
1999). the first generation of distributive systems
appears in the middle of the 1970’s with the
development of artificial distributed intelligence
(AID). This generation of systems is characterized
by a distribution of knowledge and processing whilst
conserving a centralized control. The most important
contributions were those of Erman and Roth Hayes
(Erman et al., 1980) with Hearsay II, a system of
word recognition those of Lesser (Lesser and
Corkill, 1983) and actors of Hewitt [8. The second
generation of systems appearing in the 1990’s,
brought the decentralization of control, reutilization
and autonomous cooperative agents (J. Ferber, 1995)
and (G. Weiss, 1999). The cooperative distributed
system relies on a formalism agent who aims to
organize and control the scalar processes and to
insure its coordination by best integrating the
specifics of each process to make the combination of
interests appear between explored cerebral regions.
We hope through analysis by an independent agent,
for better adaptability to the erratic signal changes
and an effective management of complexity (by
local approach). It is therefore the control (Altman et
al., 2002) and follows up of the evolution of
activities from agents which will clarify the
evolution of the activities of explored cerebral
structures.
Paragraph two explains the formal framework of
the planned study. It poses the problem treated. The
methodological approach undertaken is then exposed
336
Kinie A. and Montois J. (2010).
MULTI-AGENTS SYSTEM ON EPILEPTIC NETWORK.
In Proceedings of the 2nd International Conference on Agents and Artificial Intelligence - Agents, pages 336-340
DOI: 10.5220/0002738603360340
Copyright
c
SciTePress

in detail in the third part which presents the
experimental platform of the multi agents system
(MAS) dedicated to the analysis of SEEG signals.
The fourth paragraph discusses the experimental
results obtained and compares them to traditional
clinical analysis made by a clinician and the last part
proposes a discussion of the potential benefits of this
original approach in the analysis of SEEG signals
and monitoring of epileptic patients.
2 THE MULTI AGENT SYSTEM
IN EPILEPSY
The MAS technical are often used in the artificial
intelligence field, the distributed information
processing systems and the software genius. It is a
discipline which is interested in the collective
behaviours produced by interactions of several
autonomous and flexible entities called agents.
These interactions suppose a co-operation between
these agents. The multi agent systems and signal
processing applying to epilepsy present a close links
according to the entities which compose them.
Indeed, the multi agent systems can allow
modelling and simulation of neurons aggregates or
systems based on autonomous entities and
distributed interactions. However the signals
processing (applying to epilepy) model the
mechanisms which govern the propagation of the
electric activities in the brain (distributed
mechanisms) and also the structure and the
interactions of the nervous cells.
Our paper brings out the common interests to
study the association of these two research fields.
Scalar analysis of the epileptic signal by the
computation of the relations between signals
(Bartolomei et al., 2005), (Wendling et al., 1999)
highlighted the existence of mutual interactions
between the EEGs. In the same way the concept of
epileptogenic network developed by Professor
Patrick CHAUVEL (Chauvel et al., 1987) give raise
to the existence of a co-operation between cerebral
areas in epileptic processes.
In order to take into account the specificity of
each signal and to compute the co-operations
between them, we evaluate 9 descriptors per signal
around a distributed system. These 9 descriptors
evaluated starting from the spectral power density
(PSD) in various frequencies bands from the
epileptic signals which correspond to various
physiological or pathological cerebral cortex states.
These descriptors and the various frequencies
bands used are detailed in paragraph 3.
The MAS from their innovative aspect and their
non-traditional approach (behavioural approach) of
the realization of distributed systems propose an
original method of vectorial processing by
associating existing signal processing scalar
methods. With the MAS technical in the signal
processing study we hope to compute the epileptic
processes mechanism during the paroxysmal
discharge propagation.
3 AGENTIFICATION OF THE
PROBLEM
The experimental platform used in this work is
MadKit (Multi-agent development Kit) (J. Ferber,
1995). The implementation of MAS requires using
iterative algorithms to define the behaviours of the
various agents which composed the system. For
conveniences reasons we used a ready to
employment platform (MadKit). In this model, an
organization is regarded as a structural relationship
between collections of agents. Thus, an organization
can be described only on the basis of its structure.
MADKIT is conceived by Jacques FERBER and al
(J. Ferber, 1995). It implements its three central
concepts Agent, Groups and Role.
Our approach is built starting from several
groups of agents whose properties and missions
must allow:
To classify the signals having the same SEEG
activities and/or contained similar spectral
components (groups).
to classify the signals whose activities change
in the same temporal interval
(segmentation)(groups).
To represent the seizure as a coloured image
allowing locating in space and in time the
SEEG signals having the pathological or the
similar activities (groups and roles...).
To associate all these partial results to bring
out a global behaviour of the analyzed seizure
(groups and roles).
To formalize the problem we consider a vectorial
signal S (t) made up of a recording SEEG signals on
N channels and an interval [0, T]. S (t) = [S1 (t)......
SN (t) S
k
(t) ∈ . k = 1...... N, t = {0, 1/Fe... T-1/Fe},
N is the number of explored cerebral structures and
Fe is the sampling rate.
Our architecture is made of a reactive agent’s
community which is made up of various agents
MULTI-AGENTS SYSTEM ON EPILEPTIC NETWORK
337
groups whose are able to analyze, in parallel, the
signals coming from N recording SEEG channels (N
≈100). In this approach, to each SEEG channel
(epileptic signal) we associated a "Descriptor" agent.
Its role is to analyze the spectral components of the
segment of signal recorded on this channel and to
seek possible links with his/her "colleagues" on the
[t, t+Δt] interval. All the "Descriptors" agents
communicate the results of their analysis to a
"Classifying” agent which is in charged to compute
the components of each SEEG segment then to
classify it according to its a priori knowledge.
Indeed no exhaustive trainings classes were built and
transmitted to the "Classifying" agent for each
epileptic activity. When T described the [0, T]
interval (T being the total recording duration), a
"Visualization" agent produces a coloured space
time and spectral tablecloth representation, with
each agent at the t moment. Parallel to each activity
class identified by the "Descriptors" agent on the [t,
t+Δt] interval we associated a "Causality" agent
whose role is to evaluate the degree of relationship
between brain’s entities bound by affinities.
3.1 Descriptors Agent
The agent associated with each SEEG channel uses
the energy of the signal calculated in various
frequencies bands to characterize the activity during
the computation time. To take into account the
specificity of SEEG signal, we chose the 9 bands
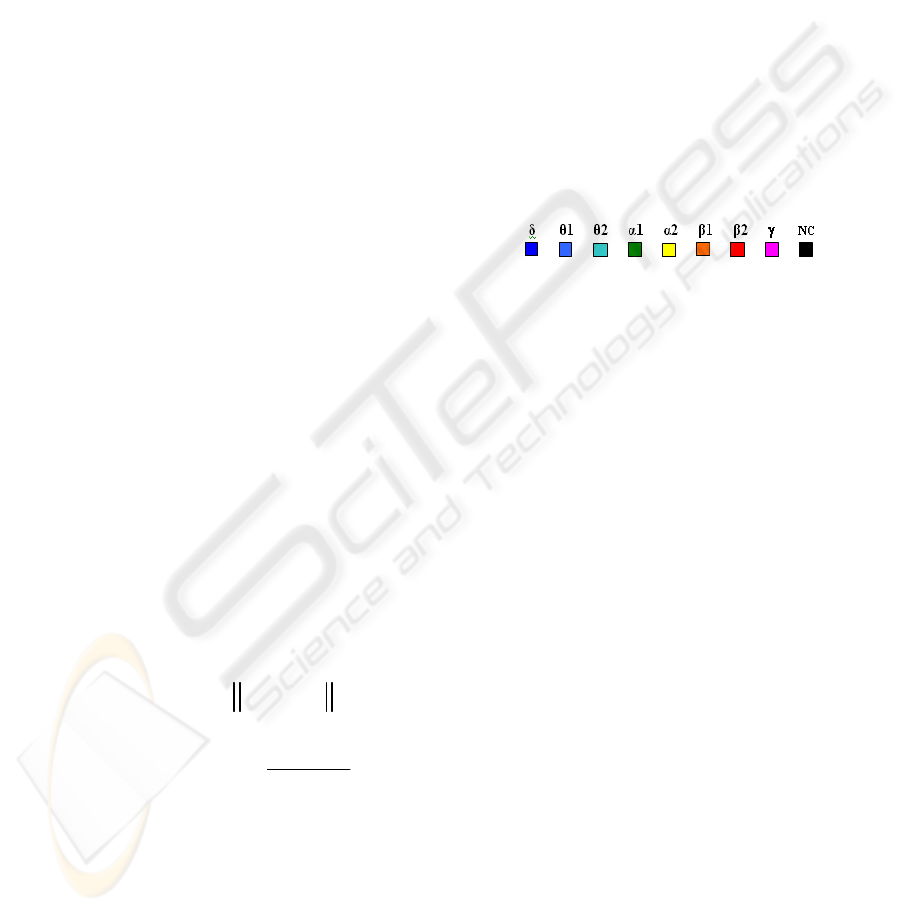
classically used in the field (δ1, δ2, θ1, θ2, α1, α2,
β1, β2, γ ).
Energy is calculated starting from the
power spectral density (psd to see (1) and (2))
estimated starting from the periodogram method A
characteristic vector (9 parameters representing the
agent state at the t moment) is produced for each
SEEG channel for the current segment.
2
0
)( fSdsp
nbPtsFFTf
f
∑
=
=
=
(1)
() ()
2
0
ifn
nbPtsFFT
N
Sf Sn e
n
π
−
=
∑
=
(2)
Where S (f) is the Fast Fourier Transform the s(t)
signal.
3.2 Classifying Agent
During each cycle, the "Classifying" agent receives
the characteristic vector produced by each
"Descriptors" agent and associates a scalar code to
the segment considered. . From this agent state (its
scalar code) and its “neighbours” state (information
on the proximity between SEEG sensors), a decision
is taken according to the identification of all agents
components (strong probability of being in the same
state as its “neighbours” belonging to the same
brain‘s structure).
3.3 Visualization Agent
It associates during the computation time a colour to
each "Descriptors" agent and produces a space time
and spectral tablecloth representation of the spectral
components of each SEEG signal. The colour
attribution is carried thanks to each agent state
(spectral components). “Cold "and" hot "colours
then respectively code the "low frequencies
activities and the "high frequencies" activities and
the black colour codes the not classified activities.
Figure.1: Association between activity and colour.
3.4 Causality Agent
The agent associated with each class and activity
identified on the [t, t+Δt ] interval uses the nonlinear
coefficient of regression h
2
XY
calculated on a pair of
X(t) and Y(t) observed signals on the limited
temporal support [ t, t+Δt ]. It makes it possible to
characterize the functional couplings between
cerebral structures and to consider a time delay of
propagation possible between these two
observations.
The Load Agent (Scheduler) is charged to plan
the execution order and to activate in a synchronized
way all the operated agents. The principle is rather
simple to each agent or agents groups (G) equipped
with a role (R) we associated an activator (A
GR
) on
the level of Scheduler. Scheduler is useful of these
activators to plan the tasks while launching to each
activators (A
GR
) cycle the ones after the others
according to the desired execution order. A cycle
corresponds to a full rotation of the various
activators which one need to activate.
The global architecture of the establishment is
summarize in 3 phases (A Phase, B Phase and C
Phase)
A Phase
The Server agent (data base) feeds the Descriptors
agents and "Rate/rhythm" in signal samples. The
Descriptors, the "Rate/rhythm» and the Causality
ICAART 2010 - 2nd International Conference on Agents and Artificial Intelligence
338
(the signal processing algorithms) are charged to
carry out the traditional computation of low level.
The "Rate/rhythm" deals with the segmentation
(detections of the moments of rupture in the
analyzed signal).
B Phase
Observant agents (Watcher) (Erman et al., 1980) are
charged to recover the data (results provided by the
agents of low level. They also provide a more
elaborate processing on these data and contribute to
the emergence of a global organization. The
Classifying agent allows the junction of the other
agents with the Descriptors agent, it also orders the
results generated by the latter. The Visualization
agent provides a representation of the seizure where
information is made available. The observers
"Rupture" and the Causality respectively represent
for the agents "Rate/rhythm" and "the Causality
what "To classify it" represents for the Descriptors
agent. Load Agent (interface) allows choosing the
patient seizure to be analyzed, to create and to
parameterize the execution architecture. It also
manages the scheduling of the spots to be carried out
by the agents.
C Phase
This phase which is not presented here will have to
join together information resulting from phases A
and B to order the seizure propagation. It will have
to consider the evolution of the interactions between
agents (affinities) to raise the evolution of the
couplings between brain’s structures during the
seizures.
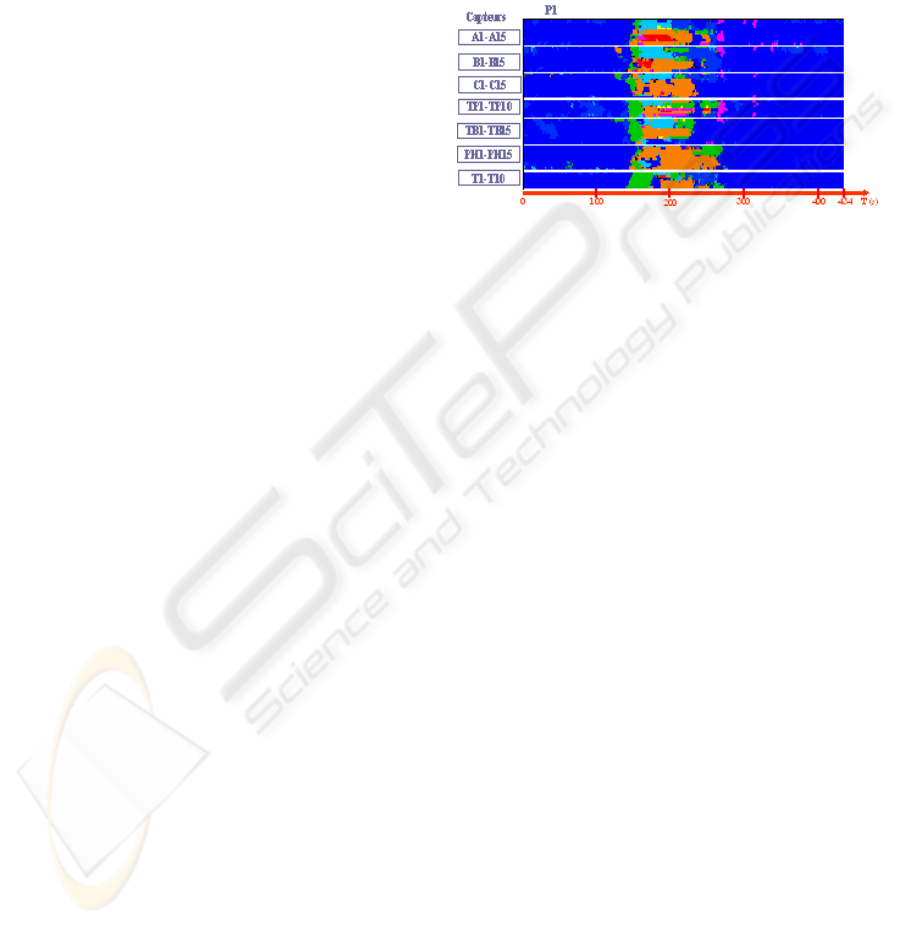
4 RESULTS
The SEEG signals are recorded by a BMSI-
NICOLET system which allows a simultaneous
acquisition of SEEG signals on 128 channels, at a
sampling rate of 256Hz. The studs of the electrodes
are numbered from 1 to 15 from the internal end to
the external end. Each electrode is located by a letter
(A, B, C....), affected of a "premium" (A', B', C '...)
if it is established on the left dimensions of the brain.
We obtained a complete image of the analyzed
epileptic seizure where each activity is well
identified according to the frequencies activities of
its localization SEEG sensors and its appearance
moment (time).
The x-axis corresponds to the temporal space
(time in second), the y-axis space (studs or signals),
the various electrodes are separated by white
features and each electrode studs is presented at the
extreme right-hand side of the diagram. The
following paragraphs propose the results analysis.
In a patient presenting temporal lobe epilepsy,
according to the clinician; the brain’s structures
involved in the initiation of its seizure are the
internal temporal pole (TP), the former hippocampus
(B), the posterior hippocampus (C) and the
entorhinal cortex (TB).
Figure 2: Space –time and -spectral representation of P1.
Figure 2 shows the localization of various
activities (ictal and normal) but also allow
identifying for each SEEG sensor, the activity type.
It also highlights about several initiating brain’s
structures. We observed quite localized ictal
activities and this clearly highlight again about the
implication of a great number of SEEG channels in
the propagation of the paroxysmal discharge during
the computation time.
5 CONCLUSIONS
On patients study the results highlight a zone
initiating the seizures including the internal temporal
brain’s structures (former and posterior
hippocampus, entorhinal cortex) and confirm the key
role of these structures in the partial temporal lobe
epilepsy.
Our work formalization problems and an analysis
made of each entity’s behaviour towards co-
operation, association and competition which bring
out these relevant images, can lead us to a better
understand some epileptic observed phenomena.
Difficulty to interpret some others phenomena come
from the artefacts strongly present in the signals and
a good management of these measurements noises
can improve the results.
The technological platform thus created is
situated at the borders of several research domains
(signal processing, computer engineering and
artificial distributed intelligence) and opens the
perspectives notably for monitoring epileptic
MULTI-AGENTS SYSTEM ON EPILEPTIC NETWORK
339

patients. The original procedure proposed and the
first results obtained give us hope to go further in the
exploitation of MAS techniques to help with the
diagnosis of epilepsy by means of the description of
the propagation of the discharge during epileptic
seizures and the vectorial processing of the signal in
its entirety. In the long term we envisage to place
more interactivity between the system and its user so
as to better link the clinical symptoms to the
evolution of certain physiological parameters.
REFERENCES
P. Chauvel, P. Buser., J.M. Badier, C.Liegiois-Chauvel.,
P. Marquis et Bancaud La zone épileptogène chez
l’homme : représentation des événements inter
critiques par cartes spatio-temporelles. Revue
Neurologique, n° 143, pp. 443-450, 1987.
F. Bartolomei, P. Chauvel, F. Wendling, “Dynamique des
réseaux neuraux dans les épilepsies partielles
humaines”, Revue Neurologique, Vol. 161, 2005, p.
767-780.
F. Wendling, M. Shamshollahi, et al, “Time-frequency
matching of warped depth-EEG seizure observations”,
IEEE Trans. Biomed. Eng, Vol. 46(5), 1999, p. 601-
605.
J. Ferber. Les Systèmes Multi Agents. Vers une intelligence
collective. InterEditions, 1995.
G. Weiss, “Multiagent System. A Modern Approach to
Distributed Artificial Intelligence”, The MIT Press,
Cambrige, Massachussetts (Ed) 1999.
L. D. Erman F. Hayes-Roth, V. R Lesser et al, "The
Hearsay II speech understanding system; Integrating
knowledge to resolve uncertainty",ACM Computing
Survey 12, 1980, p.213-253.
V. R. Lesser, D. Corkill: The Distributed Vehicle
Monitoring Testbed: A Tool for Investigating
Distributed Problem Solving Networks. AI Magazine
4(3), 1983, p.15-33.
Hewitt, C. E., “Viewing control structures as patterns of
passing messages”, Artificial Intelligence 8, 323-364,
1977.
E. Altman, T. Basar, R. Srikant, “Nash equilibria for
combined flow control and routing in networks :
Asymptotic behaviour for a large number of users”,
IEEE Transactions on Automatic Control, Special
Issue on Control Issues in Telecommunication
Networks,Vol.6, #47, 2002 p.917-930.
ICAART 2010 - 2nd International Conference on Agents and Artificial Intelligence
340
