
FREQUENCY BANDS EFFECTS ON QRS DETECTION
Mohamed Elgendi, Mirjam Jonkman and Friso DeBoer
School of Enigneering and Information Technology, Charles Darwin University, Australia
Keywords: QRS detection, QRS spectrum, ECG.
Abstract: In this paper, we investigate the QRS frequency bands in ECG signals. Any QRS detection algorithm
accuracy depends on the frequency range of ECG being processed. The QRS complex has different
morphology and frequency band for different arrhythmias and noises in ECG signals. A standard bandpass
range that maximizes the signal (QRS complex)-to-noise (T-waves, 60 Hz, EMG, etc.) ratio will be useful
in ECG monitoring and diagnostic tools. A sensitive QRS detection algorithm has been introduced to
compare the performance of using different frequency bands. The results shows that the recommended
bandpass frequency range for detecting QRS complexes is 8-20Hz which the best signal-to-noise ratio.
1 INTRODUCTION
The electrocardiogram (ECG) is a graphical
representation of the electrical activity of the heart.
ECG signals are obtained by connecting specially
designed electrodes to the surface of the body. It has
been in use as a non-invasive cardiac diagnostic tool
for over a century. The QRS complex is the
dominant feature of the ECG signal. QRS detection
is vitally important in many clinical instruments
such as simple cardio-tachometers, arrhythmia
monitors, and implantable pacemakers. Therefore,
reliable detection of the QRS complex remains an
important area of research. The problem is complex
in that the morphologies of many normal as well as
abnormal QRS complexes differ widely.
The ECG signal is often corrupted by noise from
many sources: 50/60 Hz from power line
interference, EMG from muscles, motion artefacts
and changes in the electrode-skin interface.
Moreover, large and wide P- and T-waves can act as
sources of interference when detecting the QRS
complexes.
Band pass filtering is an essential first step of
nearly all QRS detection algorithms. The purpose of
band pass filtering is to remove the baseline wander
and high frequencies which do not contribute to
QRS complexes detection. In this research we
investigate which pass bands are optimal for QRS
detection.
In literature, the QRS frequency band has been
used without actually identifying the optimum QRS
frequency range for the detection of the QRS
complexes.
Thakor et al. (1983) proposed an estimate of QRS
complex spectra and suggested that the passband
which maximizes the QRS energy is approximately
5-15 Hz. Pan and Tompkins (1985) used cascaded
the low-pass and high-pass filters to achieve a 3 dB
passband from about 5-11 Hz, Cuiwei et al., (1995)
used a quadratic spline wavelet with compact
support and one vanishing moment. Their
conclusion was that most of the QRS complex
energies are at the scales of 2
3
and 2
4
. This
corresponds to a frequency range between 8 and
58.5Hz. Sahambi et al. (1997) used the first
derivative of a Gaussian smoothing wavelet and
found that the most of the QRS complex energies are
at the scales of 2
3
and 2
4
. They claim that most of
the energy of the QRS complex lies between 3 Hz
and 40 Hz. Benitez et al. (2000) developed a QRS
detection algorithm using the properties of the
Hilbert transform with band stop frequencies at 8
and 20 Hz in order to remove muscular noise and
maximize the QRS complex respectively, Moraes et
al. (2002) combined two improved QRS detectors
using band pass filter between 9 and 30Hz. Chen
and Chen (2003) introduced a QRS detection
algorithm based on real-time moving averaging and
assume the QRS frequencies are concentrated at
approximately 5-15 Hz. Mahmoodabadi et al. (2005)
used Daubechies2 to detect QRS complex using
scales of 2
3
-2
5
which is in the frequency range
between 2-40Hz. Most of these authors evaluated
their algorithms using the MIT-BIH database.
Using the QRS detection algorithm described
below, we compare various frequency pass bands to
428
Elgendi M., Jonkman M. and DeBoer F. (2010).
FREQUENCY BANDS EFFECTS ON QRS DETECTION.
In Proceedings of the Third International Conference on Bio-inspired Systems and Signal Processing, pages 428-431
DOI: 10.5220/0002742704280431
Copyright
c
SciTePress
identify the appropriate frequencies that maximizes
the QRS complex compared to the other ECG
features (P and T waves) and to noise (60 Hz, EMG,
motion artefacts).
2 DATA
Fourty eight ECG records from the MIT-BIH
Arrhythmia database (Moody and Mark, 1990) were
used to test the algorithm. These 30-minutes
recordings were sampled at 360 Hz with a 11-bit rate
resolution over a 10 mV range. Lead I from each
record is used here. No episodes have been excluded
from our analysis.
The MIT-BIH Arrhythmia database is preferable to
other ECG databases for two reasons:
• The MIT-BIH database contains 30-minutes
recordings for each patient which is
considerably longer than the records in other
databases. The CSE database for example
contains 10-seconds recordings only(
J.L.
Willems, 1988)
• The MIT-BIH Arrhythmia database contains
records of normal ECG signals as well as
records of ECG signals that are affected by
non-stationary effects, low signal-to-noise
ratio, premature atrial complexes, premature
ventricular complexes, left bundle blocks, and
right bundle blocks. This provides the
opportunity to test the robustness of the QRS
wave detection method.
3 METHODOLOGY
To compare different frequencies bands that have
been described in literature, for the QRS detection
band pass filter, a sensitive QRS detection algorithm
is needed. The algorithm proposed here consists of
three main stages: bandpass filtering, generating
potential blocks and thresholding.
3.1 Bandpass Filter
Band pass filtering is the first stage of any QRS
detection algorithm. As shown in Table. 1, different
frequency bands have been described in literature to
detect the QRS complex. We investigate here the
optimal frequency bands for accurate QRS detection
in the time-domain. A second order Butterworth
filter with selected pass bands, shown in Table 1, is
used.
h(ECG[n])Butterworts[n]
=
3.2 Generate Potential Blocks
We demarcate the onset and offset of the potential
QRS waves in the ECG signals by using two moving
averages, based on the normal duration of the QRS
interval which for a healthy adult is 100±20ms (Gari
D. Clifford, 2006).
Table 1: Proposed frequency bands for the detection of
QRS complexes.
Proposed frequency bands in literature
Frequency
Band
(Thakor et al., 1983) and (Chen and Chen, 2003) 5-15Hz
(Pan and Tompkins, 1985) 5-11Hz
(Cuiwei et al., 1995) 8-58.5Hz
(Sahambi et al., 1997) 3-40Hz
(Benitez et al., 2000) 8-20Hz
(Moraes et al., 2002) 9-30Hz
(Mahmoodabadi et al., 2005) 2-40Hz
For a sampling frequency of 360 Hz, the
maximum window size corresponding to the QRS
interval is approximately 44 points and the
maximum window size corresponding to every beat
interval is approximately 231 points. The two
moving averages to detect the R waves are:
0.1 0.2 0.3 0.4 0. 5 0.6 0. 7 0.8 0.9 1
-0.6
-0.4
-0.2
0
0.2
0.4
0.6
0.8
1
time(sec)
mV
0.1 0.2 0.3 0.4 0.5 0.6 0.7 0.8 0.9 1
-0.2
-0.1
0
0.1
0.2
0.3
0.4
0.5
time(sec)
mV
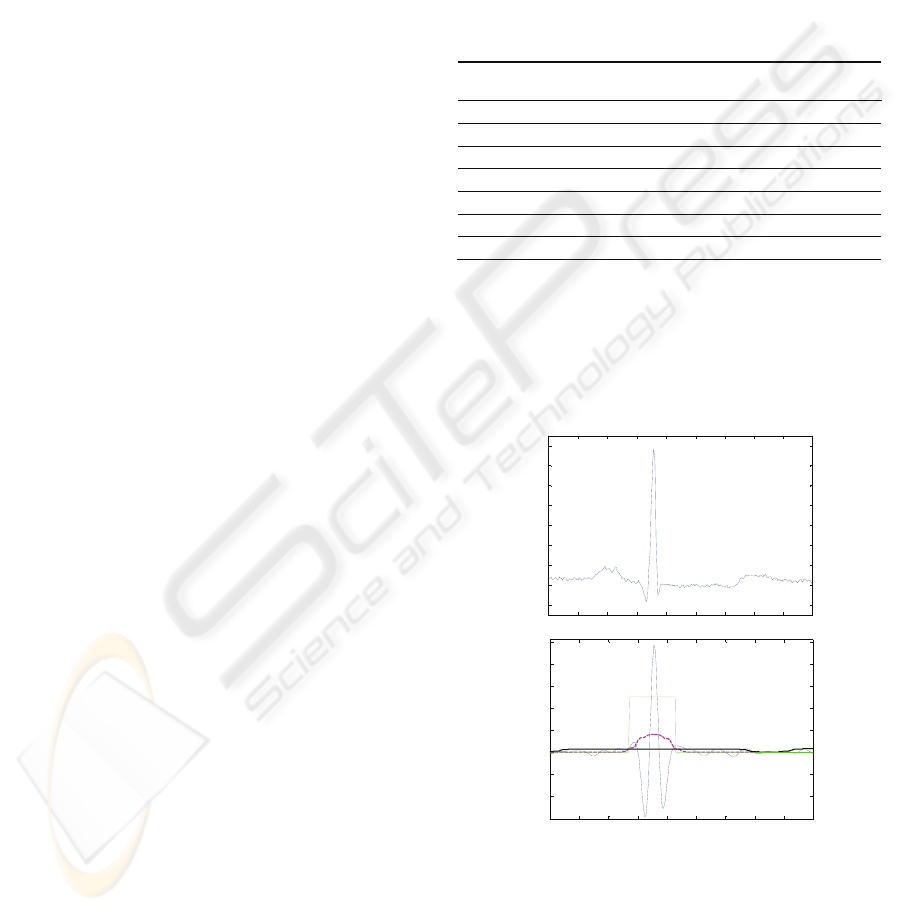
Figure 1: Demonstrating the effectiveness of using two
moving averages to detect QRS complex (a) filtered one
beat ECG signal with Butterworth bandpass filter (b)
generating blocks of interest after using two moving
averages: the dotted line is the first moving average and
the solid line is the second moving average (c) the
detected R peak after applying the thresholds.
FREQUENCY BANDS EFFECTS ON QRS DETECTION
429

First moving-window integration: the first moving
window integration used to capture the QRS area.
Moreover, the first moving window integration
used as a threshold for the output of the second
moving-window integration, calculated as follows:
y[n]).......2)]-(W-y[n1)]-(W-(y[n
W
1
[n]MA
11
1
QRS
+++=
where
44=
1
W which is the window width of QRS
segment. This is shown as the dotted line in Fig.
1(b).
Second Moving-window Integration: The purpose
of the second moving window Integration, shown as
the solid line in Fig. 1(b), is to capture a complete
beat.
y[n]).......2)]-(W-y[n1)]-(W-(y[n
W
1
[n]MA
22
2
Beat
+++=
where
231=
2
W is the window width of a complete
heart beat.
When the amplitude of the first moving average
filter (MA
QRS
) is greater than the amplitude of the
second moving average filter (MA
Beat
), that part of
the signal is selected as a block of interest, as
follows:
Fig. 1(b) shows an overview of the result of
applying the two moving averages.
We show one QRS interval in Fig. 1 to
demonstrate the idea of using two filters to generate
blocks of interest. Not all of the blocks are potential
QRS complex. Some block are caused by noise and
need to be eliminated.
3.2.1 Thresholding
The expected size for the QRS interval is based on
the statistics for healthy adults, as described above.
We reject blocks that are smaller than the
expected width of the QRS complex. This
corresponds to:
44KS)width(BLOC <
The rejected blocks are considered as noisy blocks
and the accepted blocks are considered to be
containing R wave.
The maximum absolute value within each
accepted block is considered to be the R peak.
Table 2: QRS detection results for different frequency
bands.
Tested frequency bands SE +P
5-15Hz 97.00% 99.87%
5-11Hz 95.93% 99.81%
8-58.5Hz 97.61% 99.92%
3-40Hz 92.66% 99.87%
8-20Hz 98.31% 99.92%
9-30Hz 97.73% 99.92%
2-40Hz 93.91% 99.80%
Table 2 shows the QRS detection results with
different frequency bands. The frequency range that
optimizes QRS detection is 8-20Hz, first proposed
by Benitez et al (2000). The QRS detection results
of 48 records using this particular frequency band
are shown in Table. 3
Table 3: QRS detection results for a 8-20Hz band pass
filter.
Record
No of
beats
TP FP FN SE +P
100 2273
2272 1 0 100.00% 99.96%
101 1865
1864 1 4 99.79% 99.95%
102 2187
2187 0 0 100.00% 100.00%
103 2084
2084 0 0 100.00% 100.00%
104 2229
2226 3 9 99.60% 99.87%
105 2572
2564 8 22 99.15% 99.69%
106 2027
2027 0 61 97.08% 100.00%
107 2136
2136 0 0 100.00% 100.00%
108 1763
1761 2 109 94.17% 99.89%
109 2532
2532 0 0 100.00% 100.00%
111 2124
2124 0 1 99.95% 100.00%
112 2539
2539 0 0 100.00% 100.00%
113 1795
1794 1 49 97.34% 99.94%
114 1879
1879 0 53 97.26% 100.00%
115 1953
1952 1 1 99.95% 99.95%
116 2412
2406 6 1 99.96% 99.75%
117 1535
1535 0 1 99.93% 100.00%
118 2278
2278 0 5 99.78% 100.00%
119 1987
1987 0 7 99.65% 100.00%
121 1863
1863 0 3 99.84% 100.00%
122 2476
2476 0 0 100.00% 100.00%
123 1518
1518 0 5 99.67% 100.00%
124 1619
1619 0 15 99.08% 100.00%
200 2601 2601 0 42 98.41% 100.00
%
201 1963 1963 0 86 95.80% 100.00
%
202 2136
2134 2 15 99.30% 99.91%
203 2980
2936 44 36 98.79% 98.52%
205 2656
2654 2 0 100.00% 99.92%
207 1860
1860 0 61 96.82% 100.00%
208 2955
2954 2 3 99.90% 99.93%
209 3005
3005 0 0 100.00% 100.00%
210 2650
2633 17 5 99.81% 99.36%
212 2748
2748 0 0 100.00% 100.00%
213 3251
3250 1 0 100.00% 99.97%
214 2262
2262 0 10 99.56% 100.00%
215 3363
3362 1 0 100.00% 99.97%
217 2208
2207 1 1 99.95% 99.95%
219 2154
2154 0 31 98.58% 100.00%
220 2048
2047 1 0 100.00% 99.95%
221 2427
2427 0 50 97.98% 100.00%
222 2483
2481 2 47 98.14% 99.92%
223 2605
2605 0 0 100.00% 100.00%
IF
[n]MA
QRS
>
[n]MA
Beat
THEN
BLOCKS[n] =1
ELSE
BLOCKS[n]
=0
END
BIOSIGNALS 2010 - International Conference on Bio-inspired Systems and Signal Processing
430

Table 3: QRS detection results for a 8-20Hz band pass
filter.(Continuation).
228 2053
2053 0 101 95.31% 100.00%
230 2256
2256 0 0 100.00% 100.00%
231 1571
1571 0 432 78.43% 100.00%
232 1780
1780 0 449 79.86% 100.00%
233 3079
3078 1 0 100.00% 99.97%
234 2753
2753 0 0 100.00% 100.00%
109493 109397 97 1715 98.31% 99.92%
4 CONCLUSIONS
We compared different frequency bands that have
been proposed in literature for band pass filtering in
order to detect the QRS complex.
The results show that the accuracy of QRS
detection is affected by the selected frequency band.
The QRS detection algorithm was applied to ECG
signals that suffer from a) non-stationary effects, b)
low signal-to-noise ratio, c) atrial premature
complexes d) ventricular premature complexes, e)
left bundle blocks, and f) right bundle blocks.
Analysis of 109493 QRS complexes in 48 records of
MIT-BIH arrhythmia database shows that the
optimal QRS frequency band is 8-20Hz. It is an
optimal band pass filter for QRS detection and it
should be useful in the design of cardio-tachometers,
arrhythmia monitors, and implantable pacemakers.
REFERENCES
Benitez, D. S., Gaydecki, P. A., Zaidi, A. & Fitzpatrick, A.
P. (2000) A New Qrs Detection Algorithm Based On
The Hilbert Transform. Computers In Cardiology
2000.
Chen, H. C. & Chen, S. W. (2003) A Moving Average
Based Filtering System With Its Application To Real-
Time Qrs Detection. Computers In Cardiology, 2003.
Cuiwei, L., Chongxun, Z. & Changfeng, T. (1995)
Detection Of Ecg Characteristic Points Using Wavelet
Transforms. Biomedical Engineering, Ieee
Transactions On, 42, 21-28.
Gari D. Clifford, F. A., Patrick Mcsharry (2006)
Advanced Methods And Tools For Ecg Data Analysis.
Artech House Publishers, 1
st
Edition.
J.L. Willems (1988) Common Standards For Quantitative
Electrocardiography Cse Multilead Atlas Dataset-3.
Cse Project, Leuven, Belgium,, Acco Publ, 1-341.
Mahmoodabadi, S. Z., Ahmadian, A. & Abolhasani, M. D.
(2005) Ecg Feature Extraction Using Daubechies
Wavelets. Nternational Conference, Visualization,
Imaging, And Image Processing, Proceedings Of The
Fifth Iasted.
Moody, G. B. & Mark, R. G. (1990) The Mit-Bih
Arrhythmia Database On Cd-Rom And Software For
Use With It. Computers In Cardiology 1990,
Proceedings.
Moraes, J. C. T. B., Freitas, M. M., Vilani, F. N. & Costa,
E. V. (2002) A Qrs Complex Detection Algorithm
Using Electrocardiogram Leads. Computers In
Cardiology, 2002.
Pan, J. & Tompkins, W. J. (1985) A Real-Time Qrs
Detection Algorithm. Biomedical Engineering, Ieee
Transactions On, Bme-32, 230-236.
Sahambi, J. S., Tandon, S. N. & Bhatt, R. K. P. (1997)
Using Wavelet Transforms For Ecg Characterization.
An On-Line Digital Signal Processing System.
Engineering In Medicine And Biology Magazine, Ieee,
16, 77-83.
Thakor, N. V., Webster, J. G. & Tompkins, W. J. (1983.)
Optimal Qrs Detector. Medical And Biological
Engineering, 21, 343-50.
FREQUENCY BANDS EFFECTS ON QRS DETECTION
431
