
GEODADIVAS
Geographic Information Systems for Blood Donation Management in Portugal
Juliano de Souza Gaspar, João Rolando Azevedo, Jorge Leal, Fábio Hedayioglu
University of Porto, Porto, Portugal
Ricardo João Cruz Correia
CINTESIS – Centre for Research in Health Technologies and Information Systems
Biostatistics and Medical Informatics Department, Faculty of Medicine University of Porto, Porto, Portugal
Keywords: Geographic Information Systems, Blood Donors, Database Management Systems.
Abstract: Blood donations are a significant part of good medicine nowadays. Needs in this area include geographic
allocation off donors and its characteristics. Towards new applications in informatics systems and the
implementation of ground theories in information systems (such as work and information flows), the
changes in this area are promising. One kind of applications that enhances greatly this area are geographic
information systems (GIS). They permit the allocation of raw data or processed information in a map,
allowing contextualization of the information itself and the extrapolation of knowledge. Our goals focused
on researching the state of the art off current status, data manipulation and processing relative of the donor’s
database, modeling and developing a program that could show a varied option of queries that can be done to
the database. We used some statistic approach to the data as well as software implementation. After its
completion, it was possible to calculate the distribution of blood donors and cross reference this with the
places of collect. The distribution of the donors by group or area was made visible for interpretation
purposes. Ultimately, the feasibility of such systems is proved and the changes in blood donation
management can represent an important improvement towards good care.
1 INTRODUCTION
1.1 Transfusion Medicine
Transfusion Medicine practice has as fundamental
purpose the attainment, availability and accessibility
of blood and its components. They must attain a
desired level of quality, safety and effectiveness.
Still actually, worldwide blood donation is
insufficient to the existing needs (Nilsson Sojka,
2007). The medical investigation and the
technological breakthrough in this sector had a big
boom thus allowing an improvement in this area. In
other hand, the development of a health care
structure, and the differentiation and sophistication
of medical techniques led to an increase on blood
demands. Simultaneously, people are ageing and as
a consequence there is a reduction of people elective
to be donors (from 18 to 65 years) and an increase of
number of people who actually needs blood
components as they grow older.
1.2 Portuguese Blood Institute
During the last 50 years, a network capable of
collecting blood in respect with the technological
advances was created. It needs the adequate human,
technical and material resources to function well
however some aspects are still to overcome.
The National blood Service Mission was
established, being assigned to the IPS (Instituto
Português de Sangue, in portuguese) the normative
and coordination competences and to the Regional
Blood Centers of Porto, Coimbra and Lisboa the
operational competences to collect process and
distribute the blood components and the regional
supervision.
The use of Geographical Information Systems
(GIS) by the IPS, recurring to the referenced
450
de Souza Gaspar J., Rolando Azevedo J., Leal J., Hedayioglu F. and Cruz-Correia R. (2010).
GEODADIVAS - Geographic Information Systems for Blood Donation Management in Portugal.
In Proceedings of the Third International Conference on Health Informatics, pages 450-455
DOI: 10.5220/0002743204500455
Copyright
c
SciTePress

geographic information existing in its’ databases,
can constitute an important analysis and support tool
to resources management.
Depending on the geo-positioning level actually
available (or to exist in the future) in the Regional
Blood Centers databases, a GIS can allow to
visualize the resources and event distribution such as
donors, the places of blood collect, blood types,
gender, age, etc. and geographically contextualize
blood donation frequencies or other situations
making it easy to plan promotion actions towards
blood collection accordingly to the existing needs.
One of the main difficulties nowadays in IPS, is
the elevated costs of the mobile blood collection
places that have a low rate of donations. These costs
depend on human resources (physicians, technicians,
nurses, drivers, etc.) to equipment, among others.
1.3 Geographic Information Systems
Geography takes a fundamental role in almost all
decision we made. The choice of places, the
appointing of market segments, the planning of
distribution networks, response to emergencies
scenarios, the redrawing of countries frontiers, all
those problems address geographic issues.
Geographic characteristics such as topography and
geographic dispersion of population are fundamental
factors in fair resources distribution (Leitner, 2002).
GIS crosses regular data and their geographic
position with the purpose of building maps. This
technology allows us to visualize data with different
degrees of complexity in a map. This gives us a
useful way of reveling spatial and temporal relations
between data.
A GIS can integrate hardware, software, capture
or recollection of data, management, analysis and
the presentation of all types of information
geographically.
Combining data and applying some analytical
rules, it is possible to create a pattern in order to help
answer the question previously made. The GIS
primary goals in healthcare are (Maged, 2004):
Inform and educate health professionals and
population;
Support decision making in many levels;
Prevent results before making any
compromises;
Select priorities in lower resources
environments;
Change bad practices and routines;
Monitor and watch continuously changes
implementations.
Investigators, Public Health professionals, policy
makers and others can use GIS to better understand
geographic relation that affect health results, risks,
disease transmission, health care access and other
public health concerns. They’re being used more and
more often to deal with problems in a local, regional,
national or international overlay (CDC, 2009).
GIS allow us to:
Understand, question, interpret and visualize
data in many forms revealing relations,
patterns and tendencies under the form of
maps, globes, reports or graphs:
Answer questions and solve problems
allowing looking at the data in a faster and
easily shared way;
Integration in almost any Information System
within an organization;
Solve more problems than the simple use of a
mapping program or the adding of data to an
online mapping tool.
Health related GIS have 2 main forms
(Vanmeulebrouk, 2008):
Epidemiology – focusing on the study and
comprehension of incidences and prevalence
of diseases and public health hazards,
normally linked to environmental factors;
Health care – allowing analyzing and
characterizing the distribution and the access
of institutions (hospitals, health centres, blood
centres, etc.)
Many of those systems possess simple functions
such as measuring the distance between resources
and the population. So, questions like: at what
distance can we find the nearest hospital, or where’s
the closest institution where I can donate blood, can
be easily answered avoiding many constraints.
Despite the evident benefits of GIS use, its
dissemination and utilization it’s not yet a
generalized reality. Some possible explanation for
this to happen can be (Rob, 2003):
The lack of consideration towards user needs;
Elevated cost of existing applications;
The need to learn the way they function and
operate.
At requirement level, we verify an almost total
need of community involvement since the very
beginning. Meaning, users and developers must
work directly together in the project. Only in this
way can projects be realistic, reasonable and
sustainable (Weiner, 2002).
1.4 Google API and Google Maps
Google Maps API (Application Programming
GEODADIVAS - Geographic Information Systems for Blood Donation Management in Portugal
451

Interface) is a survey and map visualization free
service utilizing satellite images. Besides maps and
satellite images, it provides routes between pre-
determinate spots, zoom, dragging the map, among
others (Davis, 2006). It’s also possible to create a
KML (Keyhole Markup Language) archive with
coordinates and geometric forms in order to
visualize in the map presented by Google Maps
server (Davis, 2006).
The simplicity and open source methodology are
its biggest assets. The grabbing and dragging
possibility, increase or decrease zoom without big
delays in the web page are a few of the simple tasks
that favor it.
1.5 Motivation
The main motivation arises from the need of IPS to
improve the planning and management of mobile
blood collect places utilizing donors’ geographic
analysis without increasing costs. The authors
embraced this project, and implemented it during the
classes of the discipline Health Information Systems
I of the Master in Medical Informatics of the
University of Porto (SBIM, 2005).
2 OBJECTIVES
2.1 General Objective
To create an open source Geographic Information
System that would allow the graphic representation
of the information concerning blood donations,
using the IPS database and Google API.
2.2 Specific Objectives
To facilitate the analysis, in a geographic
context, of the blood campaign coordination
process;
To support the professionals in planning and
distributing resources for mobile collect posts;
To help the professionals define places and
dates of mobile collect posts, according to the
need to refill blood components stoking by
blood type;
To explore and deepen the existing knowledge
about GIS and its applications;
To describe the systems creation process,
exploring the motivation, difficulties and
potentialities founded.
3 METHODS
This work can be classified as an applied and
technological (Jung, 2009) research, because its goal
is the development of an application allowing the
graphic representation of blood donations in
Portugal.
Although this work has a statistical approach, it
incorporates qualitative standards. The two
methodologies are used to help carrying the whole
process.
The statistical analysis is present in the first data
approach and posterior interpretation. Deductive
processes are always associated with this type of
approach.
At the same time, a qualitative analysis of data
meaning and process is used thus enriching the
obtaining of results.
This work followed the following methodology:
Research of Google Maps API functionalities
and resources;
Initial data analysis, treatment and statistical
analysis of the data given by the IPS;
Survey of the geographic divisions of
Portugal;
Building a prototype, design and create the
database, design and implement the prototype;
Evaluation meetings with the project team in
order to improve the system;
3.1 Arquitecture
3.1.1 Requirements
Taking in account the overall characteristic of this
proposal, the requisites where analyzed and defined
by a multidisciplinary team composed of; a clinical
analysis technician, a nurse and a computing
engineer. For the application, the following
requisites where defined:
To show the blood donation in the map;
Allow that donation to be filtered by: Date,
District, Council, Lab results, Collect places,
Blood group, Rh factor, Gender, Age.
Show the collect posts and IPS, allow posts to
be filtered;
Develop the application using open source
technology.
3.1.2 Languages and Development Tools
The following guidelines where established to fulfill
the requisites:
The data server will be MySql;
The main developing language will be PHP
HEALTHINF 2010 - International Conference on Health Informatics
452
5.0, however JavaScript and HTML functions
will also be used;
Google Maps API 2.0 will be used;
In order to fulfil a good usability CSS and
JavaScript JQuery v.1.3.2 framework styles
will also be used.
All the tools and resources used in this
development are Open Source thus being in
conformity with one of the project goals.
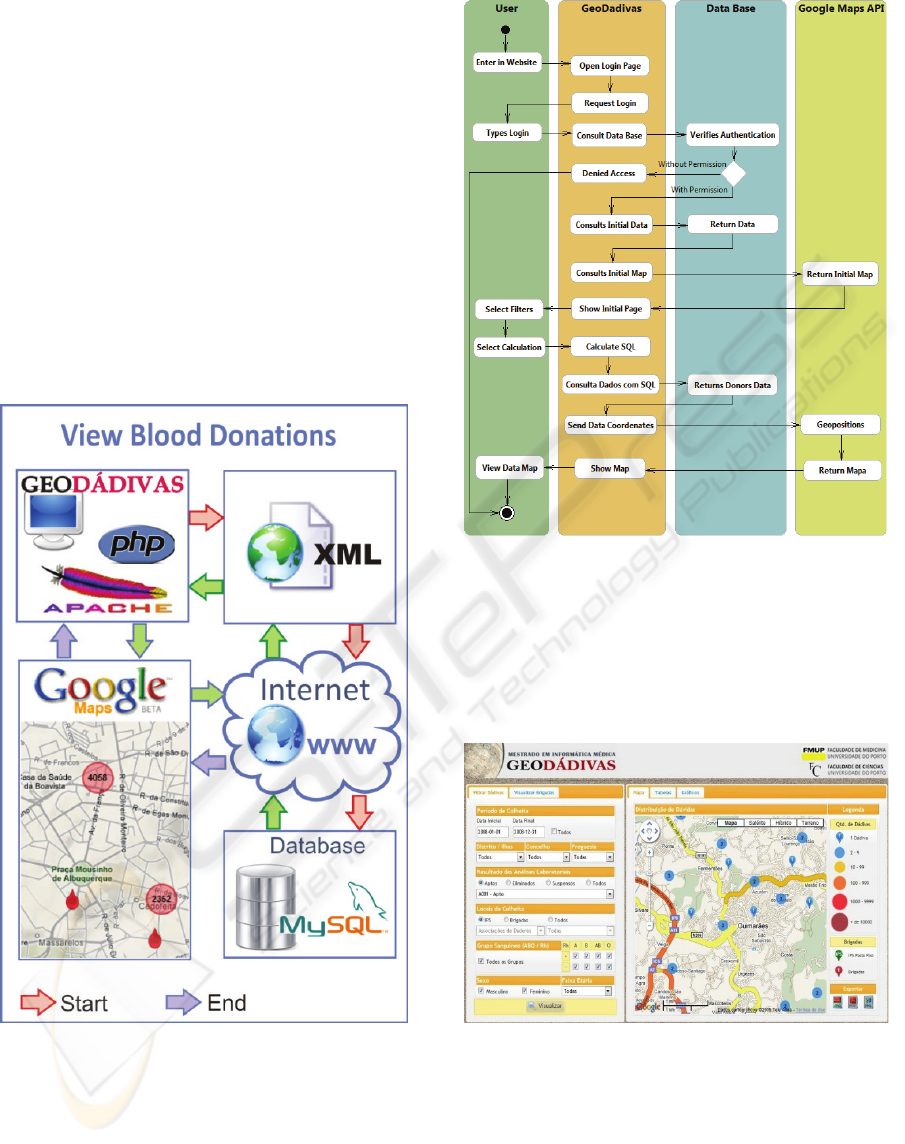
3.1.3 Diagrams
When open the software is carried out a query to the
database, to fill the respective fields of the filters.
The consultation of blood donations, according
to the selected filter is displayed in the software by
following iterations showed in figure 1.
Figure 1: Diagram: View Blood Donations.
The main activities diagram was elaborated
grouping activities by actors, as showed in figure 2.
Figure 2: Activities diagram.
3.2 Application Interface
The primary interface of the application has three
distinct parts, a header in the top of the page and two
columns, one of filters on the left and another of
results on the right as we can see in figure 3.
Figure 3: Main Application Window.
4 RESULTS
4.1 Data Analysis
The database used for the prototypes refers the blood
donations occurred in the northern region of
GEODADIVAS - Geographic Information Systems for Blood Donation Management in Portugal
453
Portugal between the years 2000-2008 (IPS, 2009).
The initial analysis revealed that the database
possessed approximately 634 000 entries with the
following variables: date, donor, place, year,
number, gender, birth date, marital status,
profession, zip code, place, total of donations, total
of donation in IPS, inscription hour, triage hour,
weight, height, max blood pressure, min blood
pressure, hemoglobin, blood type, Rh factor, triage
results, collect results and lab results.
It was possible to detect a certain degree of error
in some fields. There were more than 80% of
missing data in some fields (profession, weight,
height, max blood pressure, min blood pressure,
hemoglobin). Others presented serious typing errors
(place, inscription hour, triage hour). And some
presented mathematical inconsistency (total of
donations and total of donation in IPS). These fields
were not taken in consideration.
Some records from the triage collect and lab
results were missing. That didn’t represent a missing
value because a donor can make the registration and,
for some reason, leave without performing the
collect or refused to give. For that reason, the
queries that involve these fields just take in
consideration the non missing values.
After statistical analysis, we can verify that the
frequencies distribution is similar to the Portuguese
study of blood types (Duran, 2007) in which 46.6%
of the population has type A, 3.4% AB, 7.7% B and
42.3% O. In terms of Rh distribution, this also
happens. The distribution was 16.54% for Rh- and
83.45% for Rh+.
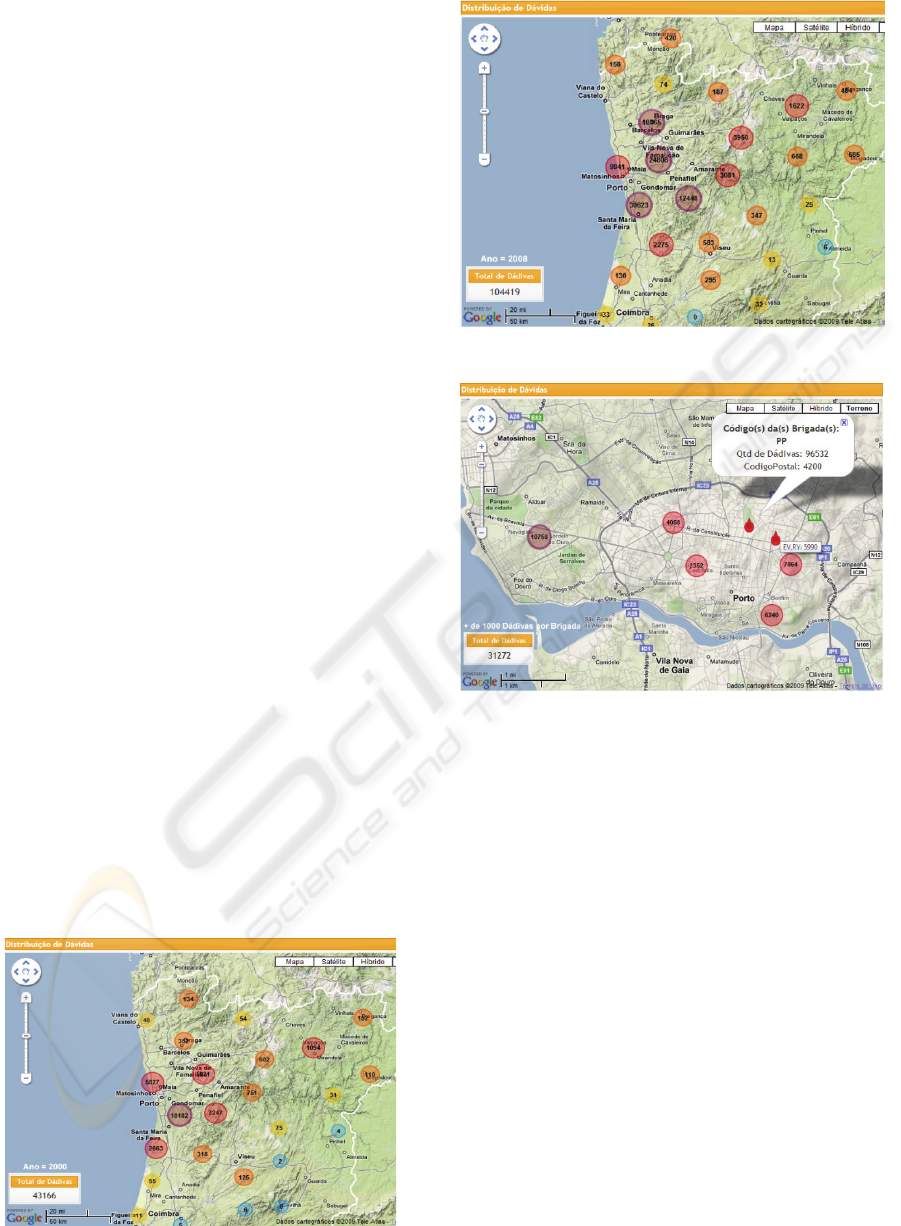
4.2 View Blood Donations
We can observe in figures 4 and 5 the evolution in
blood donations between the years 2000 and 2008.
The colored circles represent the number of donors
in that area and change according to the proportion
(from blue to dark red).
Figure 4: Blood donation in the year 2000.
Figure 5: Blood donation in the year 2008.
Figure 6: Blood collect places in Porto city and donors
distribution.
The blood collection places can also be
visualized as seen in figure 6. They’re marked by a
tear drop sign.
5 DISCUSSION
After the completion of this work we can realize that
the GIS development is a complex system that needs
much research.
The fact that it was developed by a multi-
disciplinary team was essential towards its
realization. The view of (a) the professional that is
integrated in the entity where the system will be
implemented (Clinical analysis technician),
combined with (b) the scientific analysis view from
other health care area and (c) the technologic
knowledge of the Informatics professional,
constituted an important point in its execution.
As the treatment and data manipulation revealed
itself a difficult task, the software development
HEALTHINF 2010 - International Conference on Health Informatics
454

became more complex.
We can conclude that all the initial project of
data treatment (analysis, integrity verification,
validation, and comparison with other scientific
studies already done), although having consumed the
majority of time spent, was crucial to final work
quality.
The frequencies of the variables in our system
are consistent with national published studies. This
gives us an additional prove of data integrity quality.
Initial tests revealed that a GIS Open Source
system is feasible in this context. Also we could
realize that (a) Google Maps API can support big
volume of data in each query, and that Web 2.0
technologies and JQuery UI Framework were a good
choice in this experimental project phase, especially
in relation with the user-system interaction.
The cluster method partially solved the graphic
visualization problem, reducing the markers’
quantity relatively close between themselves.
However, after system conclusion, we could verify
that clusters could easily create an optic illusion of
blood donation, when less zoom was utilized.
For future work we suggest that other functions
can be added and existing ones can be improved,
namelly:
possible use of colorized polygons that
delimitate cities can be used in replacement of
the cluster solution because they can facilitate
the visual interpretation;
more complex functions to establish relations
between different variables such as calculation
the distance between donor’s houses and
blood collection places;
determine with higher precision the location
of blood collect places with lowest
frequencies that represent high resources
consumption;
relate the population density with blood
donations in certain areas.
ACKNOWLEDGEMENTS
To the Porto Regional Blood Center of the
Portuguese Blood Institute, IPS (CRSP-IPS, IP) for
making it possible to use the database
To Dr. Jorge Condeço, Head Chief of the
Informatics/Hemovigilance department of the
CRSP-IPS, IPS for all the help and collaboration in
obtaining the data and its treatment, analysis and
comprehension.
REFERENCES
CDC, 2009. Centers for Disease Control and Prevention.
Access in: http://www.cdc.gov/gis/ August 2009.
Davis, S., 2006. Google Map API V2: Adding Where To
Your Applications. The Pragmatic Programmers LLc.
Duran. J. A., Chabert, T., Rodrigues, F., Pestana, D., 2007.
ABO: Distribuição dos Grupos Sanguíneos na
População Portuguesa. Revista de Medicina
Transfusicional. Nº 29 - 2007.
Goodliffe, P., 2006. Code Craft: The Practice of Writing
Excellent Code.
Jung, C. F., 2009. Metodologia Científica: ênfase em
pesquisa tecnológica. 4
th
edition. Access in:
http://www.jung.pro.br/,. August 2009.
Leitner H., McMaster R.B., Elwood S., McMaster S.,
Sheppard E., 2002. Models for making GIS available
to community organizations: dimensions of difference
and appropriateness. In Community Participation and
Geographic Information Systems.
Maged, N., Kamel, B., 2004. Towards evidence-based,
GIS-driven national spatial health information
infrastructure and surveillance services in the United
Kingdom, Bath.
IPS, 2009. Instituto Portugues de Sangue. Regional Porto
Blood Center Data.
Rob, M. A., 2003. Some challenges of integrating spatial
and non-spatialdatasets using geographical
information system. Information Technology for
Development.
SBIM, 2005. Master of Medical Informatics - University
of Porto. 2005 [cited 2009; Homepage of the Master
of Medical Informatics]. Available from:
http://mim.med.up.pt.
Sojka BN, Sojka P. The blood donation experience: self-
reported motives and obstacles for donating blood.Vox
Sang. 2008 Jan;94(1):56-63. PMID: 18171329
Vanmeulebrouk B, Rivett U, Ricketts A, Loudon M, 2009.
Open source GIS for HIV/AIDS management.
International Journal of Health Geographics 2008,
7:53.
Weiner, D., Harris, T. M., Craig, W. J., 2002. Community
participation and geographic information systems. In
Community Participation and Geographic Information
Systems. London.
GEODADIVAS - Geographic Information Systems for Blood Donation Management in Portugal
455
