
HEART RATE VARIABILITY MEASUREMENT USING THE
SECOND DERIVATIVE PHOTOPLETHYSMOGRAM
Mohamed Elgendi, Mirjam Jonkman and Friso DeBoer
School of Enigneering and Information Technology, Charles Darwin University, Australia
Keywords: Heart Rate, HRV, Plethysmography, SDPTG.
Abstract: Heart-rate monitoring is a basic measure for cardiovascular functionality assessment. The electrocardiogram
(ECG) and Holter monitoring devices are accurate, but their use in the field is limited.
Photoplethysmography is an optical technique that has been developed for experimental use in vascular
disease. Because of its non-invasive, safe, and easy-to-use properties, it is considered a promising tool that
may replace some of the current traditional cardiovascular diagnostic tools. A useful algorithm for a-wave
detection in the second derivative plethysmogram (SDPTG) is introduced for heart–rate monitoring. The
performance of the proposed method was tested on 27 records measured at rest and after exercise. Statistical
HRV measures can be calculated using the a-a interval of the SDPTG.
1 INTRODUCTION
Heart rate variability has considerable potential to
assess autonomic nervous system fluctuations in
normal healthy individuals and in patients with
various cardiovascular and non-cardiovascular
disorders. Heart rate variability (HRV) studies could
enhance our understanding of physiological
phenomena, the actions of medications, and disease
mechanisms.
Traditionally, HRV measures are based on
cardiac inter-beat intervals using the
electrocardiogram (ECG). Some practitioners,
however, have used a distal measurement of the
arterial pulse like the fingertip photoplethysmogram
to measure the heart rate. However, there are some
potential obstacles to obtaining precise inter-beat
intervals from arterial pressure pulses, especially
when measured from a distal source like fingertip
photoplethysmogram. The lack of sharp peaks in
blood pressure pulses compared to the R-peaks in
the ECG makes the accurate determination of heart
rate challenging. Also the shape and timing of the
pulse waveform may be influenced by ventricular
pressure, flow rate, time period, or other parameters
of cardiac output. Peripheral effects, such as changes
in vascular tone, may also influence distal pulse
peak detection.
(Berntson et al., 1997) reported these potential
drawbacks of the fingertip plethysomograph.
Therefore, they strongly advised the usage of R-R
intervals from ECG signals to determine interbeat
intervals. However, they also stated that “the use of
intra-arterial pressure pulses and a sophisticated
peak detection algorithm may be acceptable,” and
also recommended, Their opinion is that indirect
measures, such as photoplethymographic signals
require further validation.
(Giardino et al., 2002) proved that distal pulse
pressure is adequate for determining the heart rate
variability under resting conditions. Their results
provided grounds for some caution in the use of
finger plethysmography in experimental studies,
where manipulations may alter the relationship
between cardiac chronotropic control and distal
blood pressure changes in unpredictable ways. They
recommended further studies that include test–retest
reliability assessment of different data collection
techniques.
The the second derivative of
photoplethysmogram (SDPTG) was developed as a
method to allow more accurate recognition of the
inflection points and easier interpretation of the
original plethysmogram wave.
In literature, the second derivative of
photoplethysmogram (SDPTG) has also been called
acceleration plethysmogram (APG). In this paper,
the abbreviation SDPTG will be used.
82
Elgendi M., Jonkman M. and DeBoer F. (2010).
HEART RATE VARIABILITY MEASUREMENT USING THE SECOND DERIVATIVE PHOTOPLETHYSMOGRAM.
In Proceedings of the Third International Conference on Bio-inspired Systems and Signal Processing, pages 82-87
DOI: 10.5220/0002743300820087
Copyright
c
SciTePress

Figure 1: Signal Measurements (a) Original fingertip
photoplethysmogram (b) second derivative wave of
photoplethysmogram (SDPTG).
As shown in Fig.1, The heart beat in SDPTG
consists of four systolic waves and one diastolic
waven (Takazawa et al., 1993), namely a-wave
(early systolic positive wave), b-wave (early systolic
negative wave), c-wave (late systolic reincreasing
wave), d-wave (late systolic redecreasing wave) and
e-wave (early diastolic positive wave). The height of
each wave was measured from the baseline, with the
values above the baseline being positive and those
under it negative.
Because the peaks in the SDPTG signal are more
clearly defined than in the original
photoplethysmographic signal is more suitable for
accurate heart rate detection.
(Taniguchi et al., 2007) used a-a interval in the
second derivative photoplethysmogram instead of R-
R interval in the ECG to determine the heart rate
evaluating stress that surgeons experience.
To calculate the heart rate variability (HRV) using
the second derivative photoplethysmogram
(SDPTG), the accurate detection of individual a-
waves is a first essential step.
Although the clinical significance of using
SDPTG signals has been discussed, there is still a
lack of studies focusing on the automatic detection
of a-waves in SDPTG signals.
In this paper, we present an algorithm that can be
used to calculate the heart rate variability using the
finger photoplethysmograph. This investigation
aimed to develop a fast and robust algorithm to
detect a-waves in SDPTG signals. The SDPTG
waveform was measured in a population-based
sample of healthy males at rest and after exercise.
2 DATA
The photoplethysmograms of twenty seven healthy
males volunteers with a mean±SD age of 27±6.9
were measured by a photoplethysmograph (Salus),
equipped with a sensor located at the cuticle of the
second digit of the left hand. Measurements were
performed while the subject was at rest on a chair.
Data were collected at a sampling rate of 200Hz.
The duration of each data segment is 20 seconds.
The test was conducted from 20
th
of April to 5
th
of May 2006 at Northern Territory Institution of
Sport (NTIS).
All procedures were approved by the ethics
committee of Charles Darwin University. Informed
consent was obtained from all volunteers.
3 METHODOLOGY
An algorithm to detect a-waves is described below.
The algorithm consists of three main stages: pre-
processing, feature extractions and thresholding. The
structure of the algorithm is shown in Fig. 2.
Figure 2: Algorithm structure.
3.1 Pre-Processing
The pre-processing stage consists of two sub-stages:
bandpass filtering and taking the second derivative
of the photoplethysmogram.
3.1.1 Bandpass Filter
We remove the baseline wander and high
frequencies which do not contribute to a-waves
detection by using a second order Butterworth filter
with passband 0.5-10 Hz.
10Hz).5h(PTG[n],0Butterworts[n] −
=
Feature
Extraction
Pre-Processing
Result >
Threshold
Yes
PTG
Register
beat
Ignore
feature
No
HEART RATE VARIABILITY MEASUREMENT USING THE SECOND DERIVATIVE PHOTOPLETHYSMOGRAM
83
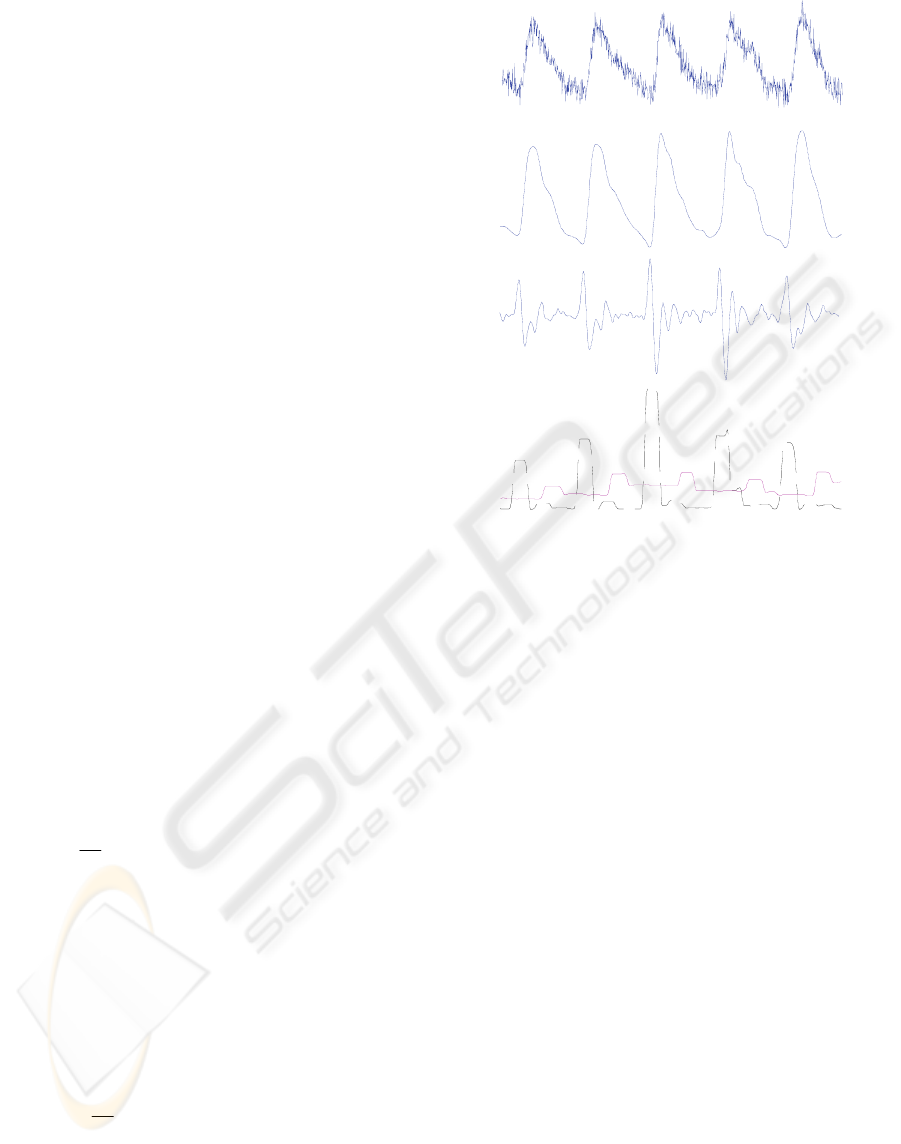
Fig. 3(b) is the result of applying a Butterworth filter
to the original signal shown in Fig. 3(a)
3.1.2 Second Derivative
z[n] shown in Fig. 3(c) is the second derivative of
the filtered photoplethysmogram s[n]. Inflection
points are seen as peaks in the SDPTG.
3.2 Feature Extraction
The feature extraction stage consists of two sub-
stages: squaring and selection of potential blocks.
3.2.1 Squaring
y[n] is the square of the SDPTG signal z[n].
Squaring the signal makes the results positive and
emphasizes large differences
3.2.2 Selection of Potential Blocks
We demarcate the onset and offset of the potential a-
waves in the SDPTG signals by using two moving
averages, based on the normal duration of the ab
interval which for a healthy adult is 187±17 ms.
For a sampling frequency of 200 Hz, the
maximum window size corresponding to the ab
interval is approximately 40 points and the
maximum window size corresponding to complete
heart beat interval is approximately 220 points. We
will use the maximum window sizes to detect a-
waves. The a-waves are detected by comparing two
moving averages.
First moving-window integration: The fist moving
average is., calculated as follows:
y[n]).......2)]-(W-y[n1)]-(W-(y[n
W
1
[n]MA
11
1
Peak
+++=
Where
40=
1
W which is the window width of ab
segment. The purpose of the first moving average,
shown as the dotted line in Fig. 3(d), is to emphasize
the a-wave.
Second Moving-window Integration: the second
moving average, shown as the solid line in Fig. 3(d),
is used as a threshold for the output of the first
moving-window integration.
y[n]).......2)]-(W-y[n1)]-(W-(y[n
W
1
[n]MA
22
2
MaxPeak
+++=
where
220=
2
W is the window width of a complete
heart beat.
01
0
.05
0
0
.05
0.1
6
4
2
0
2
4
6
8
8
6
4
2
0
2
4
6
8
0
100
200
300
400
500
600
700
800
90
0
5
1
5
2
5
x
10
Figure 3: Algorithm structure.(a) original SDPTG signal
(b) filtered PTG signal with Butterworth bandpass filter
(c) Second Derivative of PTG (d) generating blocks of
interest using two moving averages to detect a-waves.
When the amplitude of the first moving average
filter (MA
Peak
) is greater than the amplitude of the
second moving average filter (MA
MaxPeak
), that part
of the signal is selected as a block of interest, as
follows:
Fig. 3(d) shows an example of applying the two
moving averages.
We show four consecutive aa intervals in Fig. 3
(d) to demonstrate the idea of using two filters to
generate blocks of interest. Sometimes, blocks are
generated which do not represent potential a-waves.
These blocks are caused by noise and need to be
eliminated.
3.3 Thresholding
Blocks with a small width are considered as blocks
caused by noise. Blocks which are smaller than half
of the expected size for the ab interval are rejected.
IF [n]MA
Peak
>
[n]MA
MaxPeak
THEN
BLOCKS[n]
=1
ELSE
BLOCKS[n] =0
END
(a)
(b)
(c)
(d)
BIOSIGNALS 2010 - International Conference on Bio-inspired Systems and Signal Processing
84

Table 1:a-wave detection performance on SDPTG Data.
Before Exercise After Exercise 1 After Exercise 2 After Exercise 3
Record
No of
beats
TP FP FN
No of
beats
TP FP FN
No of
beats
TP FP FN
No of
beats
TP FP FN
A1
26 26 0 0 45 45 0 0 43 41 2 0 32 32 0 0
A2
24 24 0 0 44 44 0 0 47 47 0 0 46 46 0 0
B1
17 17 0 0 36 36 0 0 44 43 1 0 32 32 0 0
B2
26 26 0 0 43 43 0 0 38 38 0 0 30 30 0 0
C2
20 20 0 0 33 33 0 0 37 37 0 0 40 40 0 0
C3
20 20 0 0 30 30 0 0 23 23 0 0 Could not continue
D2
22 22 0 0 33 33 0 0 39 39 0 0 42 42 0 0
D3
19 19 0 0 23 23 0 0 27 27 0 0 30 30 0 0
E1
22 22 0 0 25 25 0 0 30 30 0 0 31 31 0 0
E2
22 22 0 0 25 25 0 0 30 30 0 0 31 31 0 0
E3
19 19 0 0 34 34 0 0 38 38 0 0 39 38 1 0
G2
30 30 0 0 48 48 0 0 48 48 0 0 49 49 0 0
G3
19 19 0 0 33 33 0 0 42 42 0 0 45 45 0 0
H3
23 23 0 0 31 31 0 0 32 32 0 0 32 32 0 0
I1
22 22 0 0 30 30 0 0 35 35 0 0 41 41 0 0
I2
17 17 0 0 28 28 0 0 31 31 0 0 31 31 0 0
J2
23 23 0 0 36 36 0 0 41 41 0 0 38 38 0 0
L2
24 24 0 0 36 36 0 0 37 37 0 0 30 30 0 0
L3
24 24 0 0 35 35 0 0 39 39 0 0 41 41 0 0
N2
18 18 0 0 23 23 0 0 24 24 0 0 33 33 0 0
N3
20 20 0 0 29 29 0 0 31 31 0 0 37 37 0 0
O1
24 24 0 0 29 29 0 0 33 33 0 0 38 38 0 0
O2
17 17 0 0 32 32 0 0 34 34 0 0 40 40 0 0
P1
26 26 0 0 35 35 0 0 34 34 0 0 36 36 0 0
P2
20 20 0 0 29 29 0 0 34 34 0 0 39 38 1 0
Q1
22 22 0 0 27 27 0 0 28 28 0 0 29 29 0 0
Q2
18 18 0 0 33 33 0 0 36 36 0 0 34 34 0 0
27
volunteer
s
584 584 0 0 885 885 0 0 955 952 3 0 946 944 2 0
The expected size for the ab interval is based on
the statistics for healthy adults, as described above.
We reject blocks that are smaller than 50% of the
width that is expected for the ab interval. This
corresponds to:
20KS)width(BLOC <
The rejected blocks are considered as noisy blocks
and the accepted blocks are considered to be
containing a-wave.
The maximum absolute value within each
accepted block is considered to be the a peak. For
this research the algorithm was tested using
annotated a peaks.
The proposed algorithm was tested on 27 SDPTG
records. The volunteers exercised three times. The
photoplethysmogram was recorded before starting
exercise and after each exercise period. Volunteer
C3 discontinued in the third exercise period. No
episodes have been excluded from our analysis
The exercise SDPTG data contains records of
normal SDPTG signals as well as records of SDPTG
signals that are affected by non-stationary effects,
low signal-to-noise ratio, and high heart rate. This
provides the opportunity to test the robustness of the
algorithm in detecting a-waves in SDPTG signals. a-
wave detection may be affected by the quality of the
SDPTG recordings and the irrigular heart rhythms in
the SDPTG signals.
The following statistical parameters were used to
evaluate the algorithm:
FPTP
TP
FNTP
TP
+
=+
+
=
P
Se
HEART RATE VARIABILITY MEASUREMENT USING THE SECOND DERIVATIVE PHOTOPLETHYSMOGRAM
85

True Positive (TP): a-wave has been classified as a-
wave.
False Negative (FN): a-wave has been missed.
False Positive (FP): Non a-wave classified as a-
wave.
The sensitivity Se is the percentage of true a-
waves that were correctly detected by the algorithm.
The positive predictivity +P is the percentage of
detected a-waves which are real a-waves.
Table I shows the result of a-waves detection in
27 different records of collected SDPTG before
exercise and after each of the three exercise periods,
containing a total of 3332 heart beats.
As shown in Table 1, records which have
relatively irregular fast heart beats signals like A1-
after exercise 2 , irregular fast heart beats with low
amplitudes like B1-after exercise 2, and non-
stationary SDPTG with irregular fast heart beats and
low amplitudes like E3-after exercise 3 contain a
few false positives (FP).
The number of false negatives (FN) was zero. The
overall average sensitivity for a-waves detection was
100% and the positive predictivity was 99.88%.
4 DISCUSSION
The major reason for the interest in measuring heart
rate variability stems from its ability to predict
survival after a heart attack. In ECG signals analysis,
the interval between adjacent QRS complexes is
termed as the normal to normal (NN) or the R to R
(RR) interval. Heart rate variability (HRV) refers to
the beat-to-beat alterations in heart rate. The results
of a HRV analysis portray the physiological
condition of the patient and are an important
indicator of cardiac disease. Many studies have
shown that reduced HRV predicts sudden death in
patients.
The detection of R peak is the main step to
measure HRV. Precise R-R interval calculations are
necessary to accurately depict the physiological
state. (John, 2000) found that more than 26 different
types of arithmetic manipulations of R-R intervals
have been described in the literature to represent
HRV.
The Task Force of the European Society of
Cardiology and the North American Society of
Pacing and Electrophysiology (Task Force of the
European Society of Cardiology and the North
American Society of Pacing and Electrophysiology,
1996) suggest a number of simple time domain
measures to estimation HRV. It has been discussed
in their paper that the HRV is calculated using the
mean the standard deviation of the length of the
cardiac cycle. This can be determined using either
the R-R intervals of a short ECG segment or the. a-a
intervals With these methods either the heart rate or
the a-a intervals a and SDPTG signal. Table 2 shows
some simple time–domain HRV variables: MAX-
MIN, SDNN, RMSSD, and SDSD that can be
calculated based on SDPTG signals.
Table 2: HRV Statistical Variables.
variable Statistical measurement
MAX-MIN
Difference between shortest and longest a-a
interval
SDNN Standard deviation of all a-a intervals
RMSSD
Root mean square of the difference of
successive a-a intervals
SDSD
Standard deviation of of differences between
adjacent a-a intervals
5 CONCLUSIONS
The second derivative of the photoplethysmogram
(SDPTG) can be used to calculate heart rate
variability provided the a-waves can be detected
accurately. Therefore, we propose an algorithm to
detect a-waves in SDPTG signals with a high
frequency noise, low amplitude, non-stationary
effects, irregular heart beat and after exercise. It
achieved an overall average sensitivity for a-waves
detection 100% and a positive predictivity was
99.88%. over 27 records, containing a total of 3370
heart beats.
The accurate detection of a-waves in the SDPTG
offers a non-invasive method of evaluating cardiac
functioning. The usage of SDPTG can be useful for
HRV analysis and identification of individuals at
risk.
ACKNOWLEDGEMENTS
The authors would like to thank Aya Matsuyama for
collecting the data.
REFERENCES
Berntson, G., Jr Bigger, J., Eckberg, D., Grossman, P.,
Kaufmann, P., Malik, M., Nagaraja, H., Porges, S.,
BIOSIGNALS 2010 - International Conference on Bio-inspired Systems and Signal Processing
86

Saul, J., Stone, P. & Van Der Molen, M. (1997) Heart
Rate Variability: Origins, Methods, And Interpretive
Caveats. Psychophysiology. , 34, 623-48.
Giardino, N., Lehrer, P. & Edelberg, R. (2002)
Comparison Of Finger Plethysmograph To Ecg In The
Measurement Of Heart Rate Variability.
Psychophysiology, 39, 246-253.
John, D., & Catherine, T. Macarthur Research Network
On Socioeconomic Status And Health. (2000) Heart
Rate Variability.
Takazawa, K., Fujita, M., Kiyoshi, Y., Sakai, T.,
Kobayashi, T., Maeda, K., Yamashita, Y., Hase, M. &
Ibukiyama, C. (1993) Clinical Usefulness Of The
Second Derivative Of A Plethysmogram (Acceralation
Plethysmogram). Cardiology, 23:207-217.
Taniguchi, K., Nishikawa, A., Nakagoe, H., Sugino, T.,
Sekimoto, M., Okada, K., Takiguchi, S., Monden, M.
& Miyazaki, F. (2007) Evaluating The Surgeon's
Stress When Using Surgical Assistant Robots. Robot
And Human Interactive Communication, 2007. Ro-
Man 2007. The 16th Ieee International Symposium
On, 888-893.
Task Force Of The European Society Of Cardiology And
The North American Society Of Pacing And
Electrophysiology (1996) Heart Rate Variability:
Standards Of Measurement, Physiological
Interpretation, And Clinical Use. Circulation, 93,
1043-1065.
HEART RATE VARIABILITY MEASUREMENT USING THE SECOND DERIVATIVE PHOTOPLETHYSMOGRAM
87
