
RESPONSE AND CONTROL OF HEART RATE VIA POSTURE
AND MOVEMENT
Martin Wieser
1,2
, Rafael M Ruest
1,3
, Lilith Bütler
1,4
and Robert Riener
1,2
1
Sensory-Motor Systems Lab, Institute of Robotics and Intelligent Systems (IRIS)
ETH Zurich, Tannenstrasse 1, 8092 Zurich, Switzerland
2
Spinal Cord Injury Center, University Hospital Balgrist, Switzerland
3
Institute of Human Movement Sciences and Sport, ETH Zurich, Switzerland
4
HUMAINE Clinic Zihlschlacht, Switzerland
Keywords: Cardiovascular system, Mobilization, Tilt table, Heart rate, Control, Rehabilitation.
Abstract: After a few days of immobilization, patients need some form of treatment to stabilize their cardiovascular
system. It is known that mobilization has a major influence on the cardiovascular system and, therefore, is
an important component in neurorehabilitation. In this study a strategy is presented to control the heart rate
using two mechanical stimuli: body inclination angle and stepping frequency. First, we could show that the
heart rate of healthy subjects, as well as minimally conscious patients, shows a clear and repeatable
response to body tilting and stepping. Furthermore, first experiments demonstrated the feasibility to control
the heart rate of healthy subjects. Future experiments are required to optimize the control strategy with
healthy subjects and to present the feasibility of the controller for use with patients. The long term goal will
be to control heart rate, systolic and diastolic blood pressure, as well as respiration frequency, in order to
stabilize the patients’ cardiovascular system and improve their health state with a reduced amount of
pharmaceutical medication.
1 INTRODUCTION
An important therapeutic strategy in an early phase
of neurorehabilitation is mobilization by stepping of
the legs, and body tilting. Leg mobilization itself has
a major influence on the cardiovascular system.
Cardiovascular adaptation to an upright posture
depends on the proper interplay of the hemodynamic
system and the reflex mechanism that maintain
blood pressure homeostasis (Held, 2004; Hainsworth
and Al-Shamma, 1988).
First applications with the dynamic tilt table
Erigo showed a positive effect on blood circulation
in healthy adults (Czell et al., 2004) as well as in
patients (Luther et al., 2008). The Erigo enables two
sensory stimulation inputs to be applied. Firstly, the
subject can be tilted to different inclination angles
and secondly, the legs can be mobilized by a
stepping pattern. During tilting the stepping
mechanism supports blood circulation, providing a
significant reduction in the number of syncopes
observed by Czell (2004) and Luther (2008). As a
consequence, it was possible to integrate body tilting
more intensively into patient therapy and, hence,
improve the rehabilitation process.
In this project we investigated the relationship
between the two inputs provided by the Erigo, and
the cardiovascular output of the human. Many
research groups have previously performed classical
tilt table experiments to show a steady state response
of heart rate (HR) as well as blood pressure and the
occurrence of syncopes (Hainsworth and Al-
Shamma, 1988; Mukai and Hayano, 1995; Petersen
et al., 2000). However, an open question remains as
to how well the cardiovascular system reacts to
simultaneous leg mobilization and body tilting.
Thus, in our study, continuous data were measured
in order to observe also the behavior during the
transient state in the tilting phase, in addition to a
steady state.
The results presented in this paper show the
reaction of the HR in healthy subjects and minimally
conscious patients. Based on these results we
performed a first feasibility study to control the HR
of healthy subjects.
Our results form the basis to control the
77
Wieser M., Ruest R., Bütler L. and Riener R. (2010).
RESPONSE AND CONTROL OF HEART RATE VIA POSTURE AND MOVEMENT.
In Proceedings of the Third International Conference on Health Informatics, pages 77-81
DOI: 10.5220/0002743400770081
Copyright
c
SciTePress
cardiovascular output also for patients in order to
stabilize their clinical state with a reduced amount of
drugs.
2 METHODS
2.1 The Erigo System
The tilt table Erigo (Hocoma AG, Switzerland)
combines a continuously adjustable tilt table with an
integrated motor-driven stepping device (Figure 1).
The tilt angle α
tilt
can be adjusted between 0° and
76° (velocity: 3.4°/s), whereas, the stepping
frequency f
step
can be continuously adjusted up to 80
steps per minute (one leg: 40 steps per minute;
stepping frequency f
step
=0.67Hz). The duration of
extension and flexion phase is identical and the leg
elements move with a 180° phase shift to each other
at a constant speed.
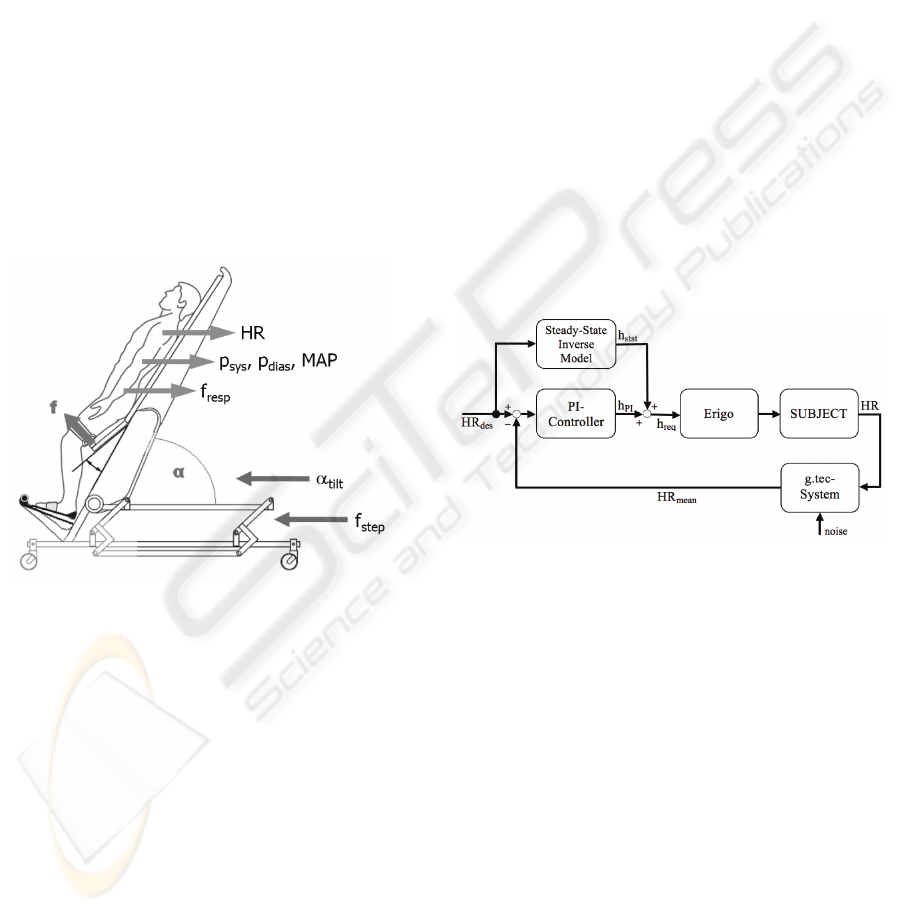
Figure 1: Measurement setup with the tilt table Erigo and
the input variables tilt angle α
tilt
(normalized height
h
norm
=sin(α
tilt
)) and stepping frequency f
step
. The
physiological output signals are: Heart rate HR, systolic,
diastolic and mean arterial blood pressure p
sys
, p
dias
and
MAP, as well as respiration frequency f
resp
.
The trunk and hip are tightly fixed by a belt
system and the head is stabilized with a neck
cushion that is shapeable according to the individual
needs of the subjects. The feet are attached on two
separate mobile footplates and Velcro® strips fasten
the legs to an end-effector of the Erigo in order to
perform reproducible standardized movements. The
Erigo allows a highly synchronized movement of the
hip, knee and ankle of the left and right leg. In
contrast to real human gait, however, subjects move
their legs in only a vertical but not in horizontal
direction.
2.2 The Measurement System
HR and respiration frequency f
resp
were acquired
with a g.tec recording system from Guger
Technologies (Austria). For the ECG recording lead
I and II of the Einthoven’s triangle were used. A
flow sensor to monitor changes of temperature of
breathing (nose and mouth) captures the respiration
signal. All electrode and sensor signals are collected
via the g.tec system and the continuous blood
pressure signal is acquired noninvasively by a
CNAP Monitor 500 from CNSystems AG (Austria).
The monitor provides beat-to-beat values for
systolic, diastolic and mean blood pressure p
sys
, p
dias
and MAP that is fed into the g.tec system under
conditions of chronological synchronism.
2.3 Control Strategy
In this paper the focus is on a control strategy for the
HR signal. A feedforward – feedback structure is
used and the desired heart rate HR
des
is given by the
investigator (Figure 2).
Figure 2: Overview of the control strategy. HR = heart
rate; HR
des
= desired HR; h
stst
= corresponding normalized
height to a desired HR; h
PI
= output of the controller; h
req
=
required normalized height; HR
mean
= mean of the
measured HR during 20s.
In the feedforward loop a steady state inverse
model describes the physiological reaction of the
subject to the change of the height of the heart in the
steady state. The normalized height h
norm
in all
subjects is determined by h
norm
=sin(α
tilt
). To describe
the dependence between the change of the
normalized height of the subject’s heart h
norm
and the
expected HR a 2
nd
order polynomial function is
used. The expected normalized height for a desired
steady state h
stst
is the first input for the plant of the
controller.
This height together with the output of the PI-
controller h
PI
determines the required height h
req
fed
to the Erigo. The PI-controller is given by the
structure
HEALTHINF 2010 - International Conference on Health Informatics
78
G(s) = K
p
+
1
T
N
s
= K
p
1+
K
I
K
p
1
s
⎛
⎝
⎜
⎜
⎞
⎠
⎟
⎟
,
(1)
whereas, K
p
is the gain and K
I
=T
N
-1
=K
p
=1.3.
By means of a control signal to the Erigo the
subject is tilted to the required height h
req
and the
resulting HR is acquired by the g.tec system. An
adaptive threshold algorithm (Christov, 2004) is
applied to detect the actual HR, whereas, every 20s a
mean value is identified. To emphasise on the latest
detected HR values (during the period of 20s) a
linear weighting function is used. This mean value
HR
mean
will be compared with the desired HR value
HR
des
and fed into the PI-controller. The output h
PI
is
only modified when the measured value HR
mean
differs more than 10% of the desired value HR
des
.
3 EVALUATION
3.1 Subjects
Eight healthy subjects (5 female and 3 male) with no
history of neurological, psychiatric or cardiovascular
disorder and an average age of 24.9 years (SD:
±2.23 years), weight of 60.9 kg (SD: ±6.85 kg) and
height of 174.9 cm (SD: ±7.61 cm) participated in
this study.
Further, 3 minimally conscious patients (1
female and 2 male) with an average age of 52.6
years (SD: ± 8.96 years) were included in the study
42, 4 and 2 months after the incident. Glasgow
Coma Scale values of the patients vary between 6
and 10.
3.2 Protocol
A baseline measurement (duration: 10 minutes) was
performed before and after the intervention phase. In
the intervention phase, subjects were tilted four
times to a normalized height of either sin(20°),
sin(40°), sin(60°) or sin(76°) and back to 0 for 3
minutes (healthy subjects) or 5 minutes (patients)
each time. The procedure was performed for three
different stepping frequencies: 0, 24 and 48 steps per
minute.
For the control strategy a initial phase of 6
minutes was needed in order to identify the minimal
HR during baseline condition (h
norm
=sin(0°) during
the first 3 minutes) and maximum condition
(h
norm
=sin(76°) during the second 3 minutes). In the
following experiment the desired HR value HR
des
was exactly 50% of the evaluated difference
between HR at baseline and maximum condition.
The control strategy is shown in figure 2 and
after 10 minutes controlling the HR to 50%, the
desired HR went back to the value known from the
baseline condition.
3.3 Results
The evaluation of the steady state of the HR while
tilting a healthy subject and setting the stepping
frequency to 48 steps per minute is shown in figure
3. The corresponding HR values to the different
normalized heights are clearly distinguishable. In
general, the physiological system reacts with an
overshoot and turns back to a steady state after the
subject is tilted to a defined height (data not shown).
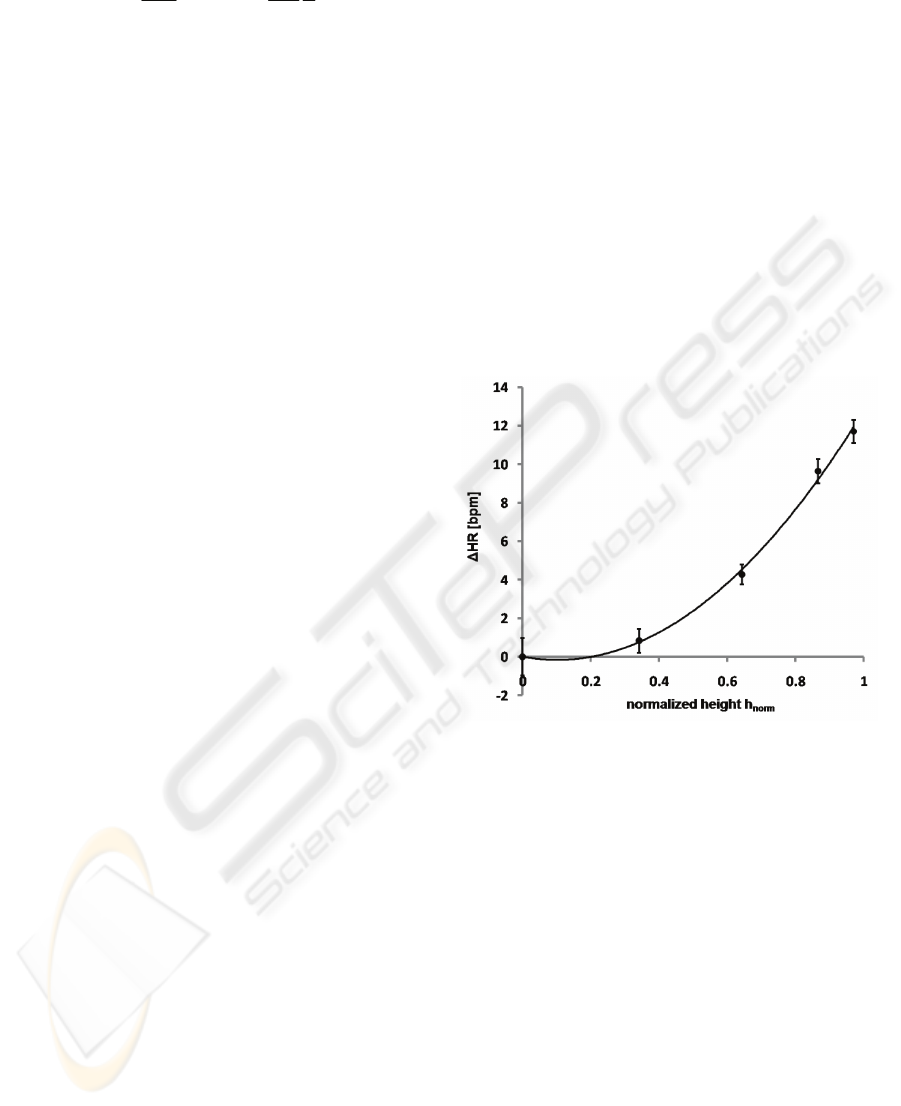
Figure 3: Steady state values (with standard deviation) of
the HR during different normalized heights for all subjects
(n=8). Stepping frequency was set to 48 steps per minute.
First, with stepping a steady state is reached
within the first minute, whereas, without stepping it
takes up to 3 minutes till a plateau is reached.
Second, without stepping the reached steady state is
up to 6 bpm higher.
The results of the feasibility study about
controlling HR via posture are shown in figure 4. In
the first 6 minutes the baseline and maximum
condition is evaluated. In baseline condition the
mean value for HR is 53bpm (0%) and after body
tilting to h
norm
=sin(76°) the value rises to 72 bpm
(100%). As a consequence, for the following 10
minutes the input for the controller is 62.5 bpm
(50%) and after this period the desired value
decreases back to 53 bpm (0%). The measured HR
shows a natural variability, nevertheless, the mean
value of the HR during the controlled period is 61.7
RESPONSE AND CONTROL OF HEART RATE VIA POSTURE AND MOVEMENT
79
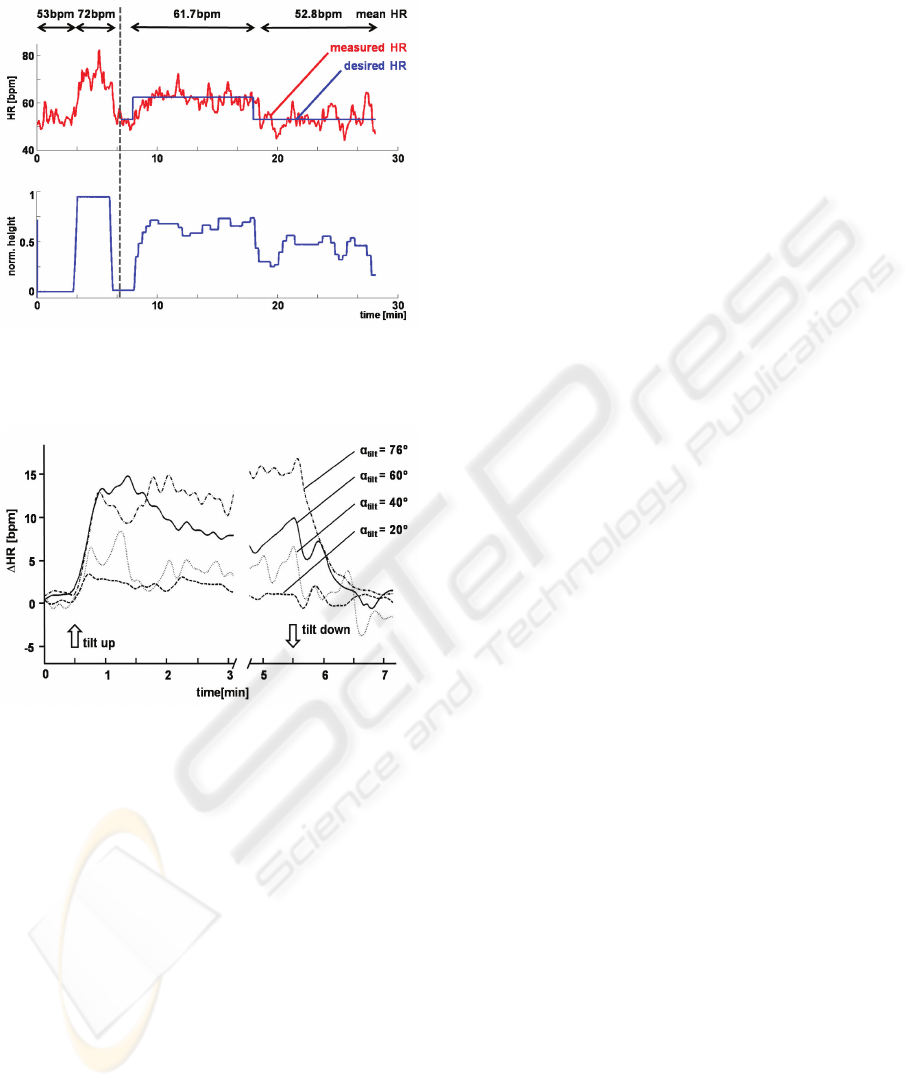
bpm (desired value: 62.5 bpm) and 52.8 bpm
(desired value: 53 bpm), respectively.
Figure 4: Controlled HR (measured HR) with the desired
HR (upper panel) and the corresponding normalized
height (lower panel).
Figure 5: Mean HR during different normalized heights
for all patients (n=3) during a stepping frequency of 48
steps per minute. The standard deviation for α
tilt
= 20°,
40°, 60° and 76° was 2.23 bpm, 3.45 bpm, 3.06 bpm and
5.50 bpm, respectively.
The patients’ data show a very similar behaviour to
different normalized heights while the stepping
frequency was also fixed to 48 steps per minute
(Figure 5). Generally, during the tilting phase the
variability is higher in patients compared to healthy
subjects. No clear steady state can be seen in the
data. With this preliminary data set, differences
regarding stepping and normalized heights are not
statistically significant.
3.4 Discussion
A general issue is the subjects inter- and intra-
variability between different measurements.
However, a relationship between mean HR and
different normalized heights can be clearly
demonstrated. Figure 3 shows mean values
composed of 8 healthy subjects and consequently,
most of the short-term variability is cancelled out in
that illustration.
Establishing a control strategy for cardiovascular
signals requires working with signals from
individual subjects. As shown in figure 4, even with
no control of the HR signal in the first 6 minutes the
natural short-term variability can be relatively high
(±5 bpm). For that reason it was necessary to
implement strategies that can cope with this
variability. Two issues are implemented to deal with
such a high variability: First, the normalized height
was only changed in the interval of 20s and, second,
the height was only modified when the measured
value differed more than 10% of the desired value.
Using such mechanisms it was not possible to
eliminate the variability, but during the two control
phases (2 times of 10 minutes) it could be shown
that the mean values (61.7 bpm and 52.8 bpm)
differed less than 1 bpm from the desired values
(62.5 bpm and 53 bpm). For a clinical application
the control of cardiovascular signals in longer time
periods is more important than short term effects.
Heart rate variability (HRV) is a sign of healthiness
and, therefore, it is worth to sustain it or perhaps to
support it. In contrast, in the long term it is
important for the cardiovascular system of patients
to be maintained within well defined bounds. Thus,
short term effects like the variability are not
essential for our control strategy and control over
longer periods is satisfactory.
The patients’ data also show a repeatable
response to different normalized heights.
Nevertheless, during the tilting phase no clear steady
state can be observed in the data (Figure 5). This
may be due to the small sample size (3 patients),
whereas, the data of healthy subjects is based on 8
persons. On the other hand minimally conscious
patients are clinically not stable and, therefore, it
could be that these patients don’t show a steady state
because of the medication or the individual injury.
The study is still in progress and more patients will
be assessed before drawing clear conclusions based
on the acquired data of patients.
4 CONCLUSIONS & OUTLOOK
We conclude that the HR of healthy subjects as well
as of patients in minimally conscious state shows a
clear response to different normalized heights. With
HEALTHINF 2010 - International Conference on Health Informatics
80

the presented control strategy it is possible to control
the HR of healthy subjects.
Future work will be done to arrange more
experiments with healthy subjects in order to
optimize the control strategy. Additionally, more
patients will be included into the study to get refined
results about their cardiovascular response. To
understand the patients’ behaviour in a better way
will give us the opportunity to adjust the control
strategy for needs in the rehabilitation process.
The long term goal will be to find robust
behaviours of cardiovascular signals to investigate
control strategies based on HR, systolic and diastolic
blood pressure as well as respiration frequency. This
would establish a basis to influence the
cardiovascular system of patients in order to
stabilize their clinical state without additional drugs.
ACKNOWLEDGEMENTS
This work was supported by the National Center of
Competence in Research (NCCR) on Neural
Plasticity and Repair funded by the Swiss National
Foundation (SNF).
Special thanks to Heike Vallery, Gery Colombo,
Jan Lichtenberg, Marc Lawrence, Claudia Fischer
and Khanh Nguyen for their technical support as
well as Jenny Haefeli, Ximena Omlin, Esther Keller,
Clemens Gutknecht, Josef Ludwig Schönberger and
Daniel Zutter for their clinical support during the
study.
REFERENCES
Christov, I. I., 2004. Real time electrocardiogram QRS
detection using combined adaptive threshold.
BioMedical Engineering OnLine 3:28
Czell, T., 2004. Influence of passive leg movements on
blood circulation on the tilt table in healthy adults. J
Neuroeng Rehabil, 2004. 1(1): p. 4.
Hainsworth, R. and Al-Shamma, Y. M. H., 1988.
Cardiovascular-Responses to Upright Tilting in
Healthy-Subjects. Clinical Science 74(1): 17-22.
Heldt, T., 2004. Computational models of cardiovascular
response to orthostatic stress. Division of Health
Sciences and Technology. Cambridge, Massachusetts
Institute of Technology.
Luther, M. S., Krewer, C. et al., 2008. Comparison of
orthostatic reactions of patients still unconscious
within the first three months of brain injury on a tilt
table with and without integrated stepping. A
prospective, randomized crossover pilot trial. Clin
Rehabil 22(12): 1034-41.
Mukai, S. and Hayano, J., 1995. Heart rate and blood
pressure variabilities during graded head-up tilt. J
Appl Physiol 78(1): 212-216.
Petersen, M. E. V., Williams, T. R., et al., 2000. The
normal response to prolonged passive head up tilt
testing. Heart 84(5): 509-514.
RESPONSE AND CONTROL OF HEART RATE VIA POSTURE AND MOVEMENT
81
