
A MODEL OF PRIMATE PHOTORECEPTORS
Hugo R. Gonc¸alves and Miguel V. Correia
Instituto de Engenharia de Sistemas e Computadores do Porto
Universidade do Porto, Faculdade de Engenharia, Dept. Eng. Electrot´ecnica e de Computadores
R. Dr. Roberto Frias, 4200-465 Porto, Portugal
Keywords:
Retina model, Primate, Adaptation, Bleaching, Photoreceptors, Cone, Rod.
Abstract:
As experimental research reveals the biological mechanisms behind the processing done by the retina, com-
plete models of the retina become more and more possible. This paper presents a temporal model of primate
photoreceptors inspired by the mechanisms discovered in other species. It implements light adaptation based
on pigment bleaching and biochemical reactions. The simulation provides similar results to experiments made
in impulse, contrast and sensitivity response curves of primate cones and rods.
1 INTRODUCTION
The body of information resultant from investigating
the physiology and anatomy of the mammalian retina
has revealed several mechanisms that work together
to process visual signals. In contrast, monkey retina,
the one most similar to the human retina with the ex-
ception of apes, is less examined. Nevertheless, pri-
mate and other mammals’ retinae seem to process vi-
sual signal in the same way (Perlman and Normann,
1998; Masland, 2001).
A model of the primate retina is more desirable
than others due to the resemblance to the human
retina, which makes it the best candidate for neural
prostheses and more adequate to provide input to hu-
man visual cortex models.
The first model describing the behaviour of pri-
mate photoreceptors and horizontal cells was intro-
duced by (van Hateren, 2005), who compared his
model results with experimental results of horizontal
cells. van Hateren work continued by adding spa-
tial calculation in the horizontal cell network (van
Hateren, 2007) and pigment bleaching in cones (van
Hateren and Snippe, 2007). However, the confronta-
tion of results is only done in horizontal cells.
The model presented here was implemented in
Matlab Simulink® and is intended to i) simulate pri-
mate photoreceptors in time, ii) use biological plau-
sible mechanisms and iii) simple equations with pos-
sibility of implementation in hardware. The model
implements both cones and rods and light adaptation
in cones, in the form of pigment bleaching and bio-
chemical adaptation.
Section 2 describes the model, Section 3 defines
the values of the model parameters and their source,
Section 4 compares the model results with experimen-
tal results of primates and Section 5 concludes the pa-
per.
2 METHODS
The model simulates two types of photoreceptors,
cones and rods, in time, in millisecond steps. Photore-
ceptors transduce light into voltage. Rods are much
more sensitive to light than cones, and are responsible
for vision under scotopic light levels. Under photopic
light, rods saturate and cones adjust their sensitivity
and operating point to the ambient light.
2.1 Cones
Although in real retinas, both rods and cones adapt
to light, adaptation was only integrated into cones
in the model. Two forms of adaptation were imple-
mented: pigment bleaching and calcium-dependent
adaptation.
2.1.1 Pigment Bleaching
During absorption of photons, photoreceptor pigment
bleaches and induces a chain of reactions that con-
277
Gonçalves H. and Correia M. (2010).
A MODEL OF PRIMATE PHOTORECEPTORS.
In Proceedings of the Third International Conference on Bio-inspired Systems and Signal Processing, pages 277-283
DOI: 10.5220/0002746102770283
Copyright
c
SciTePress

verts light into electrical signal. The pigment is then
unbleached at a certain rate. Following the conclu-
sions of (Mahroo and Lamb, 2004), human bleaching
has slow, rate-limited dynamics. For a certain amount
of steady light I, the fraction of unbleached pigment
P follows Eq. 1:
∂P
∂t
=
K
m
· (1− P)
K
m
+ (1− P)
·
1
τ
b
| {z }
recovery
− σ · I · P
| {z }
bleaching
, (1)
where σ is the cone photosensitivity, τ
b
is the recov-
ery time constant and K
m
is a constant defining the
range in which pigment bleaching is rate-limited. For
values of P ≈ 1, the dynamics of the recovery pro-
cess reduces to first-order, with time constant τ
b
. As
P decreases and 1 − P becomes greater than K
m
, the
recovery process loses dependence on P and the dy-
namics become rate-limited. The equivalent light af-
ter bleaching is I
b
= I · P.
Pigment bleaching has the very important role of
limiting the amount of photoconversion happening
under very bright light. Under such conditions, any
increase in light is counteracted in the long-term by
the reduction in the fraction of unbleached pigment,
and the amount of photoconversionremains the same.
2.1.2 Calcium-dependent Adaptation
The chain of reactions triggered by photon absorption
starts by pigment bleaching, which in turn activates
the enzyme phosphodiesterase(PDE). This two-stage
chain can be modeled by two first-order low-pass fil-
ters, converting I
b
to PDE
∗
(activated PDE molecule)
with no gain. Each PDE
∗
hydrolyzes the second mes-
senger cGMP (Cyclic Guanosine Monophosphate) at
a rate β
cGMP
, reducing its concentration. The synthe-
sis of cGMP is controlled by guanylate cyclase ac-
tivity (α
cGMP
). Thus, the variation of cGMP can be
formulated as (Soo et al., 2008)
∂cGMP
∂t
= α
cGMP
− β
cGMP
· PDE
∗
· cGMP. (2)
The cGMP controls channels in the cone outer seg-
ment (more cGMP, more channels open). The chan-
nels regulate the light-sensitive circulating current
into the cone inner segment (Perlman and Normann,
1998). In vertebrates, light adaptation is controlled by
Ca
2+
concentration in photoreceptor outer segment
(Fain et al., 2001; Koutalos and Yau, 1996; Perlman
and Normann, 1998). As the light-sensitive channels
are closed with light, the Ca
2+
concentration (Ca
C
)
is reduced proportionally (Koutalos and Yau, 1996)
(Ca
C
∝ cGMP). This reduction leads to a) disin-
hibiton of guanylate cyclase activity, accelerating the
rate of cGMP synthesis and b) reduction in PDE ac-
tivation rate, diminishing cGMP hydrolysis (Koutalos
and Yau, 1996). Both effects raise the equilibrium
cGMP concentration. Thus, two negative feedbacks
are used to control light adaptation. Therefore, the
cone adaptation is formulated as
∂cGMP
∂t
= α
cGMP
· η(Ca
C
) (3)
−β
cGMP
· cGMP· (PDE
∗
· γ(Ca
C
) + 1).
The + 1 term correspondsto the currentunderdark
conditions (dark current). Eq. 3 states that under
steady luminance (constant Ca
2+
concentration), the
response to a contrast step will be
cGMP =
α
cGMP
· η(Ca
C
)
β
cGMP
· (PDE
∗
· γ(Ca
C
) + 1)
. (4)
This is the same expression as the Michaelis re-
lation cGMP = cGMP
max
· I
0
/(I + I
0
), where I
0
=
1/γ(Ca
C
), I = PDE
∗
and cGMP
max
= α
cGMP
·
η(Ca
C
)/β
cGMP
. The relation η(Ca
C
) was modified
from (Koutalos and Yau, 1996)and γ(Ca
C
) was found
to give the best fit when a linear relation is estab-
lished:
γ(Ca
C
) = [γ
a
Ca
C
+ γ
b
]
+
(5)
η(Ca
C
) = η
max
1
Ca
C
+ η
h
, (6)
where γ
a
and γ
b
are constants, [·]
+
is equivalent to
max(·,0), and η
max
is the maximum value of η, when
Ca
C
≪ η
h
. Reducing Ca
2+
concentration a) de-
creases γ (because γ
a
is positive) and shifts the half-
saturation constantI
0
to higher valuesandb) increases
η and consequently cGMP
max
. For the sake of sim-
plicity, Ca
C
is equal to cGMP.
2.1.3 Inner Segment
The inner segment of the photoreceptors integrate cir-
culating current into the membrane potential, much
like any neuron does. The conductance-based model
of the neuron (Hodgkin and Huxley, 1952) was used
here. Briefly, the neuron is composed by a group of
conductances, each pulling the membrane potential to
its reversal potential. A leakage current pulls the neu-
ron potential to rest. In its general form, the mem-
brane potential V is defined as
C
∂V
∂t
= G
ex
(V
ex
−V)+G
in
(V
in
−V)+G
leak
(V
leak
−V),
(7)
BIOSIGNALS 2010 - International Conference on Bio-inspired Systems and Signal Processing
278

Figure 1: Model of photoreceptors.
where C is the membrane capacitance, G
ex
and V
ex
are the excitation conductance and reversal potential,
G
in
and V
in
are the inhibition conductance and rever-
sal potential, and G
leak
and V
leak
are the fixed leakage
conductance and resting potential.
In order to simplify parameter choice, conduc-
tance and capacitance values were normalized to
G
leak
, i.e.,
τ
C
∂V
∂t
= g
ex
(V
ex
− V) + g
in
(V
in
− V)+ (V
leak
− V),
(8)
where
g
ex
=
G
ex
G
leak
, g
in
=
G
in
G
leak
, τ
C
=
C
G
leak
.
In the rest of the article, when referring to conduc-
tances, they are normalized. Unless stated otherwise,
V
leak
= −72mV, V
in
= −80mV and V
ex
= 0mV.
Additionaly, neurons can have gap-junction con-
ductances. This conductance is the electrical coupling
between neurons close enough to each other, that ions
are transferred by diffusion to the neuron with a lower
concentration. Gap-junctions can be made with neu-
rons of the same (homotypic) or different types (het-
erotypic coupling). For heterotypic coupling, the gap-
junction conductance can be added to Eq. 8 in the
following way:
τ
C
∂V
∂t
=
∑
x
g
x
(V
x
− V) + g
gap
(V
n
− V). (9)
g
gap
is the strength of the junction (higher values
mean more diffusion) and V
n
is the membrane poten-
tial of the adjacent neuron of the other type. For re-
ciprocal conductances, this term should be added to
the equations of both neurons. Cones make recipro-
cal gap-junctions with rods (Hornstein et al., 2005;
Schneeweis and Schnapf, 1999).
Cone inner segment model was inspired by the
simple, but effective work of (Baylor et al., 1974), in
which the inner segment is composed of a leakage, a
light-sensitive (g
i
) and a voltage-dependent (g
f
) cur-
rents. g
i
bears a close resemblance to the steady-
state form of cGMP (Eq. 4). g
f
is a sigmoidal
function of the cone voltage. This conductance is
named here g
h
to demark that it is equivalent to the
hyperpolarization-activated current, and is expressed
as
g
h
(V) =
g
h
max
1+ exp
V−V
f
k
, (10)
followed by a low-pass filter with time constant τ
h
.
The reversalpotentialV
h
of this conductance was con-
sidered to be -30 mV (Bader et al., 1982).
In sum, the cone equation is
τ
C
∂V
∂t
= cGMP· (0− V) + g
h
· (V
h
− V)
+(V
leak
− V) + g
gap
· (V
rod
− V),(11)
with cGMP ruled by Eq. 3, g
h
ruled by Eq. 10 and
V
rod
is the potential of the coupled rod.
2.2 Rods
Rods have very slow dynamics, which allows them to
integrate more light, becoming more sensitive.
For simplification, light adaptation was not imple-
mented in rods. In that sense, pigment bleaching is
ignored and the cGMP synthesis and hydrolysis are
not controled by calcium concentration, changing Eq.
3 to
∂cGMP
∂t
= α
cGMP
− β
cGMP
· cGMP· (PDE
∗
· γ+ 1).
(12)
A MODEL OF PRIMATE PHOTORECEPTORS
279
The γ factor is a constant for rods, and am-
plifies the hydrolysis of cGMP by PDE∗. The
hyperpolarization-activated conductance g
h
also ex-
ists in rods.
In sum, the rod equation is
τ
C
∂V
∂t
= cGMP· (0− V) + g
h
· (V
h
− V)
+(V
leak
− V) + g
gap
· (V
cone
− V),(13)
with cGMP ruled by Eq. 12, g
h
ruled by Eq. 10 and
V
cone
is the potential of the coupled cone.
3 MODEL PARAMETERS
CHOICE
For the pigment bleaching parameters, K
m
and τ
b
values were taken from (Mahroo and Lamb, 2004)
(K
m
= 0.2, τ
b
= 20sec). The photosensitivity was
changed to σ = 8e − 7td
−1
sec
−1
to be adjusted to
the half-bleach intensity of 4.3 log td
1
(Rushton and
Henry, 1968; Valeton and van Norren, 1983).
Membrane potentials of macaque cones can range
from ≈ −50mV in the dark, down to −70mV in re-
sponse to bright light (Verweij et al., 2003). Consider-
ing that PDE
∗
= 0 in the dark (Eq. 3), α
cGMP
/β
cGMP
ratio was chosen such that maximal cGMP conduc-
tance in the dark would cause cones to depolarize to
-50 mV (η(Ca
C
) = 1 in the dark). This was achieved
with a ratio of 0.45. The individual values are shown
adjacent to the symbol in Fig. 1. The values of
the first time constants were adjusted to fit the dy-
namics of Fig. 4. The values of γ
a
,γ
b
,η
max
and η
h
were adjusted to fit the curves in Fig. 5. The val-
ues for g
h
were adjusted to fit the hyperpolarization
sag of the traces in Fig. 4. The resultant values were
V
f
= −74mV, g
h
max
= 200, k = 3 and τ
h
= 50ms.
For rods, α
cGMP
, β
cGMP
and γ were set having in
consideration two contraints: experimental results as
shown in Fig. 3 and a potential of -50 mV at dark.
The first time constants were then adjusted to fit the
dynamics of Fig. 2. The values for g
h
were adjusted
to fit the hyperpolarization sag of the traces in Fig. 2.
The resultant values were V
f
= −85mV, g
h
max
= 90,
k = 5 and τ
h
= 100ms.
1
td is troland, the unit of conventional retinal illumi-
nance, and is defined as the product of the area of the pupil
in mm
2
and the incident luminance in cd/m
2
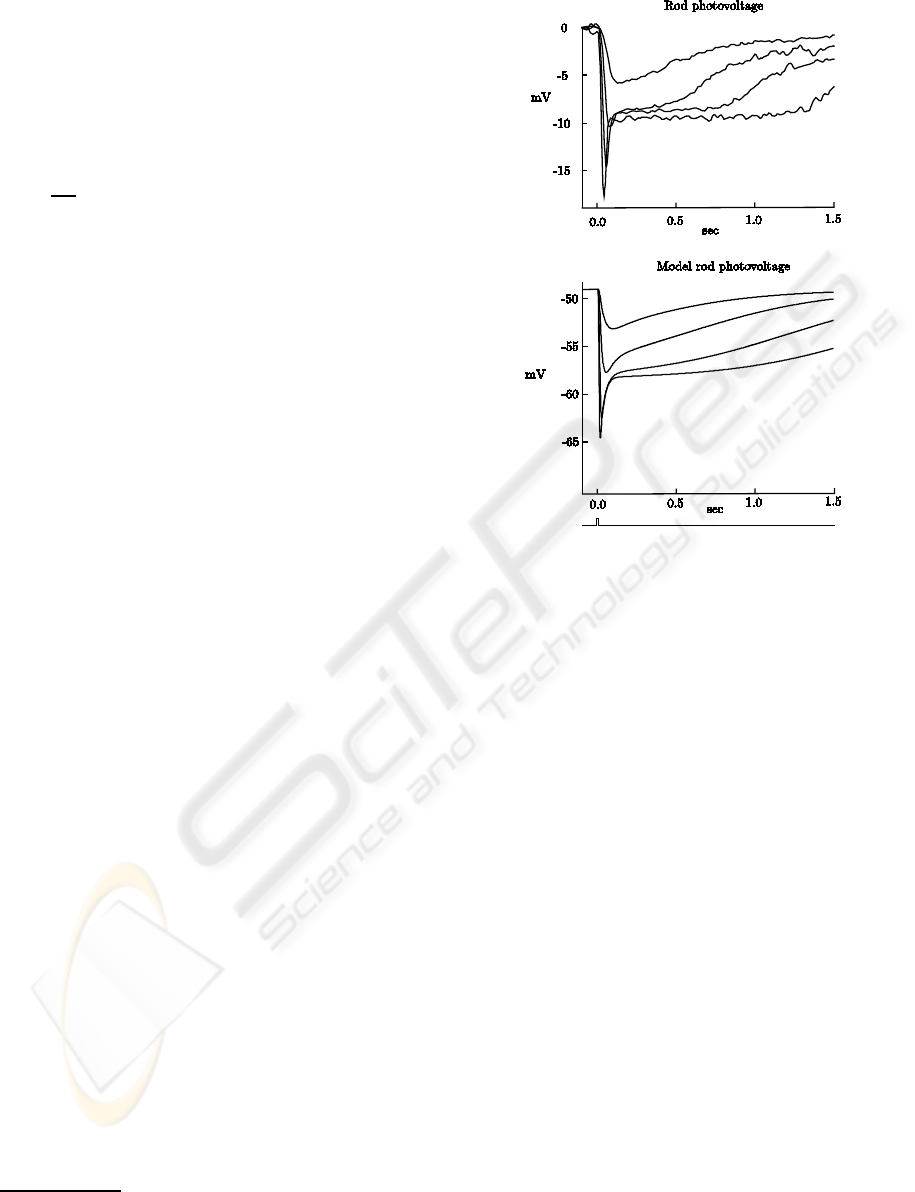
Figure 2: Rods flash response. Top figure shows rods
flash response with resting potential set to zero, taken from
(Schneeweis and Schnapf, 1999). Flash photon densities
were, from top to bottom trace, 38, 140, 626.6, and 2301
photonsµm
−2
. Flash duration was 10 ms. Bottom figure
shows rods flash responses from model. Flash strengths
were, from top to bottom curve, 29.2, 107.7, 482, and 1770
td. Flash duration was 10 ms.
4 RESULTS
4.1 Rods
A rod response to an impulse (10 ms) of light usually
lingers more than 1 sec. Fig. 2 shows the resemblance
between real and model rods.
(Baylor et al., 1984) constructed flash-response
curves (peak current response to different flash
strengths) for several rods, which are depicted by the
dots in Fig. 3. The thick continuous line is the model
voltage flash-responsecurve, for the same normalized
scale. The half-saturating flash strength is estimated
as 50.87 td. The model curve deviates from the real
response at higher intensities, probably due to the lack
of adaptation mechanisms or other ionic currents in
the model, but the shape of the curve is similar.
4.2 Cones
Cone voltage responses to flashes of light were ac-
quired by (Schneeweis and Schnapf, 1999), and are
BIOSIGNALS 2010 - International Conference on Bio-inspired Systems and Signal Processing
280
Figure 3: Rods flash-response curve. Dots represent the
normalized peak current response of several rods to increas-
ing 500 nm flash strengths, with 10 ms duration, taken from
(Baylor et al., 1984). The thin continuous line is the expres-
sion 1− exp(−k· I). The thick continuous line is the model
voltage flash-response curve, for the same normalized scale.
The horizontal scale is centered at 1/k = I
0
/ln2, where I
0
is the half-saturating flash strength. I
0
is estimated to be
50.87 td, according to the conversion from photon density
(photonsµm
−2
) to retinal illuminance (td) at 500 nm. The
dashed curve is the same as the continuous curve, but as if
the center of the horizontal scale was I
0
instead of I
0
/ln2.
reproduced here in the top traces of Fig. 4. The
bottom traces are voltage responses from the model
cones to flashes of the same duration. The overall
characteristics of the response curves are captured by
the model. Namely, the sag after the peak is de-
rived by the hyperpolarization-activated current, the
sustained portion increasing with flash strength is de-
rived from the saturation of cGMP to the lower limit,
and the final overshoot is caused by the return of light
adaptation effect to its resting value.
(Valeton and van Norren, 1983) stated that nor-
malized cone peak voltage responseV to steps of light
in monkeys follows Michaelis-Menten equation
V =
I
n
I
n
+ σ
n
, (14)
where I is the incident light (in td), σ is the half-
saturation parameter, and with n = 0.74. Along with
increasing background intensity, this curve shifts in
the intensity and the response axis. The experimental
results that provided this conclusion are expressed by
the dots in Fig. 5. The same figure shows the curves
extracted from the model, for background intensities
ranging from dark to 6 log td. The curves follow
a similar response as the Michaelis-Menten equation
and they are shifted in the intensity and response axis
with increasing background intensity. The shift in the
intensity axis is caused by the PDE activation rate re-
duction with decreasing calcium concentration (Eq.
4). The shift in the response axis is actually caused by
two effects: to step intensities below the background
intensity, the expansion of the contrast-response curve
is caused by guanylate cyclase (GC) activity disin-
hibition with decreasing calcium concentration (Eq.
4); to step intensities above the background inten-
−64
−62
−60
−58
−56
−54
−52
−50
−48
050100150200250300
Figure 4: Cones flash responses. Top traces are volt-
age responses from a red cone receiving minimal input
from rods, to 10 ms flashes, with photon densities rang-
ing from 3.68×10
3
to 2.96×10
6
photonsµm
−2
, taken from
(Schneeweis and Schnapf, 1999, Fig. 1). Bottom traces
are voltage responses from model cones, to 10 ms flashes,
with strengths (top to bottom) 600, 1200, 6× 10
3
, 24× 10
3
,
126 × 10
3
, 482 × 10
3
td. The traces were taken with no
input to rods, in the dark.
sity, the hyperpolarization-activated current (I
h
) com-
presses the response. In detail, the latter effect com-
presses the response because, with background light,
the hyperpolarized steady potential caused by the re-
duction in light-sensitive current is already counter-
acted by the depolarization caused by the I
h
current,
limiting the lower value that the contrast-response can
reach to a step of light.
The sensitivity of cones to steps of light reduces as
ambient light increases, mainly because an increment
in ambient light is not accompanied by the same in-
crement in the derivative of the steady-state response
curve. If no adaptation existed (with the exception
of pigment bleaching), cone sensitivity would be de-
scribed by the dot-dashed curve in Fig. 6. The dots in
the same figure are data extracted by (Schnapf et al.,
1990) from 4 monkey cones. Light adaptation retards
the decrease in sensitivity by shifting the contrast-
response curve to higher luminance levels, as shown
in Fig. 5, and preventing the cone from saturating.
The result from the model is shown in the thicker
continuous curve in Fig. 6 and adjusts very well to
experimental results. Nevertheless, the mean inten-
A MODEL OF PRIMATE PHOTORECEPTORS
281
Figure 5: Cones contrast-response curves for several back-
ground light levels. The continuous curves are contrast-
response curves for background intensities of (left to right)
dark, 2, 3, 4, 5 and 6 log td. The dotted curve is the steady-
state potential of cones versus background illuminance. The
steps had 150 ms duration.
sity I
0
that halves the sensitivity for the 4 cones in
(Schnapf et al., 1990) was 3.3 log td, as opposed to
just 2.8 log td in the model. It could be that the dis-
crepancy relies in the fact that four cones are not rep-
resentative of a population. Calcium-dependent adap-
tation contributes only a small portion to the overall
sensitivity curve (difference between dot-dashed and
thick continuous curve). It is pigment bleaching that
contributes to most of the adaptation and to a linear
relation between light intensity and sensitivity (also
known as Weber’s law) at higher intensities.
5 CONCLUSIONS
The model simulates the transduction of cones and
rods, reproducing the most characteristic features. It
also simulates light adaptation in cones, through pho-
toreceptor bleaching and biochemical adaptation. It
results in similar impulse response, contrast-response
and sensitivity curves of monkey cones and rods.
The model is based on simple equations, never ex-
ceeding divisions and exponents. Most of the equa-
tions are sigmoidal, which may have a direct sim-
ple equivalent in semiconductor technology. The
conductance-based model of the neuron is also a
model with a direct equivalence to an electric circuit.
The biochemical adaptation mechanism, as well
as the equations derived from it, were taken from non-
primate experiments (Fain et al., 2001; Koutalos and
Yau, 1996). Nonetheless, the data apparently show
that the same mechanism is in effect in primates.
Additionally, several aspects have been ignored in
the model, for the sake of simplicity. Firstly, the spec-
tral sensitivity of photoreceptors was neglected, since
the pathway to be realized in posterior work is achro-
Figure 6: Cones sensitivity curve. Dots are the sensitiv-
ity to 10 ms flashes of dim light at increasing background
intensities, taken from (Schnapf et al., 1990, Fig.8). Val-
ues are normalized against sensitivity in the dark S
D
(ver-
tical axis) and against the intensity I
0
that halves the sen-
sitivity (horizontal axis). The thin continuous curve is the
trace of Weber-Fechner equation
1
1+
I
/I
0
. Dot-dashed curve
is the model cone sensitivity without biochemical adapta-
tion (Ca
2+
fixed at its value in the dark). Dotted and dashed
curves are sensitivity curves with only GC activity and PDE
activation rate, respectively, controled by calcium. Thick
continuous curve is the model cone sensitivity with adapta-
tion. The traces were taken with 10 ms flashes, 10% con-
trast, no inputs to rods, after the steady-state response has
stabilized for each background intensity, with bleaching ac-
tive.
matic (the magnocellular pathway). Secondly, the
adaptation mechanism was not replicated in rods, be-
cause adaptation data and the most relevant levels of
light (mesopic and photopic) relate to cones. Thirdly,
the spatial dimension, although being essencial in fu-
ture work where a network of cells will be simulated,
is avoided in this part due to its irrevelance.
In fact, by considering the definite model as a net-
work of photoreceptors, the set of parameters was
chosen to be fixed and all results were extracted with
that set. The fixed parameters are to be used as a ref-
erence set for all photoreceptorsin the network, while
allowing variations in turn of that set for each individ-
ual unit to create a more realistic pattern.
The adaptation mechanisms presented here are
similar to the ones presented by van Hateren (van
Hateren, 2005; van Hateren and Snippe, 2007): both
have a calcium loop and pigment bleaching. Despite
that, the formulae are substantially different, because
this work was aimed to reduce the complexity of com-
putation, with the side effect of detering more ac-
BIOSIGNALS 2010 - International Conference on Bio-inspired Systems and Signal Processing
282

curate results. Besides, compared data is different,
on account of different sites of comparison (photore-
ceptors in this paper, while van Hateren analyzes re-
sponses of horizontal cells).
This paper illustrates part of research with the pur-
pose to develop a full silicon retina. Continuing re-
search is aimed to the simulation of the outer and in-
ner retina. The outer retina will introduce computa-
tion of spatial contrast via surround antagonism. It
is expected that the inner retina discriminates object
from background motion and segments objects with
different motion patterns.
ACKNOWLEDGEMENTS
This work was supported by Fundac¸˜ao para a Ciˆencia
e Tecnologia (FCT) doctoral grant SFRH / BD /
37273 / 2007 to H.R.G..
REFERENCES
Bader, C. R., Bertrand, D., and Schwartz, E. A. (1982).
Voltage-activated and calcium-activated currents stud-
ied in solitary rod inner segments from the salamander
retina. Journal of Physiology, Vol. 331:253–284.
Baylor, D. A., Hodgkin, A. L., and Lamb, T. D. (1974). Re-
construction of the electrical responses of turtle cones
to flashes and steps of light. The Journal of Physiol-
ogy, 242(3):759–791. PMC1330661.
Baylor, D. A., Nunn, B. J., and Schnapf, J. L. (1984). The
photocurrent, noise and spectral sensitivity of rods of
the monkey macaca fascicularis. The Journal of Phys-
iology, 357(1):575–607.
Fain, G. L., Matthews, H. R., Cornwall, M. C., and Kouta-
los, Y. (2001). Adaptation in vertebrate photorecep-
tors. Physiol. Rev., 81(1):117–151.
Hodgkin, A. L. and Huxley, A. F. (1952). A quantitative
description of membrane current and its application to
conduction and excitation in nerve. The Journal of
Physiology, 117(4):500–544. PMC1392413.
Hornstein, E. P., Verweij, J., Li, P. H., and Schnapf, J. L.
(2005). Gap-Junctional coupling and absolute sensi-
tivity of photoreceptors in macaque retina. J. Neu-
rosci., 25(48):11201–11209.
Koutalos, Y. and Yau, K. W. (1996). Regulation of sen-
sitivity in vertebrate rod photoreceptors by calcium.
Trends in Neurosciences, 19(2):73–81.
Mahroo, O. A. R. and Lamb, T. D. (2004). Recovery of the
human photopic electroretinogram after bleaching ex-
posures: Estimation of pigment regeneration kinetics.
Journal of Physiology, 554(2):417–437.
Masland, R. H. (2001). The fundamental plan of the retina.
Nat Neurosci, 4(9):877–886.
Perlman, I. and Normann, R. A. (1998). Light adaptation
and sensitivity controlling mechanisms in vertebrate
photoreceptors. Progress in Retinaland Eye Research,
17(4):523–563.
Rushton, W. A. H. and Henry, G. H. (1968). Bleaching
and regeneration of cone pigments in man. Vision Re-
search, 8(6):617–631.
Schnapf, J. L., Nunn, B. J., Meister, M., and Baylor, D. A.
(1990). Visual transduction in cones of the mon-
key macaca fascicularis. The Journal of Physiology,
427(1):681–713.
Schneeweis, D. M. and Schnapf, J. L. (1999). The photo-
voltage of macaque cone photoreceptors: Adaptation,
noise, and kinetics. J. Neurosci., 19(4):1203–1216.
Soo, F. S., Detwiler, P. B., and Rieke, F. (2008). Light adap-
tation in salamander L-Cone photoreceptors. J. Neu-
rosci., 28(6):1331–1342.
Valeton, J. M. and van Norren, D. (1983). Light adapta-
tion of primate cones: an analysis based on extracellu-
lar data. Vision Research, 23(12):1539–1547. PMID:
6666056.
van Hateren, H. (2005). A cellular and molecular model of
response kinetics and adaptation in primate cones and
horizontal cells. Journal of Vision, 5(4):331–347.
van Hateren, J. H. (2007). A model of spatiotemporal sig-
nal processing by primate cones and horizontal cells.
Journal of Vision, 7(3):1–19.
van Hateren, J. H. and Snippe, H. P. (2007). Simulating
human cones from mid-mesopic up to high-photopic
luminances. Journal of Vision, 7(4).
Verweij, J., Hornstein, E. P., and Schnapf, J. L. (2003). Sur-
round antagonism in macaque cone photoreceptors. J.
Neurosci., 23(32):10249–10257.
A MODEL OF PRIMATE PHOTORECEPTORS
283
