
ACCURATE LOCALIZATION OF CELL NUCLEI IN PAP
SMEAR IMAGES USING GRADIENT VECTOR
FLOW DEFORMABLE MODELS
Marina E. Plissiti, Christophoros Nikou
Department of Computer Science, University of Ioannina, Ioannina, Greece
Antonia Charchanti
Department of Anatomy-Histology and Embryology, Medical School, University of Ioannina, Ioannina, Greece
Keywords: Nuclei segmentation, PAP stained cervical smear images, Active contours, Gradient Vector Flow (GVF)
snake.
Abstract: In this work, we present an automated method for the detection of cells nuclei boundaries in conventional
PAP stained cervical smear images. The proposed method consists of three phases: a) the definition of
candidate nuclei centroids set using mathematical morphology, b) the initial approximation of cells nuclei
boundaries and c) the application of the Gradient Vector Flow (GVF) snakes for the final estimation of
candidate cell nuclei boundaries. It must be noted that the initial approximation of each snake position is
obtained automatically, without any observer interference. For the final determination of the nuclei in our
images, we perform a fuzzy C-means clustering, using a data set of patterns based on the characteristics of
the area enclosed by the final position of the GVF snakes. The proposed method is evaluated using
cytological images of conventional PAP smears, which contain 3616 recognized squamous epithelial cells.
The results show that the application of the GVF snakes entails in accurate nuclei boundaries, and
consequently in the improvement of the performance of the clustering algorithm.
1 INTRODUCTION
The automated segmentation of cell nuclei in PAP
smear images is one of the most interesting fields in
cytological image analysis. The accurate
determination of cell nuclei area in cytological
images is important for the correct diagnostic
decisions, as the nucleus is the structural part of the
cell which exhibits significant changes after the
affection of the cell by a disease. However, the
visual interpretation of these images is a tedious,
time-consuming and in many cases error-prone
procedure because of the complexity that these
images exhibit. Thus, the high degree of cell
overlapping, the lack of homogeneity in image
intensity and the variations in dye concentration are
challenging issues that an automated segmentation
method must overcome.
In the last years, cell nuclei segmentation has
been extensively studied by several researchers. A
large number of methods applied in many
cytological images have been proposed based on
morphological watersheds (Lezoray, 2002), (Costa,
1997), fuzzy logic (Begelman, 2004), level sets
(Cheng, 2009) and active contours (Bamford, 1998),
(Hu, 2004), (Plissiti, 2006), (Plissiti, 2008). Active
contours (Kass, 1988), also known as snakes, seem
an ideally suited technique for the nucleus
segmentation problem. However, snakes require an
initial contour estimation close to the real boundary,
which is usually obtained manually. This limitation
is restrictive for the application of snakes in images
such as PAP smear images, where a large number of
cell nuclei are depicted in a single image and also
significant cell overlapping is observed.
Our work aims at the definition of nuclei
boundaries in conventional PAP stained cervical cell
images using the Gradient Vector Flow (GVF) snake
model (Xu, 1998). The proposed method overcomes
the problem of snake initialization because an
approximation of nucleus boundary is obtained
284
E. Plissiti M., Nikou C. and Charchanti A. (2010).
ACCURATE LOCALIZATION OF CELL NUCLEI IN PAP SMEAR IMAGES USING GRADIENT VECTOR FLOW DEFORMABLE MODELS.
In Proceedings of the Third International Conference on Bio-inspired Systems and Signal Processing, pages 284-289
DOI: 10.5220/0002746702840289
Copyright
c
SciTePress

automatically for each nucleus in the image. As
there could be regions not being cell nuclei, we
apply the fuzzy C-means algorithm for the
classification of the closed regions (the result of the
GVF snakes) in the class of interest (nuclei class) or
in the class of undesired findings.
To underpin the accuracy of the GVF snake
segmentation, we construct two data sets. The first
data set comprises the areas enclosed by the initial
position of the snakes and the second data set
contains the areas under the final position of each
snake. As it is verified by the results, the
performance of the method is improved when the
data set of the area enclosed by the final snake
position are used. This is a confirmation that the
obtained contour is an accurate nucleus boundary.
The proposed method is fully automated and it can
be applied in any microscopic cervical cell sample
image.
2 MATERIALS AND METHODS
2.1 Study Group
We have collected 19 images of conventional PAP
stained cervical cell slides, which were acquired
through a microscope digital camera (Olympus
DP71) adapted to an optical microscope (Olympus
BX51). We have used a 10× magnification lens and
the acquired images were stored in JPEG format.
The total number of cell nuclei in the images, which
were identified by two expert observers is 3616.
2.2 Segmentation
The purpose of this step is firstly the detection of the
location of every nucleus in the images and secondly
the determination of the boundary of each nucleus
area. This is obtained automatically, as we follow
the method proposed in (Plissiti, 2006) and (Plissiti,
2008). This method consists of three individual steps
and it is described in the following paragraphs.
2.2.1 Detection of the Candidate Nuclei
Centroids
This step is necessary for the determination of the
location of every nucleus in each image. It is
comprised of two sequential stages: the
preprocessing and the determination of the
probable location of each nucleus. The outcome of
this step is a set of image points which indicate the
areas of the image that are occupied by the nuclei of
the cells.
In the preprossesing step, the extraction of the
background and the definition of smooth regions of
interest are achieved. We perform contrast-limited
adaptive histogram equalization and global
thresholding to the red, green and blue component of
the image. In the final binary mask, which is the
result of a logical OR operation of these three binary
images, all particles with an area smaller than a
threshold t are removed, in order to exclude objects
that may interfere in the next steps.
The parts of the image found in the
preprocessing step contain either isolated cells or
cell clusters. Considering that nuclei are darker than
the surrounding cytoplasm (Figure 1(a)), we search
for intensity valleys in the image. For the formation
of homogenous minima valleys we apply the h-
minima transform (Soille, 1999) in the red, green
and blue components of the original image. The
resulted image is used as a mask for the
morphological reconstruction of the initial image. In
the final image, we search for regional minima and
the extracted regions of the image intimate the
existence of the cell nuclei (Figure 1(b)). The
location of each candidate nucleus is determined
with the centroid
c
r
of each detected intensity valley
(Figure 1(c)).
2.2.2 Initial Approximation of the Cell
Nuclei Boundaries
After the definition of the locations of each
candidate nuclei centroid, we proceed with the initial
approximation of the nuclei boundaries, which is a
prerequisite for the application of the deformable
model. For this purpose we collect some points near
the centroid of each nucleus, which are likely lying
in the nucleus circumference.
Given the fact that the nucleus is darker than the
background, we expect high gradient of the image in
each nucleus boundaries. In order to avoid threshold
dependent techniques such as edge detectors, we
construct an image with each nucleus boundaries
pronounced. This image is a result of the subtraction
of two images. The first image is the result of the
application of an averaging filter in the initial image.
The second image is the outcome of successive
erosions of the initial image, using a flat disk-shaped
structuring element. The result of the subtraction of
these two images is an image with all cell nuclei
boundaries sharp (Figure 2). In this image, we
construct a circular searching grid centered at the
ACCURATE LOCALIZATION OF CELL NUCLEI IN PAP SMEAR IMAGES USING GRADIENT VECTOR FLOW
DEFORMABLE MODELS
285

(a) (b) (c)
Figure 1: (a) A part of the initial image containing two cells, (b) the regional minima which correspond to the nuclei and (c)
the resulted nuclei centroids.
location of each candidate nucleus centroid. We use
8 radial profiles in equal arc length intervals
consisted of 8 points each, and in every radial profile
we choose only one pixel (the one with the highest
intensity) and we assume that this pixel belongs to
the nucleus circumference. In this way, we collect N
points for each nucleus boundary and we construct
the convex hull using these points. This is used as
the initial approximation of the location of the
deformable contour.
It must be noted that with the definition of these
points in each nucleus circumference, we redefine
the nucleus centroid
c
r
with this formula:
()
()
1
1
N
cii
i
rx,y x,y
N
=
==
∑
(1)
where
,
ii
x
y
are the coordinates of each
circumferential point. After this calculation, we
apply a distance dependent rule, in which we
eliminate the existence of two or more centroids in
an area of a radius that it is smaller than the mean
radius of a normal nucleus. The rule is described as
follows:
()
()
()
{}
() ()
{}
{}
,
,| ,
,|min ,
c
qq
pxyR
if exists q x y D p q T
s
elect r p q I p I q
∀= ∈
=≤
=
(2)
where
c
R
is the set of all centroids, D is the
euclidean distance between two points,
T is the
threshold on the minimum radius and
(
)
Ip
is the
intensity of the image at the point
p
. With the
application of this rule, a significant reduction of the
total number of the false positive centroids is
achieved.
2.2.3 Application of the GVF Snake
For every nucleus centroid, we apply a deformable
model using as initial estimation the convex hull of
the circumferential points found in the previous step.
A traditional snake is defined as a curve
(
)
(
)
(
)
[
]
,,0,1sxsyss=∈⎡⎤
⎣⎦
x and it is deformed
under the influence of internal and external (image)
forces in order to minimize its energy functional:
()
()
()
()
()
1
0
int image
EE sE sds=+
∫
xx
(3)
As in most conventional snake models, the
internal energy is a function of the first and second
order derivatives of the curve (for length and
curvature minimization), and can be expressed as:
() ()
22
int
Es s
αβ
′′′
=+xx
,
(4)
while
image
E is defined as:
image ext
E γE
=
,
(5)
where the external energy function
ext
E
takes
smaller values at the features of the interest in the
image.
A snake that minimizes the energy
E must
satisfy the Euler equation:
(
)
(
)
0
ext
ssE
αβ γ
′′ ′′′′
−
−∇ =xx
.
(6)
For the solution of this equation,
x is treated as
a function of time
t
as well as
s
and the partial
derivative of
x with respect to
t
is then set equal to
(
)
(
)()
,, ,
text
s
tst stE
αβ γ
′′ ′′′′
=− −∇xxx
(7)
The stabilization of the solution
(
)
,
s
tx
entails in
the vanishing of the term
(
)
,
t
s
tx
and as a result in
the solution of (6).
For the external energy, we adopt the approach
of the gradient vector flow (GVF) field, as it is
described in (Xu, 1998). The GVF field is the vector
field
(
)
(
)
(
)
(
)
,,,,
x
y u xy xy
υ
=v that minimizes the
energy functional
(
)
22
2222
xyxy
u u f f dxdy
μυυ
Ε= + + + +∇ −∇
∫∫
v
(8)
BIOSIGNALS 2010 - International Conference on Bio-inspired Systems and Signal Processing
286

where
(
)
,
f
xy
is an edge map with larger intensity
values near the image edges derived from the initial
image
(
)
,Ixy
,
f
∇
is the gradient of the edge
image and
μ
is a regularization parameter. With
this approach the GVF snake is defined as the
parametric curve
() () ()
,, ,
t
st st st
α
βγ
′′ ′′′′
=− +xxx v
(9)
which is solved numerically by discretization in
space and time. This deformable model is flexible
and it is attracted by the nucleus boundaries. Figure
3 shows the initial estimation and the final contour
obtained by the deformation of the model in several
examples.
2.3 Clustering of the Candidate Nuclei
The application of the fuzzy C-means classification
algorithm (Bezdek, 1992) is necessary for the
separation of the segmented regions of the image
that belong to the true nuclei and the regions that
belong to other regional minima, which do not
indicate the existence of a nucleus in the image. For
this reason, after the stabilization of each snake in
the entire image, a data set of features which are
extracted from the area enclosed in the final position
of the snake is created. We choose eight features for
each candidate nucleus area, which concern the
intensity and the shape attributes of the region
enclosed by the snake: (i) – (iii) the average intensity
of the area in the red, green and blue channel of the
image, (iv) the diameter of a circle which has the
same area with the region, (v) the proportion of the
pixels in the convex hull that are also in the region,
(vi) the eccentricity, (vii) the major and (viii) the
minor axis length of an ellipse that has the same
second moments as the region.
3 EXPERIMENTAL RESULTS
For the evaluation of the method we have to
examine the performance of the different steps of the
segmentation method, until the application of the
fuzzy C- means classification algorithm. The overall
loss of the true nuclei in the definition of the
candidate nuclei centroids set is 29 nuclei, from
which 7 nuclei were missed in the preprocessing
step and 22 of them were missed in the detection of
regional minima in the image. Thus the total loss of
this step is 0.8% and the sensitivity is 99.39%.
In order to evaluate the performance of the
segmentation method, the same features are selected
for the area of the initial position of the snake. This
is a second feature set that is used as input in the
fuzzy C-means algorithm, and a comparison of the
performance of the method using the first and the
second feature set has been done. As it is verified by
the results, the use of the feature set obtained from
the area enclosed by the final snake position entails
in higher classification performance
For the evaluation of the accuracy of the
segmentation method, we compare the performance
of fuzzy C-means clustering algorithm using the two
independent feature sets, the first one obtained from
the initial and the second one obtained from the final
snake position, as it is described above. The
classification performance of the first feature set
reaches 82.38% in sensitivity and 75.91% in
specificity. On the other hand, the classification
performance of the second feature set reaches
91.77% in sensitivity and 74.23% in specificity. As
we can see, there is a remarkable improvement in
sensitivity, while the specificity is maintained almost
in the same levels.
We have also used a variable decision threshold
in the fuzzy C- means classification algorithm and
we have calculated several values for the sensitivity
and the false positive rate, and with these values we
have constructed the Receiver Operating
Characteristic (ROC) curve for the two different
feature sets (Figure 4). As it is observed, the ROC
plot of the second feature set is closer to the upper
left corner, which means that the overall accuracy of
the classification algorithm using the specific feature
set is higher than the one using the initial feature set.
This implies that the final position of the GVF snake
stabilizes in the location of the accurate nuclei
boundaries.
Figure 2: The resulted image of the subtraction of two
images (see text for details).
ACCURATE LOCALIZATION OF CELL NUCLEI IN PAP SMEAR IMAGES USING GRADIENT VECTOR FLOW
DEFORMABLE MODELS
287
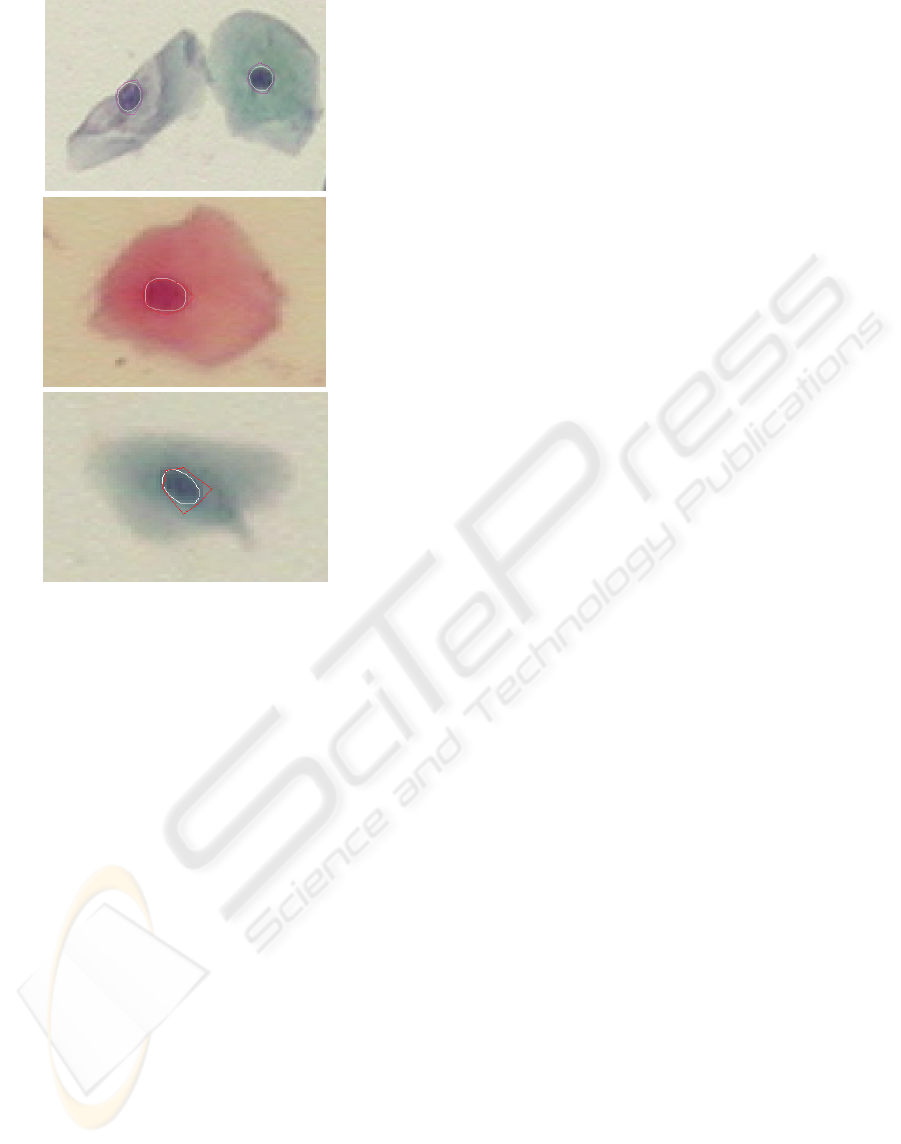
(a)
(b)
(c)
Figure 3: (a)-(c) Examples of the initial estimation of the
nuclei boundaries (in red) and the final nuclei boundaries
(in white), after the stabilization of the GVF snake.
4 DISCUSSION
The proposed method is applied automatically in
conventional PAP stained cervical smear images.
For the extraction of acceptable results in all the
images of our data set, we have tested several values
for the variable parameters of each step of the
method. In the preprocessing step, the contrast
limited adaptive histogram equalization is performed
in image regions of 8
×8 pixels and the clip limit is
set to 2. For the rejection of objects that are not
nuclei we used as a threshold of 500 for the object
area, which is sufficient for the elimination of small
image artifacts, while preserving the isolated cells in
the image. However, the loss of true nuclei in this
step is due to the faintly staining of some cells,
which makes them undistinguished from the
background. As a consequence, the nuclei of these
cells are considered as isolated objects in the image
background and they are removed.
For the selection of the intensity valleys we
choose the threshold value of
h=15, which produces
the minimum loss of true positives centroids. For the
application of the distance dependent rule, for each
detected centroid we calculate the minimum
euclidean distance from the neighbouring centroids
and we used a threshold of 8, which approximates
the average nuclei radius, determined after careful
examination of the images by an expert
cytopathologist.
For the calculation of the gradient vector flow
field, we construct an edge map from the initial
image, by converting it to a gray scale image and
consecutively by applying the Canny edge detector
to find the edges. The parameter
μ
is set to be 0.01.
Then, we proceed with the application of the GVF
snake with parameters
0.9a
=
, 1.5
β
= and 3γ
=
.
These values were selected after several experiments
in the first image of our dataset and gave acceptable
results, as it was verified by an expert
cytopathologist. The maximum number of iterations
that is allowed for the snake deformations is 20.
5 CONCLUSIONS
We have developed a fully automated method for
the segmentation of cell nuclei in PAP smear
images. The proposed method overcomes the
problem of the detection of the locations of cell
nuclei and the restriction of the initial estimation of
their boundaries, and it is suitable for the application
of the GVF snakes, without any observer
interference. As it is verified by the results, the
performance of the method is high, as it achieves to
determine accurate nuclei boundaries with the
stabilization of the active contours. Finally, the
proposed method can be used as the basis for further
processing of cell images, such as the discrimination
of normal and abnormal or malignant cells.
ACKNOWLEDGEMENTS
The authors would like to thank Olga Krikoni for
providing the Pap smear slides for the construction
of the image data set.
BIOSIGNALS 2010 - International Conference on Bio-inspired Systems and Signal Processing
288
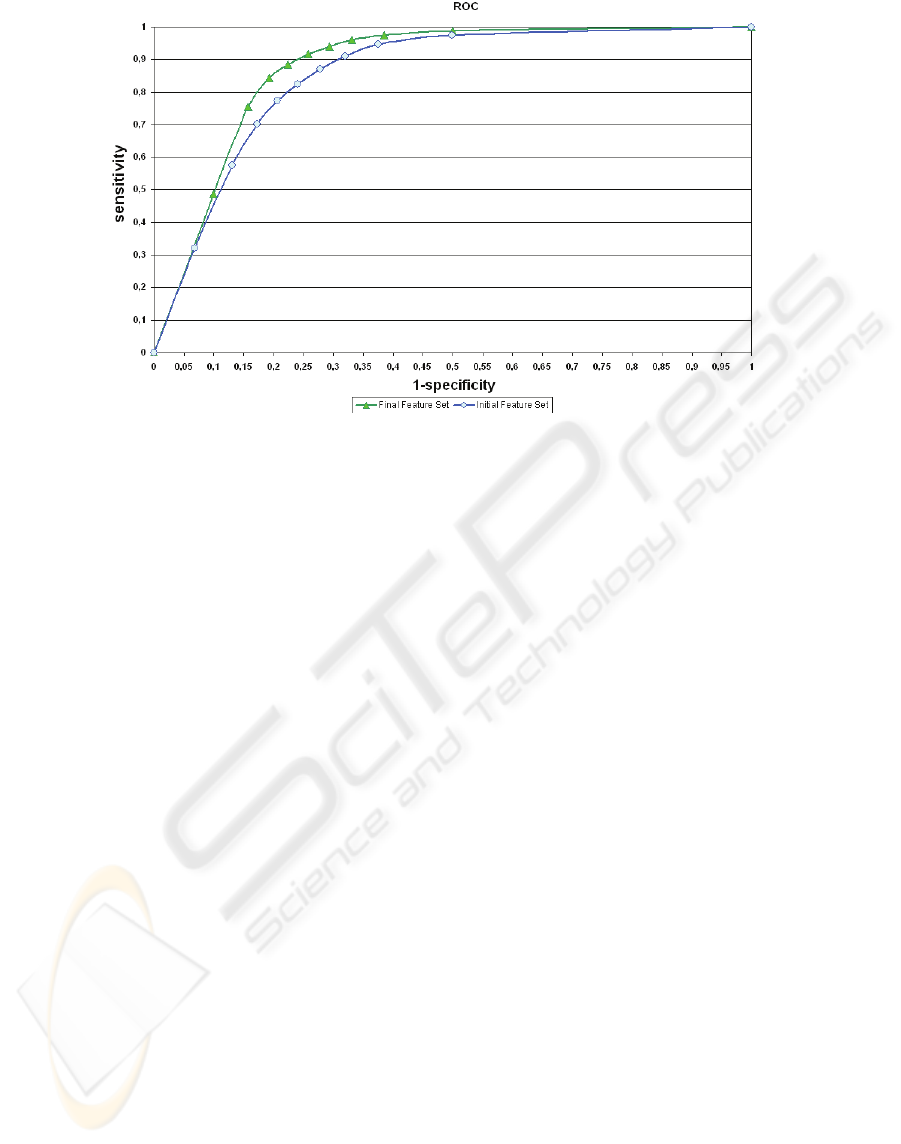
Figure 4: The ROC curve for the initial feature set (blue line) and with the final feature set (green line) for various values of
the classification threshold in FCM.
REFERENCES
Lezoray, O., Cardot, H., 2002. Cooperation of color pixel
classification schemes and color watershed: A study
for microscopic images, IEEE Transactions on Image
Processing, Vol. 11, no. 7, pp. 783-789.
Costa, J. A. F., Mascarenhas, N. D. A., De Andrade
Netto, M.L, 1997. Cell nuclei segmentation in noisy
images using morphological watersheds, Proceedings
of SPIE, International Society for Optical
Engineering, Vol. 3164, pp. 314-324.
Begelman, G., Gur, E., Rivlin, E., Rudzsky, M., Zalevsky,
Z., 2004. Cell nuclei segmentation using fuzzy logic
engine, Proceedings of IEEE International Conference
on Image Processing (ICIP ’04), Vol. 5, pp. 2937-
2940.
Cheng, J., Rajapakse, J. C., 2009. Segmentation of
clustered nuclei with shape markers and marking
function, IEEE Transactions on Biomedical
Engineering, Vol. 56, no.3, pp. 741-748.
Bamford, P., Lovell, B., 1998. Unsupervised cell nucleus
segmentation with active contours, Signal Processing,
Vol. 71, no. 2, pp. 203-213.
Hu, M., Ping, X., Ding, Y., 2004. Applying Fuzzy
Growing Snake to Segment Cell Nuclei in Color
Biopsy Images, Lecture Notes in Computer Science,
Vol. 3314, pp. 672-677.
Plissiti, M. E., Charchanti, A., Krikoni, O., Fotiadis, D. I.,
2006. Automated segmentation of cell nuclei in Pap
smear images, Proceedings of IEEE International
Special Topic Conference on Information Technology
in Biomedicine (ITAB ’06), Greece.
Plissiti, M. E., Tripoliti,, E. E., Charchanti, A., Krikoni,
O., Fotiadis, D. I., 2008. Automated detection of cell
nuclei in Pap stained smear images using fuzzy
clustering, Proceedings of the 4th European Congress
for Medical and Biomedical Engineering (EMBEC
’08).
Kass, M., Witkin, A., Terzopoulos, D., 1988. Snakes:
active contour models. International Journal of
Computer Vision, Vol. 1, pp 321-331.
Xu C., Prince, J., 1998. Snakes, shapes and gradient vector
flow. IEEE Transactions on Image Processing, Vol. 7,
No 3, pp 359-369.
Soille, P., 1999. Morphological Image Analysis:Principles
and Applications, New York: Springer-Verlag.
Bezdek, J. C., Pal, S. K., 1992. Fuzzy Models for Pattern
Recognition, New York, IEEE Press.
ACCURATE LOCALIZATION OF CELL NUCLEI IN PAP SMEAR IMAGES USING GRADIENT VECTOR FLOW
DEFORMABLE MODELS
289
