
MECHANOMYOGRAPHIC ANALYSIS WITH 0.2 S AND 1.0 S
TIME DELAY AFTER ONSET OF CONTRACTION
Eddy Krueger, Eduardo M. Scheeren, Gean Francesco D. Chu, Percy Nohama
CPGEI, Federal Technological University of Paraná, Ave Sete de Setembro 3165, Rebouças, Curitiba, PR, Brazil
Guilherme N. Nogueira-Neto, Vera Lúcia S. Nantes Button
School of Electrical and Computer Engineering, University of Campinas, Campinas, SP, Brazil
Keywords: Accelerometer, Prosthesis control, Upper limb, Time delay, Onset of contraction, Motion artifact.
Abstract: Muscle contractions generate lateral oscillations and motion artifacts that can be detected by MMG sensors
placed in the inner and outer sides of the forearm. These artifacts can significantly affect signal processing
and eventually it is necessary to eliminate their influence in order to detect movements reliably. One
approach is to respect a time delay after the onset of contraction. This study aimed to evaluate the
correlation of 0.2 s and 1.0 s time delays after the onset of contraction during wrist movements. This work
respected two different time delays before initiating the signal analysis. Two analysis window lengths were
evaluated (0.25 s and 0.50 s). The results showed that there are strong correlations between the acquired
signals with both time delays, mainly the devised RZ feature (0.81–0.95). This study was a first approach to
determine whether triaxial MMG features can be used for motor prosthesis control. The axial moduli
presented strong correlations for all movements and can be productive in future applications.
1 INTRODUCTION
Mechanomyography (MMG) sensors can be built
with triaxial accelerometers (Nogueira-Neto et al.,
2008). These transducers measured the displacement
accelerations during muscle contractions in three
axes of movement and also their modulus. One of
the differences between MMG and EMG temporal
characteristics are the initial and final contraction
movement artifacts (Silva and Chau, 2003) existing
in MMG, that was denominated onset of contraction
(Nolan and dePaor, 2004). These artifacts jeopardize
processing because they contaminate signal temporal
and spectral behaviors (Silva and Chau, 2003). Some
studies use analysis windows with a time delay
beginning on the onset of contraction to characterize
signals, e. g. for prosthesis control (Prociow et al.,
2008, Alves and Chau, 2008). In preliminary tests, a
time delay of 1.0 s after the onset of contraction
(1.0AOC) was considered too long for practical
purposes because it was impossible to characterize
the four different movements using this delay. In
order to control a myoelectrical prosthesis, short
delay and analysis window length (AWL) are
necessary because human perception needs 300 ms
or less to consider an event as having occurred in
real time (Englehart and Hudgins, 2003).
The purpose of this study is to evaluate the
behavior of MMG features obtained with 0.2 s after
onset of contraction (0.2AOC) and 1.0AOC during
four different wrist movements.
2 METHODS
2.1 Volunteers
Twelve male volunteers (24±5.5 years old) without
neuromuscular or elbow and wrist joint problems
performed the tests. The study was approved by the
institute’s ethics committee. All participants were
instructed in detail about the test protocol and they
agreed to participate in the study. Then, they were
submitted to skin preparation (trichotomy and
cleaning) and sensor placement.
296
Krueger E., M. Scheeren E., Francesco D. Chu G., Nohama P., N. Nogueira-Neto G. and Lúcia S. Nantes Button V. (2010).
MECHANOMYOGRAPHIC ANALYSIS WITH 0.2 S AND 1.0 S TIME DELAY AFTER ONSET OF CONTRACTION .
In Proceedings of the Third International Conference on Bio-inspired Systems and Signal Processing, pages 296-299
DOI: 10.5220/0002746902960299
Copyright
c
SciTePress
2.2 Sensors
The developed MMG sensors used Freescale
MMA7260Q MEMS triaxial accelerometers with
high sensitivity 800 mV/V at 1.5 G (G, gravitational
acceleration). Electronic circuits allowed 10x
amplification and 4-40 Hz Butterworth filtering,
focusing MMG passband (Silva and Chau, 2003).
Individual axes and their modulus were acquired.
A string was stretched from the epicondyle until
the centre of carpal region to help in determining the
right sensor placement, approximately 7 cm from the
epicondyles over the muscle belly of the forearm
(Wojtczak et al., 2009), with the Y axis parallel to
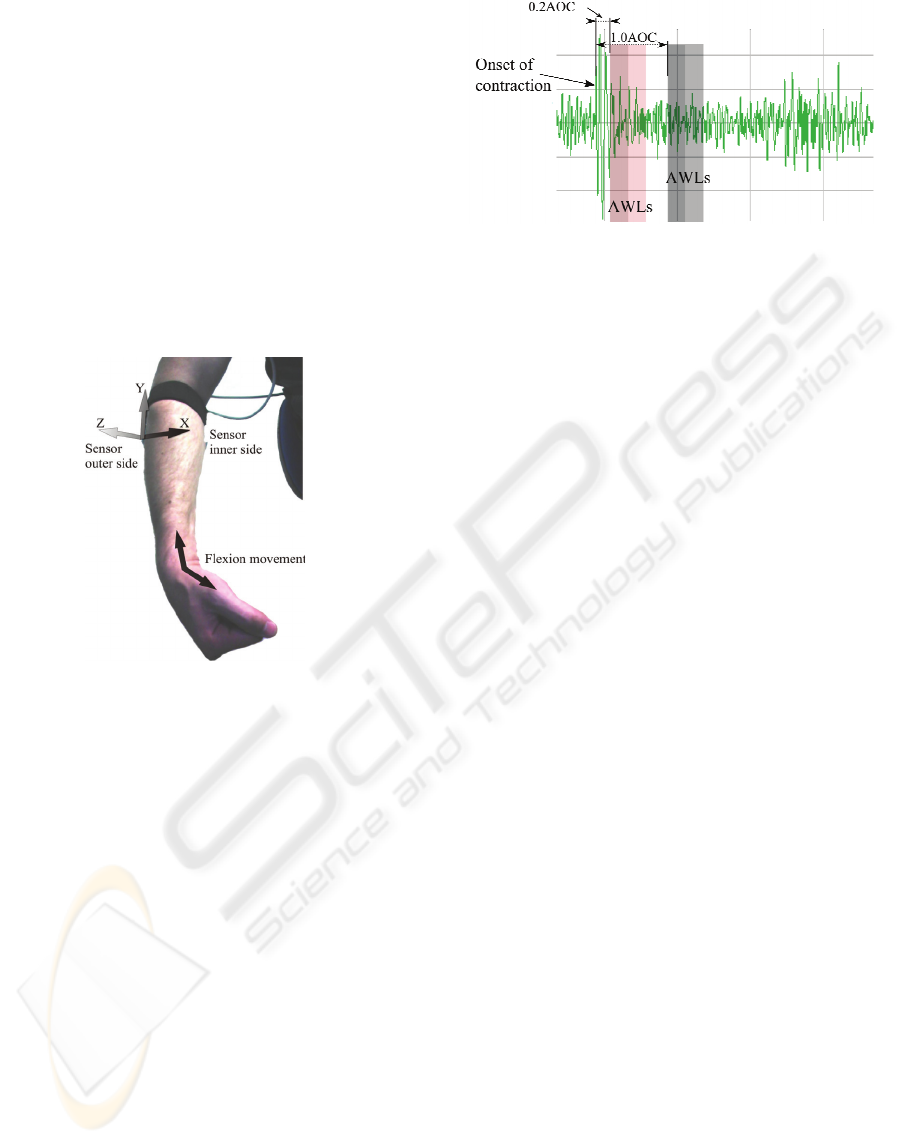
the muscle fibers as shown in Figure 1.
Figure 1: Volunteer and MMG sensor placement.
2.3 Protocol
The volunteers were seated on a chair where they
performed five concentric contractions for each
wrist movement of the dominant limb: flexion,
extension, ulnar and radial deviations. The sequence
of movements was randomly chosen. The limb
stayed loose, closed fist, in neutral anatomical
position without touching any body. Researchers
indicated the start and end of contractions in order to
determine the contraction timing (approx. 2.5 s).
2.4 Data Acquisition and Analysis
A LabVIEW™ program was coded to acquire MMG
signals. All signals and volunteer data were saved
into European Data Format (EDF) files. The data
acquisition board was a Data Translation™ DT300
series with 1 kHz sample rate. Figure 2 shows the
MMG Z axis signal for a wrist flexion detailing the
onset of contraction artifact, 0.2AOC and 1.0AOC
time delays, 0.25 s and 0.5 s AWLs.
Figure 2: MMG Z axis. Details: onset of contraction,
0.2AOC, 1.0AOC and AWL intervals (darker shades 0.25
s AWLs and darker plus lighter shades 0.5 s AWLs).
From the five repeated contractions, the central
one was chosen for analysis. Temporal features were
calculated for all signals and each AWL. Root mean
square (RMS) is the quadratic mean indicating the
range of muscle displacement represented by its
acceleration. Zero-crossing is the number of times
that the signal crossed the baseline. Peak counting is
the number of peaks (sub-window of 30 ms) in the
AWL. Zero-crossing and peak counting are temporal
features, however both have direct connection with
frequency spectrum. Zero-crossing has close relation
with the signal fundamental frequency and peak
counting is related to spectral higher frequencies. In
addition to the raw features, multiplications were
performed in order to devise hybrid values. MMG
captures muscle oscillations during contraction and
stretching (unlike EMG for electrical activity).
Eventually, RMS is bigger during stretching than
contraction. The multiplication of RMS (energy
related) and zero-crossing (frequency related) can
enhance the discriminatory procedure, thus the RZ
feature was created. After t-test analysis, Pearson’s
correlation coefficients (R) between 0.2AOC and
1.0AOC were calculated. In order to determine R
between individual values of each sensor, data were
splitted by: (a) movement, (b) side of the forearm
(inner and outer), (c) axes/modulus, (d) AWL and
(e) analysis.
3 RESULTS
The t-test revealed that the values of all features,
signals and AWLs were different when comparing
0.2AOC and 1.0AOC. Table 1 shows only the R
values that presented strong correlation between
0.2AOC and 1.0AOC, i. e. values greater than 0.75.
MECHANOMYOGRAPHIC ANALYSIS WITH 0.2 S AND 1.0 S TIME DELAY AFTER ONSET OF CONTRACTION
297

Table 1: Features that presented strong correlation
coefficients (R) between 0.2AOC and 1.0AOC.
Side Mov AWL Axis/Mod Feature R
Inner
Ext
.25s
Z RZ 0.79
Mod
RZ 0.81
Zc 0.88
.5s
X
RMS 0.79
RZ 0.82
Y RZ 0.88
Mod
RZ 0.93
Zc 0.84
Rad
.25s
X
RMS 0.80
RZ 0.91
Mod Zc 0.82
.5s
X
RMS 0.87
Zc 0.84
RZ 0.95
Y RZ 0.84
Mod
Pc 0.78
RMS 0.78
RZ 0.93
Zc 0.88
Flex .5s X RMS 0.84
Outer Flex .5s Mod Zc
-
0.90
Wrist movement (Mov), extension (Ext), radial deviatio
n
(Rad), flexion (Flex), modulus (Mod), zero-crossing (Zc),
peak counting (Pc), RMS*zero-crossing (RZ)
4 DISCUSSION
The purpose of this study was to evaluate the
difference between 0.2AOC and 1.0AOC in forearm
muscles by MMG analysis. Since this work was a
first approach, we decided to take the extremities: a
short (0.2 s) and a long time delay (1.0 s). We
hypothesized that if 0.2 s did not have difference
with 1.0 s delay then it would be unproductive to
investigate intermediate delays.
The t-test showed that all feature values between
0.2AOC and 1.0AOC were different. This can have
occurred because the onset of contraction (see
Figure 1) had a high amplitude and since it is within
any 0.2AOC AWL it was expected that the artifact
influenced the analysis.
According to the results indicated in Table 1, the
major number of strong correlations occurred on the
inner side of the forearm. Anatomically, the inner
side is responsible for wrist flexion and ulnar
deviation movements. However, even though the
extention and radial deviation belong to the outer
side, they appeared several times in the inner side
sensor. This was considered a correlation between
0.2AOC and 1.0AOC during antagonist movements.
It was assumed that 0.2AOC incorporated the initial
contraction interference that follows immediately the
onset of contraction. In this perspective, the strong
correlations between 0.2AOC and 1.0AOC, recorded
by an MMG sensor positioned over antagonist
muscles, mean that this muscle group do not
introduce significant interference from the onset of
contraction. From the control strategy point of view,
this is an important finding because spurious
contractions registered on this side could be rejected.
The feature of flexion movement was singular
because it was the only agonistic movement that
appeared in the inner side and the only one with R >
0.75 in the outer side (in spite of being antagonist).
The greater the R (the closest to 1.0) the more
similar the features behaved comparing 0.2AOC and
1.0AOC. Therefore, despite using a short delay will
probably involve a part of the onset of contraction,
choosing 0.2AOC and 0.25 s delay is acceptable
because the total time is almost completely within
human perception range (Englehart and Hudgins,
2003).
Strong correlations were not observed for ulnar
deviation in both sides. Apparently, the inner side
was affected by the flexion and ulnar deviation
movement artifacts, because of the inexistence of
strong correlations. The observation of eleven
correlations to radial deviation obtained for the inner
side is attributed to the contractions having lower
amplitude movement artifacts. Radial deviation
range of movement (21°±4.0°) (Cipriano, 2003) is
the smallest among the other wrist movements and,
thus, can support the idea of onset of contraction
amplitude interference.
(Petitjean et al., 1998) used electrical stimulation
to obtain a single twitch. Their results showed that
the increase in electrical stimulation amplitude lead
to an increase in MMG peak-to-peak amplitude, but
the duration of movement artifact was very similar,
approximately 20 ms.
Some studies used a time delay after the onset of
contraction to minimize the movement artifact. Such
time delays range from 0.67 s up to 1.0 s (Beck et
al., 2004, Alves and Chau, 2008, Nolan and dePaor,
2004, Smith et al., 1998).
Another strategy is to dismiss the initial 30% of
signal, thus eliminating the movement artifact
generated at the onset of contraction, and analysing
the remaining signal (Prociow et al., 2008).
However, this approach can lead to latency problems
due to human perception and further works in
prosthetic control can face practical problems in
patient-prosthesis interaction.
BIOSIGNALS 2010 - International Conference on Bio-inspired Systems and Signal Processing
298

One interesting observation has to do with the
moduli features. The moduli presented many strong
correlations, five against one, two and four
occurrences for Z, Y, and X axes, respectively. They
had strong correlation between 0.2AOC and
1.0AOC for both AWLs. The moduli values can be
calculated with bi- and triaxial accelerometers and
their use can be helpful because of results
repeatability, specially the number of zero-crossings.
The RZ feature brought good perspectives to
wrist movement analyses. Table 1 shows nine strong
correlations whereas the RMS value and zero-
crossing, from where it is derived, presented six and
five correlations respectively. The use of peak
counting to determine muscle contraction was not
effective when performed concomitantly with
movement artifact, since only one correlation was
observed between 0.2AOC and 1.0AOC. Further
studies with new indicators can improve MMG
movement analysis, making unnecessary to
eliminate unwanted artifact interferences in the onset
of contraction, therefore, enhancing myoelectrical
prosthesis control.
5 CONCLUSIONS
This paper investigated mechanomyographic
analyses with 0.2 s and 1.0 s time delay after onset
of contraction during four wrist movements. The
main outcome was the great amount of correlation
between antagonist sides. In such case, the strong
correlations between 0.2AOC and 1.0AOC in
antagonist sides mean that the onset of contraction
do not interfere with the time delay. Radial deviation
has a smaller range of movement and for this reason
varying the time delays before the analyses did not
affect their correlation. Modulus was the most
frequent feature with strong correlation with varying
time delay what showed its repeatability. The
correlations were strong for antagonist movements
mainly in the inner side of the forearm.
Of all analysed features for 0.2AOC and
1.0AOC, it was demonstrated that in antagonist
movements RZ feature, zero-crossing and RMS are
very similar and can be used, if necessary, to reduce
the time delay for myoelectrical prosthesis
activation.
ACKNOWLEDGEMENTS
We would like to thank CNPq, CAPES and FINEP
for important funding and financial support and
Sidnei Schuindt for material support.
REFERENCES
Alves, N. & Chau, T. (2008) Stationarity distributions of
mechanomyogram signals from isometric contractions
of extrinsic hand muscles during functional grasping.
Journal of Electromyography and Kinesiology, 18,
509-515.
Beck, T. W., Housh, T. J., Johnson, G. O., Weir, J. P.,
Cramer, J. T., Coburn, J. W. & Malek, M. H. (2004)
Mechanomyographic and electromyographic time and
frequency domain responses during submaximal to
maximal isokinetic muscle actions of the biceps
brachii. European Journal of Applied Physiology, 92,
352-9.
Cipriano, J. J. (2003) Photographic manual of regional
orthopaedic and neurological tests, Atlanta, Georgia,
Lippincott Williams & Wilkins.
Englehart, K. & Hudgins, B. (2003) A robust, real-time
control scheme for multifunction myoelectric control.
IEEE Transactions on Biomedical Engineering 50,
848-854.
Nogueira-Neto, G. N., Müller, R. W., Salles, F. A.,
Nohama, P. & Button, V. L. S. (2008)
Mechanomyographic sensor: a triaxial accelerometry
approach. BIOSTEC. Funchal, Madeira - Portugal.
Nolan, Y. & Depaor, A. (2004) The mechanomyogram as
a channel of communication and control for the
disabled. International Conference of the IEEE EMBS.
26 ed. San Francisco.
Petitjean, M., Maton, B. & Fourment, A. (1998)
Summation of elementary phonomyograms during
isometric twitches in humans. European Journal of
Applied Physiology, 77, 527-35.
Prociow, P., Wolczowski, A., Amaral, T., Dias, O. &
Filipe, J. (2008) Identification of hand movements
based on MMG and EMG signals. BIOSTEC. Funchal,
Madeira - Portugal.
Silva, J. & Chau, T. (2003) Coupled microphone-
accelerometer sensor pair for dynamic noise reduction
in MMG signal recording. Electronics Letters, 39,
1496-8.
Smith, D. B., Housh, T. J., Johnson, G. O., Evetovich, T.
K., Ebersole, K. T. & Perry, S. R. (1998)
Mechanomyographic and electromyographic
responses to eccentric and concentric isokinetic
muscle actions of the biceps brachii. Muscle & nerve,
21.
Wojtczak, P., Amaral, T. G., Dias, O. P., Wolczowski, A.
& Kurzynski, M. (2009) Hand movement recognition
based on biosignal analysis. Engineering Applications
of Artificial Intelligence, 22, 608-615.
MECHANOMYOGRAPHIC ANALYSIS WITH 0.2 S AND 1.0 S TIME DELAY AFTER ONSET OF CONTRACTION
299
