DETECTION OF NORMALITY/PATHOLOGY ON CHEST
RADIOGRAPHS USING LBP
Juan Manuel Carrillo-de-Gea and Gin´es Garc´ıa-Mateos
Dept. Inform´atica y Sistemas, Faculty of Computer Science, University of Murcia, Spain
Keywords:
Image processing, Health informatics, X-rays, Computer-aided detection (CADe), Template matching, Local
binary patterns (LBP), Histograms.
Abstract:
Since the discovery of X-rays and their applications, medical imaging has been a great help for radiologists
in the diagnosis of diseases. In recent years, there has been a great effort in the computer vision community
in the research of systems for the analysis and extraction of useful information from medical images. In this
scenario, we have designed, implemented and validated a novel method to detect normality/pathology in chest
radiographs, which constitutes the core of a computer-aided detection (CADe) system. Although the problem
addressed is very complex and little explored, our approach is completely automatic, starting from the location
of areas of interest using template matching techniques. The main novelty of our contribution is the application
of a transformation known as local binary patterns (LBP) to these areas. LBP histograms are then used as input
features for a classification system, which is ultimately responsible for the decision of normality/pathology.
The results of our preliminary experiments are quite promising. With success rates in the best cases close to
90%, we believe that increased performance could be obtained with bigger training sets and more advanced
classification systems, which will make these systems to be fully viable in the near future.
1 INTRODUCTION
The diagnostic imaging is based on the use of differ-
ent physical principles to visualize the internal struc-
ture, composition and functions of living organisms,
so that medical professionals have evidence available
to identify lesions in patients. Among the various ex-
isting medical imaging techniques, we can name a
few: based on X-rays (including conventional radio-
graphy), based on nuclear magnetic resonance, based
on the reflection of ultrasound and based on emissions
from radioisotopes (Fleckenstein and Tranum-Jensen,
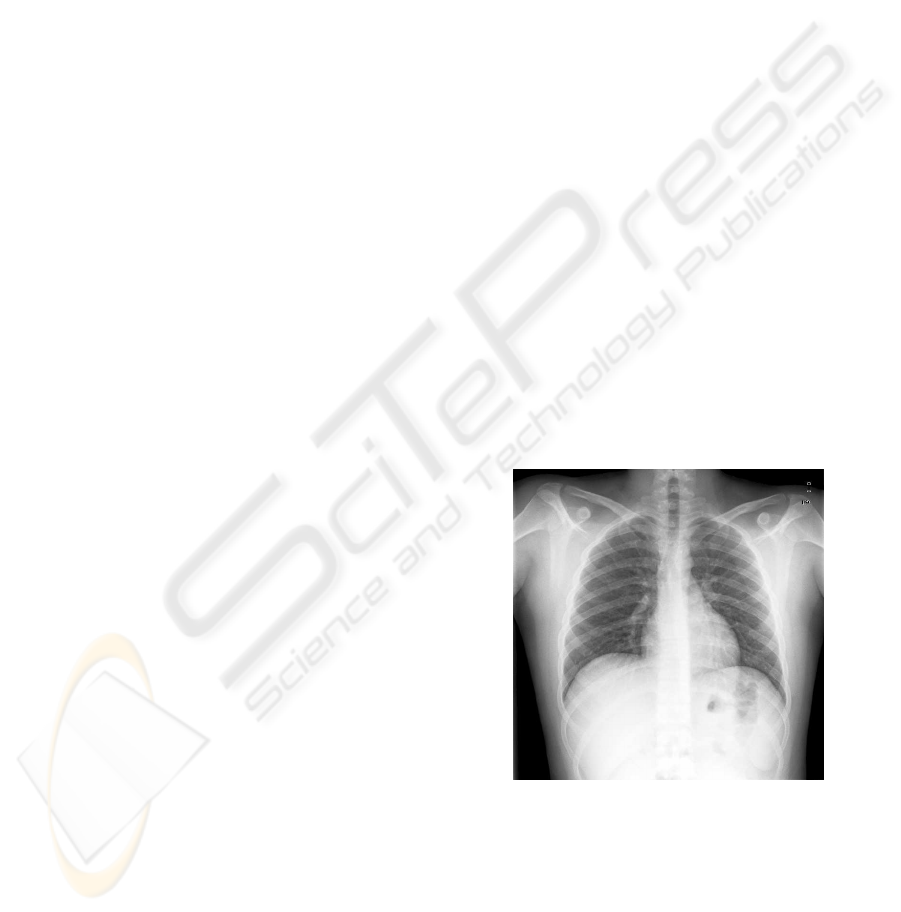
2001). Figure 1 shows a sample of a chest radiograph.
Despite the subsequent emergence of new imag-
ing techniques, nowadays conventional radiology re-
mains to have a central role in health care facilities
around the world, “due to its ability of revealing some
unsuspected pathologic alterations, its non-invasivity
characteristics, radiation dose and economic consid-
erations” (Campadelli and Casiraghi, 2005, p. 1431).
Also, computer systems have been widely used
in the analysis of medical signals. Over the past 15
years many research groups have focused on the de-
velopment of computerized systems that can examine
Figure 1: Male chest radiograph in posteroanterior (from
back to front) view.
different types of medical images and extract useful
information for medical professionals (Papadopoulos
et al., 2005), specifically assisting in image analy-
sis and diagnostic decision making. Such systems
are commonly referred to as computer-aided detec-
tion/diagnosis (CAD) systems.
As we will review in section 2, there is an interest-
167
Manuel Carrillo-de-Gea J. and García-Mateos G. (2010).
DETECTION OF NORMALITY/PATHOLOGY ON CHEST RADIOGRAPHS USING LBP.
In Proceedings of the First International Conference on Bioinformatics, pages 167-172
DOI: 10.5220/0002747001670172
Copyright
c
SciTePress

ing amount of work done in this field. However, our
proposal represents a new point of view, since it is a
method aimed to detect normality and pathology from
posteroanterior (PA) chest radiographs instead of be-
ing specialized in a predefined number of diseases in
specific organs of the body. We should note that the
problem addressed is a little explored field, and more
complex than most of the existing computer-aided de-
tection (CAD detection) systems.
The rest of the paper is organized as follows. In
section 2, we present a classification of CAD systems
and review some approaches. In section 3, the pro-
posed method is described in detail, and in section 4
we expose and discuss the results of performed tests.
Finally, conclusions are presented in section 5.
2 RELATED WORK
2.1 Classification of CAD Systems
According to (Kallergi, 2005; Papadopoulos et al.,
2005), computer-aided biomedical systems can be
classified into the first two categories of the list be-
low. More recently, a third type of system has been
incorporated (Hao et al., 2008):
• Computer-aided detection (CAD detection or
CADe) systems, which detect signs of pathology
in medical images by extracting features that are
highly correlated with the type and nature of the
abnormality under investigation, but do not pro-
vide a medical diagnosis as such.
• Computer-aided diagnosis (CAD diagnosis or
CADx) systems, which assist clinicians in diag-
nosis. Based on the same or additional features,
such schemes characterize the identified regions
according to their pathologies.
• Computer-aided change detection (CADcd) sys-
tems, which provide detection and diagnosis as
well as evaluation of the progression of the dis-
ease by identifying the areas that have changed.
2.2 Review of Existing CAD Systems
CAD systems have attracted the interest of the com-
puter vision community in the last decade. There is an
extensive literature in the domain of breast and lung
cancer imaging. Actually, there are techniques related
to the study of CAD systems ready to detect other
diseases such as severe acute respiratory syndrome
(SARS), acute intracranial haemorrhage (AIH), colon
polyps and thyroid gland nodules. We can even find
research works focused on the use of imaging tech-
niques different from x-rays, such as ultrasound.
On the other hand, the local binary pattern (LBP)
operator is introduced as a way to summarize the
structure of local gray levels of an image (Ojala et al.,
1996). Regarding the application of LBP or its varia-
tions to solve medical imaging problems, researchers
are getting very good results, often improving other
existing approaches (Iakovidis et al., 2008; Oliver
et al., 2007; Sørensen et al., 2008).
There are very few works dealing with the prob-
lem of normality and pathology detection without
specializing in certain diseases. Research done by
(Park et al., 2004), aimed to the detection of nor-
mal/abnormal texture on chest radiographs, repre-
sents an exception. However, they propose the uti-
lization of techniques different from ours, such as a
knowledge based lung field extraction method, fil-
tering to reduce ribs shadows, feature extraction ap-
plying a cuasi-Gabor filter in the frequency domain
and a k-nearest-neighbors classifier. Moreover, in
(Sørensen et al., 2008), authors try to solve the prob-
lem of texture classification in lung using LBP. How-
ever, in this research work, computed tomography
images are used instead of conventional radiographs.
LBP histogram similarity is used as distance measure.
Then, classification is performed using the k-nearest-
neighbor classifier with these distances as input.
3 OUR APPROACH USING LBP
In this section, we describe our CADe system spe-
cialized in PA chest radiographs. According to (Pa-
padopoulos et al., 2005), the main phases of a typical
CAD detection system are: preprocessing, segmenta-
tion, feature analysis (extraction, selection and valida-
tion), and classification, used to reduce false positives
or to characterize abnormalities. Figure 2 represents
the structure of this kind of systems.
3.1 Digital Radiography
The input of our system is a set of DICOM (Digi-
tal Imaging and COmmunications in Medicine) dig-
ital radiological images. The images are around
3000×3000pixels with 12 bits per pixel. DICOM is a
well-known standard for exchanging medical images,
designed for handling, storage, printing and transmis-
sion of medical images.
BIOINFORMATICS 2010 - International Conference on Bioinformatics
168
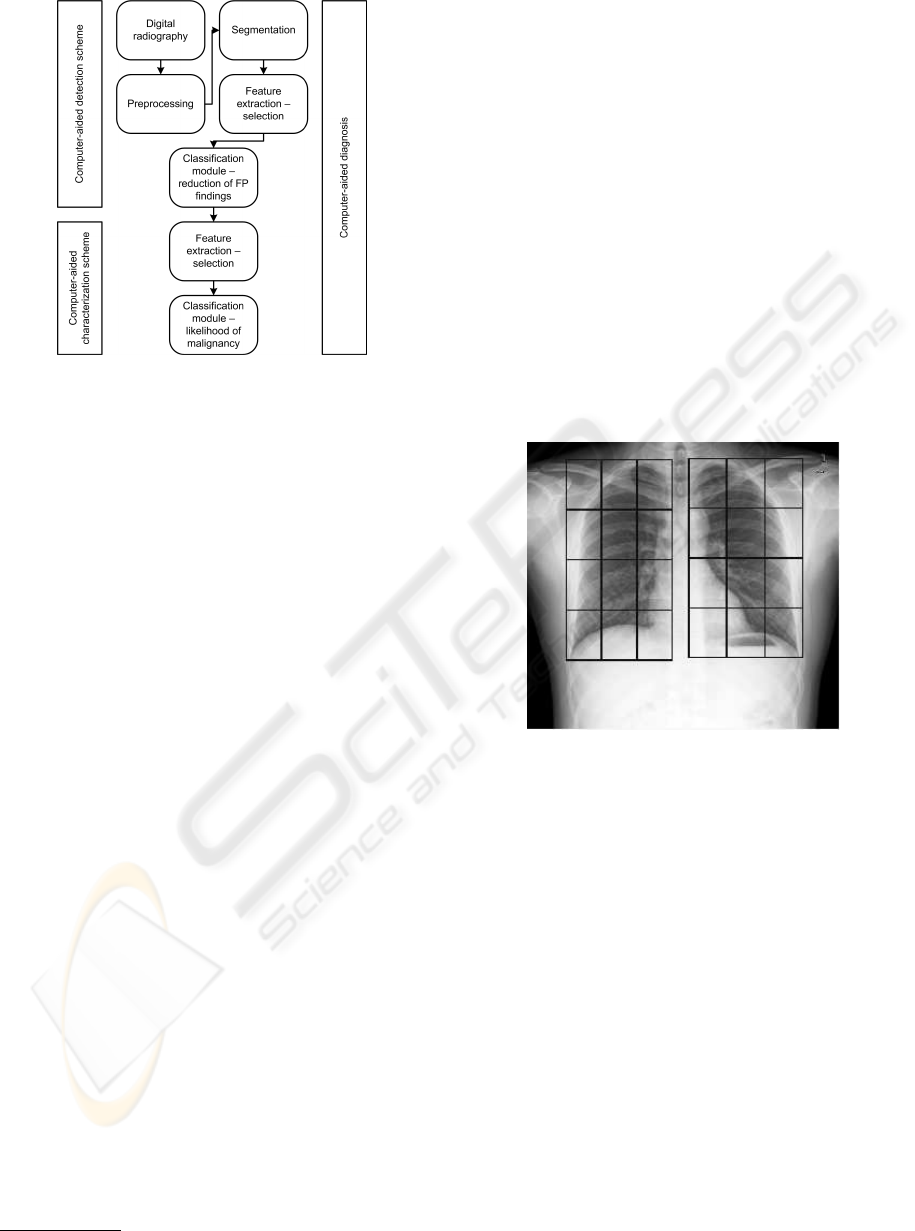
Figure 2: CAD architecture, (Papadopoulos et al., 2005).
3.2 Preprocessing
We first transform the digital radiographs into a for-
mat more suitable for easier processing, using MRI-
cro
1
, which is a freeware tool for efficient viewing
and exporting of medical images. We chose the PNG
(Portable Network Graphics) format, which is based
on a lossless compression algorithm. This step im-
plies the reduction of DICOM image depth from 12
bits per pixel to 8 bits per pixel; however, this more
compact representation of the image data still keeps
the information necessary for our purposes.
By using LBP, the necessity of applying im-
age equalization, or other preprocessing steps, is re-
moved. As we will describe in section 3.4, in LBP im-
ages only the value of a pixel in relation to its neigh-
bors is relevant. Nevertheless, since our system input
are high resolution radiographs, the needs of time and
memory could be too demanding. Therefore, before
the segmentation stage we apply a decimation to the
input images done by super-sampling interpolation.
3.3 Segmentation
In this stage, the original image is segregated into sep-
arate parts. As in our system the main object of inter-
est are the lungs, the goal of segmentation is to deter-
mine the position and size of both lungs.
There are a variety of techniques that can be used
for segmentation. Our proposal is based on template
matching, a technique for finding those parts of an
image which match a predefined template image.
1
http://www.sph.sc.edu/comd/rorden/mricro.html
3.3.1 Proposed Segmentation Method
We utilize patterns of the right and left lungs as input
for a template matching algorithm. It is important to
use different patterns of lungs, to include the wide va-
riety of appearances that may be caused by sex, age of
individuals and their archetype. Furthermore, a multi-
scale search allow us to locate lungs with different
sizes. The measure used for matching is a normalized
correlation coefficient (NCC).
The point of maximum correlation, which is de-
termined by the map of results produced by the tem-
plate matching algorithm, indicates the position of the
lungs. The dimensions are those corresponding to the
chosen pattern at the scale selected.
Finally, according to the obtained locations, the
lungs are divided into regions of equal size (see figure
3). This division is required in the subsequent steps.
Figure 3: Localization of lungs in a radiograph and segmen-
tation of them into regions. In the experiments described on
section 4, we have used a grid of 3× 4 rectangular regions.
3.4 Feature Extraction
Feature extraction consists on the calculation of some
image features, looking for a description of the prop-
erties of each object. Our proposal is to use LBP
as the basic method to extract texture features in the
images (Ojala et al., 1996). This is a gray-scale in-
variant texture measure, derived from a general def-
inition of texture in a local neighborhood. Although
this technique has been used in other medical imag-
ing applications, this work represents, to the best of
our knowledge, the first application to test of normal-
ity/pathology on radiographs.
The LBP operator was originally defined for 3× 3
neighborhoods, giving 8 bit codes based on the 8 pix-
els around the central pixel. The original LBP opera-
tor labels all the pixels of the image by thresholding
the neighborhood of each pixel with the central value
DETECTION OF NORMALITY/PATHOLOGY ON CHEST RADIOGRAPHS USING LBP
169
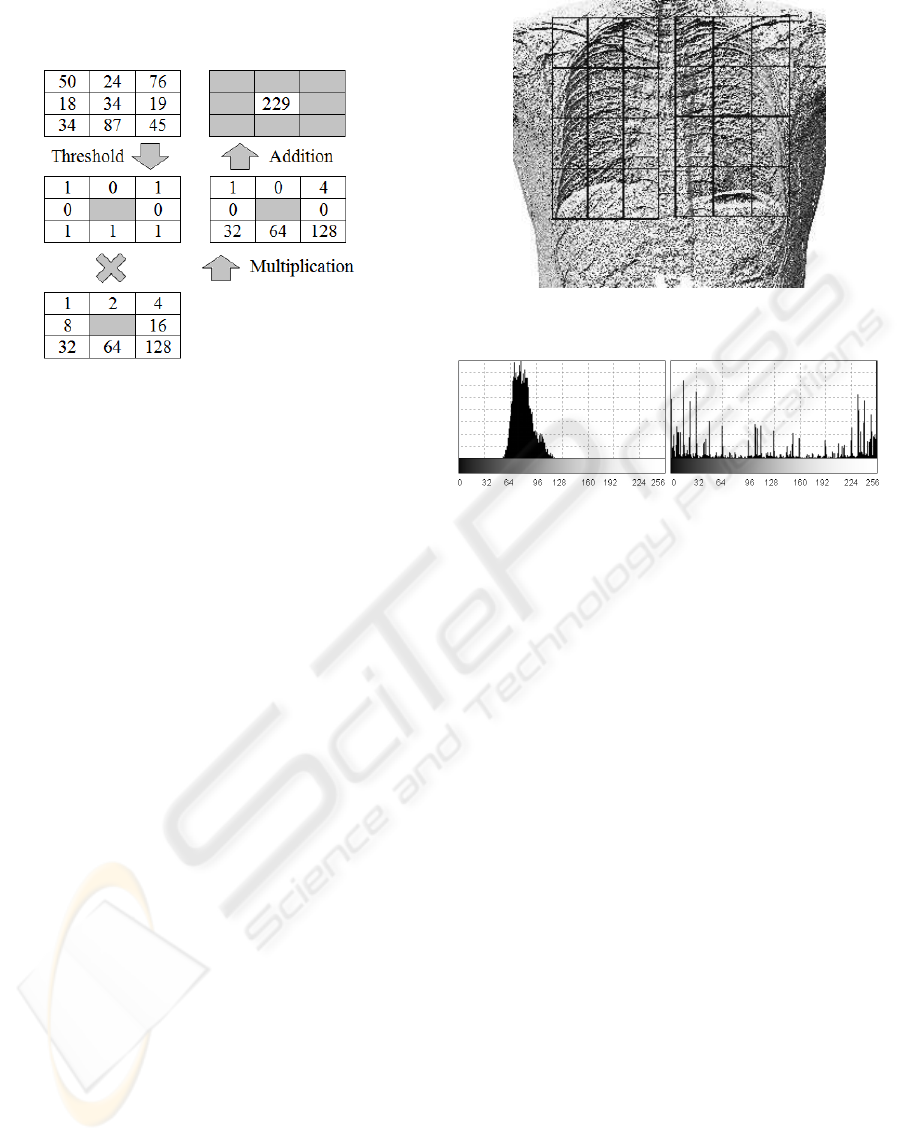
and considering the result as a binary number. A sam-
ple of this calculation is shown in figure 4.
Figure 4: Example of a LBP calculation.
The histogram of these 2
8
= 256 different labels
can then be used as a texture descriptor. The lo-
cal primitives encoded by these cells include differ-
ent types of curved edges, spots, flat areas, etc. The
calculation of the LBP codes can be easily done in a
single pass through the image. Formally, the LBP op-
erator takes the form shown in (1), where n iterates
on the 8 neighbors of the central pixel c, g
c
and g
n
are
the grayscale level values of c and n respectively, and
s defines the thresholding function shown in equation
(2).
LBP(x
c
, y
c
) =
7
∑
n=0
2
n
s(g
n
− g
c
) (1)
s(u) =
0, u ≥ 0
1, u < 0
(2)
3.4.1 Proposed Feature Extraction Method
We apply LBP technique going over each pixel in the
radiograph and accessing to its 3× 3 pixel vicinity. A
typical application to a chest radiograph is shown in
figure 5. Next, the LBP image is analyzed by regions
(see figure 6), computing the histograms of each re-
gion of the lungs (as previously found). Then we nor-
malize the histograms for comparison.
3.5 Classification
The diagnosis is an integrated medical procedure
aimed to the identification of a disease from its signs
and symptoms. In the same way, the classification
stage is an essential and critical part of a CAD sys-
tem. Classification methods range from techniques
that classify lesions according to their types, to tech-
niques that produce binary diagnostics, as is our case,
Figure 5: Application of LBP operator to a radiograph.
Figure 6: Comparison between the histogram of gray levels
and the LBP histogram calculated for the same region.
since the objective is to determine whether the radio-
graph is normal or contains some kind of pathology.
Despite the existence of a wide variety of complex
classifiers for analyzing medical images, since we are
limited by the number of training examples, we pro-
pose to use conventional classifiers.
3.5.1 Proposed Classification Method
The main stages of our approach are:
• Calculation of distances between histograms,
which consists of obtaining distances between
histograms of each region of the lungs of the given
radiograph and those histograms corresponding in
normal and pathologic radiographs of the training
set. At the same time, minimum distances to nor-
mal and pathologic radiographs are obtained for
each region. We use the Bhattacharyya distance
for comparison between two histograms.
• Differences between minimum distances and clas-
sification of regions. For each region, the dif-
ference between the minimum distance to nor-
mal and pathologic histograms is obtained. The
values obtained indicate whether a histogram is
closer to one class or another (to normal or pathol-
ogy). Apart from calculating the differences be-
tween minimum distances, we check the sign of
these differences and classify the regions as they
are closer to the corresponding region of the nor-
BIOINFORMATICS 2010 - International Conference on Bioinformatics
170
mal or the pathologic images.
• Classification of radiographs with or without in-
formation on discrimination of regions, which
is aimed at the final classification of the radio-
graph. We have analyzed three different clas-
sification methods, which will be compared in
the experiments: greater difference in absolute
value (GDAV), discrete voting (DV) and contin-
uous voting (CV). GDAV method consists on go-
ing through all regions of the lungs looking for
the difference between the minimum distances (as
calculated above) that is larger in absolute value.
Once obtained, the class of the radiograph is the
same as that of the region concerned. DV method
is a voting in which each region, depending on
its class, contributes with one positive or nega-
tive vote. When all the votes are collected, if
the number exceeds a certain threshold the image
is considered as normal and otherwise as patho-
logic. CV method is similar to DV method, but
now there is a global sum reflecting the accumula-
tion of the differences between the minimum dis-
tances of the input image to the normal and to the
pathologic images, for each region of the lungs.
At the end, if the sum exceeds a certain threshold
the image is considered as pathologic and other-
wise as normal.
Note that the threshold established for voting
methods is determinant to control the compromise be-
tween false positives (FP) and false negatives (FN).
In turn, the three methods have two variants: using
discrimination matrix or not. This matrix weights
the relative importance of each region of the grids in
which the lungs are divided. When no discrimination
matrix is used, we have no information about the level
of discrimination of each region for the determination
of normality and pathology, so it is assumed that all
the regions of the grid have exactly the same impor-
tance. The discrimination matrix is obtained automat-
ically through training with the same set of normal
and pathologic radiographs available.
4 EXPERIMENTAL RESULTS
The clinical performance of medical tests, includ-
ing medical imaging, is normally determined by es-
timating indexes for true positives (TP), true nega-
tives (TN), false positives (FP), false negatives (FP),
sensitivity, specificity and accuracy, among others
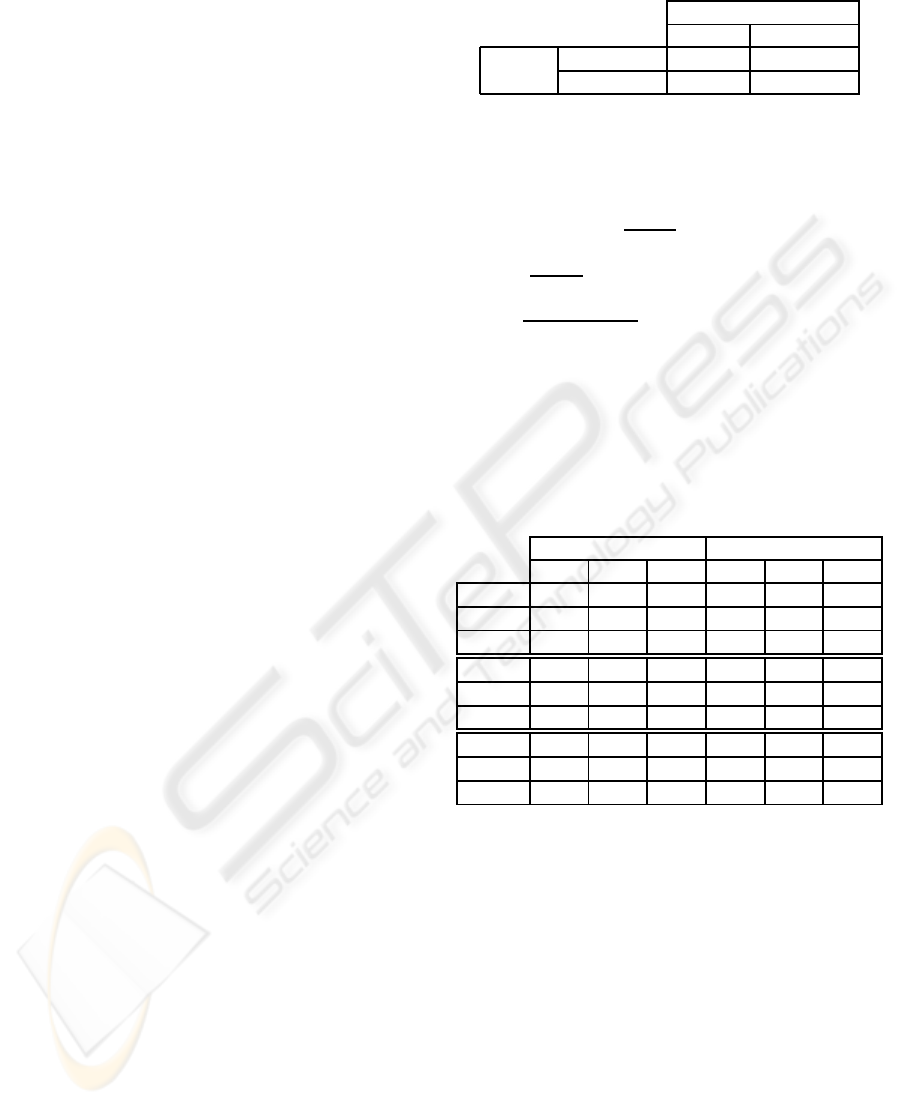
(Kallergi, 2005). In addition, confusion matrices as
the one shown in table 1 are often used.
We have 25 normal (12 males and 13 females) and
23 pathologic (13 males and 10 females) high resolu-
Table 1: Confusion matrix.
Prediction Outcome
Normal Pathologic
Actual Normal TN FP
Value Pathologic FN TP
tion DICOM images of chest radiographs to perform
tests. With this input, we have conducted an extensive
battery of tests using the leave-one-out technique.
In each test, we measured the following values:
sensitivity SENS =
TP
TP+FN
(probability of giving a
correct response to the pathologic cases), specificity
SPEC =
TN
TN+FP
(probability of obtaining a correct re-
sponse to the cases with no pathology) and accuracy
ACC =
TP+TN
TP+TN+FP+FN
(equivalent to the proportion
of successes over the total).
The experimental tests performed have produced
the results summarized in table 2.
Table 2: Results of the tests using the GDAV, DV and CV
classifiers (in this order). WOD and WD means without
discrimination and with discrimination matrix, respectively.
M, F and A means using male, female and all radiographs,
respectively.
WOD WD
M F A M F A
SENS 0.31 0.4 0.39 0.54 0.4 0.39
SPEC 0.67 0.85 0.96 0.83 1 0.88
ACC 0.48 0.65 0.69 0.68 0.74 0.65
SENS 0.46 0.6 0.96 0.92 0.7 0.78
SPEC 0.67 0.77 0.2 0.5 0.77 0.8
ACC 0.56 0.69 0.56 0.72 0.74 0.79
SENS 0.46 0.7 0.7 0.54 0.7 0.52
SPEC 0.67 0.54 0.44 0.75 1 0.88
ACC 0.56 0.61 0.56 0.64 0.87 0.71
4.1 Discussion of the Results
Given the considerable amount of data available, we
will focus our attention on the accuracy obtained in
each of the experiments. We will analyze and dis-
cuss methods that do not use discrimination matrix
and those that use it.
For the methods without discrimination informa-
tion, there is a general low levelof precision, as shown
in figure 7. This is more pronounced in the voting
methods. GDAV method has an interesting accuracy
rate, especially for female radiographs and when the
radiographs are considered all together. Male radio-
graphs are the most difficult to classify in this set of
data, but we believe that this fact is not generalizable.
Finally, although there are some cases with less than
DETECTION OF NORMALITY/PATHOLOGY ON CHEST RADIOGRAPHS USING LBP
171
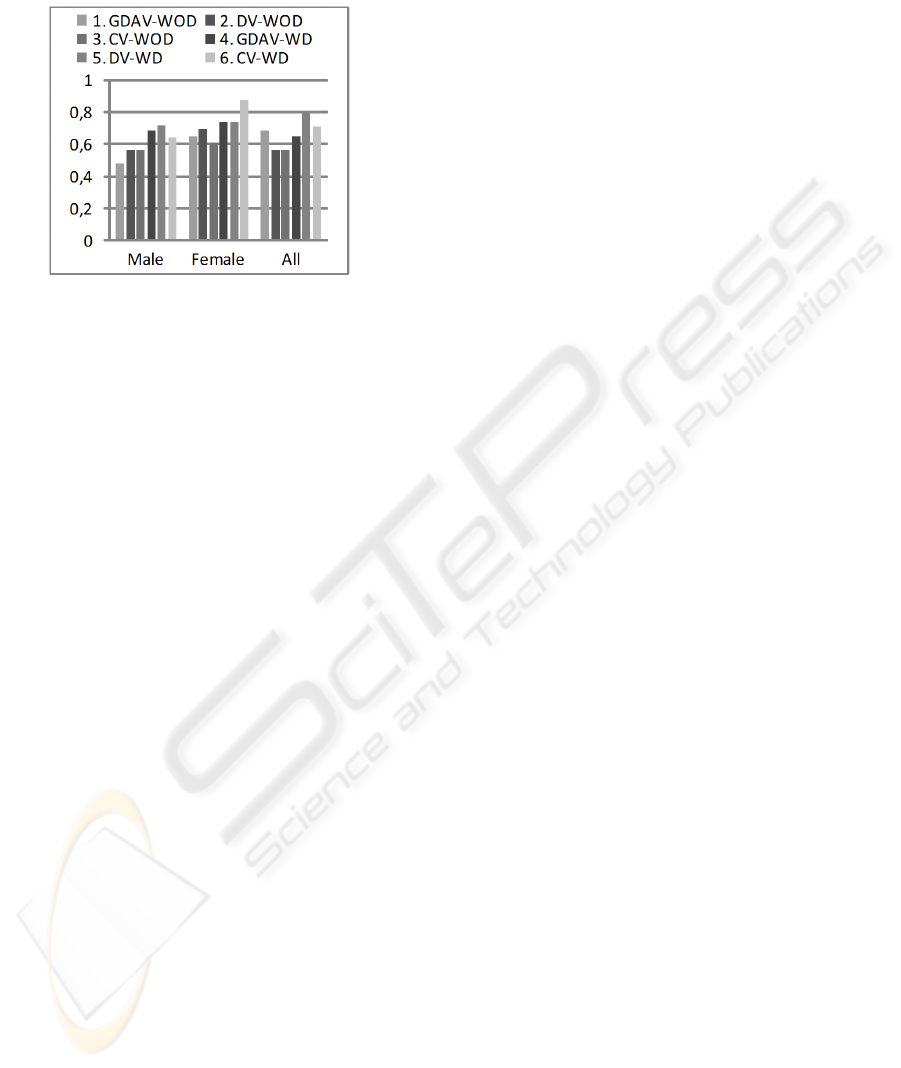
50% accuracy (on male radiographs), the average ac-
curacy is around 55% with peaks close to 70%.
Figure 7: Accuracy obtained with different classifiers with
and without using discrimination matrix.
Regarding discrimination methods, the degree of
accuracy achieved is clearly better, highlighting the
classification of female radiographs again. In most
cases, voting methods perform better than GDAV
method. It is remarkable that with the appropriate
threshold, the CV method classifies women radio-
graphs with success rates very close to 90% of accu-
racy. With all the radiographs the best is DV method,
reaching an accuracy near to 80%. In general, the av-
erage accuracy is around 70% considering all cases.
5 CONCLUSIONS
As a main general conclusion, the utilization of the
LBP texture analysis operator has emerged as an ef-
fective means for the study of radiographic images,
and more particularly chest radiographs, which are
the focus of this paper. LBP is a method that collects
interesting advantages as a small number of features
and a high power of discrimination.
The use of template matching technique at the
stage of segmentation to locate the lungs has been
satisfactory, despite its known limitations. The great
variability among individuals in terms of shape and
size of the lungs makes it difficult to achieve an opti-
mal location of these structures.
Our approach to the problem has been imple-
mented and tested as a first step towards a system
for the detection of normality and pathology in radio-
graphs which can be implanted in a hospital. The ra-
tios of success achieved, near 90% in the best cases,
are quite promising, although the method designed
should not be considered closed. Clearly, higher accu-
racy rates should to be obtained to achieve a practical
CAD system. To work in its development the use of
much larger sets of test will be essential.
ACKNOWLEDGEMENTS
This work has been supported by the Spanish MEC
and European FEDER grants TIN2006-15516-C04-
03 and Consolider CSD2006-00046.
REFERENCES
Campadelli, P. and Casiraghi, E. (2005). Lung Field Seg-
mentation in Digital Postero-Anterior Chest Radio-
graphs. In PRIA, volume 3687 of LNCS, pages 736–
745. Springer Heidelberg.
Fleckenstein, P. and Tranum-Jensen, J. (2001). Anatomy in
Diagnostic Imaging. Blackwell Science, 2 edition.
Hao, B., Leung, C. K.-S., Camorlinga, S., Reed, M. H.,
Bunge, M. K., Wrogemann, J., and Higgins, R. J.
(2008). A Computer-Aided Change Detection Sys-
tem for Paediatric Acute Intracranial Haemorrhage. In
C3S2E ’08, pages 109–111, New York. ACM.
Iakovidis, D. K., Keramidas, E. G., and Maroulis, D.
(2008). Fuzzy Local Binary Patterns for Ultrasound
Texture Characterization. In IAR, volume 5112 of
LNCS, pages 750–759. Springer Heidelberg.
Kallergi, M. (2005). Evaluation Strategies for Medical-
Image Analysis and Processing Metodologies. In
Medical Image Analysis Methods, chapter 12, pages
433–471. CRC Press.
Ojala, T., Pietik¨ainen, M., and Harwood, D. (1996). A Com-
parative Study of Texture Measures with Classifica-
tion Based on Feature Distributions. Pattern Recogni-
tion, 29(1):51–59.
Oliver, A., Llad, X., Freixenet, J., and Mart, J. (2007). False
Positive Reduction in Mammographic Mass Detection
Using Local Binary Patterns. In MICCAI ’07, volume
4791 of LNCS, pages 286–293. Springer Heidelberg.
Papadopoulos, A. N., Plissiti, M. E., and Fotiadis, D. I.
(2005). Medical-Image Processing and Analysis for
CAD Systems. In Medical Image Analysis Methods,
The Electrical Engineering and Applied Signal Pro-
cessing Series, chapter 2, pages 51–86. CRC Press,
Boca Raton, FL, USA.
Park, M., Jin, J. S., and Wilson, L. S. (2004). Detection
of Abnormal Texture in Chest X-rays with Reduction
of Ribs. In VIP ’05, pages 71–74, Darlinghurst, Aus-
tralia. Australian Computer Society, Inc.
Sørensen, L., Shaker, S. B., and de Bruijne, M. (2008).
Texture Classification in Lung CT Using Local Bi-
nary Patterns. In MICCAI ’08, volume 5241 of LNCS,
pages 934–941. Springer Heidelberg.
BIOINFORMATICS 2010 - International Conference on Bioinformatics
172
