
LOW NOISE MEASUREMENT OF PHOTOCURRENT FOR
CONTINUOUS GLUCOSE MONITORING
Low Noise Measurement System Enables Continuous Monitoring of Glucose in
Subcutaneous Interstitial Fluid
Daniel W. Cooley
1
and David R. Andersen
1,2
1
Department of Electrical and Computer Engineering, The University of Iowa, 132 IATL, Iowa City, IA, U.S.A.
2
Department of Physics, The University of Iowa, 132 IATL, Iowa City, IA, U.S.A.
Keywords: Continuous glucose monitoring, IR photodiode, Transimpedance amplifier.
Abstract: We have developed a data acquisition unit (DAU) for continuous, low noise measurement of glucose
concentration in subcutaneous interstitial fluid (ISF). The system is comprised of a glucose sensor
(Olesberg, 2006), op-amps for signal conditioning, and delta-sigma (∆-Σ) ADCs. The glucose sensor has
two IR LEDs which emit light with wavelength of 2.2 to 2.4 μm where there are peaks in the glucose
absorption spectrum. The IR light propagates through a glass fluid chamber containing interstitial fluid and
a linearly variable bandpass filter before impinging on a 32 channel photodiode array. The center frequency
of the filter varies along one dimension of the filter, so that each photodiode is sensitive to equally spaced
portions of the glucose absorption spectrum. Transimpedance amplifiers (TIAs) convert the photocurrents
into voltages which are sampled by ADCs. We developed a noise model which predicts the noise
characteristics of the system. We use low noise metal film resistors to verify the DAU noise characteristics.
Non-ideal characteristics such as limited photocurrent and low photodiode shunt resistance increase
difficulty of obtaining low noise measurements. We demonstrate that the DAU provides low noise (41.7 dB
SNR) photocurrent measurements and is suitable for use in a continuous glucose monitoring system.
1 INTRODUCTION
We have designed and demonstrated a data
acquisition unit for low noise measurement of
glucose in subcutaneous ISF. In the future the
glucose sensor and DAU will be miniaturized for
use in an implantable, continuous glucose monitor.
The motivation for this research is clear as 23.8
million people in the U.S.A. had diabetes as of 2007
(CDC, 2007). Self monitoring of blood glucose
(SMBG) is one important method used to control
diabetes (Saudek, 2006)(Chia, 2004). Efforts
towards continuous monitoring of blood glucose are
under way to prevent high and low blood sugar
conditions and to use as part of an artificial pancreas
offering a type of "cure" for diabetes (Chia, 2004).
We measure the glucose concentration in ISF instead
of whole blood because it provides several
advantages. Measuring ISF glucose by an implanted
device is less painful and less invasive than repeated
use of finger-sticks to measure blood glucose
concentration (Rebrin, 2000). An implantable
glucose monitor would also require limited user
intervention and not require the cost of materials
required for SMBG with finger-sticks (Olesberg,
2006).
The glucose sensor measures the absorption
spectrum of glucose by passing IR light through a
fluid chamber containing ISF to a spectrometer. Two
LEDs provide IR light with wavelength in the range
2.2 to 2.4 um, near features of the glucose
absorption spectrum. The light propagates through a
linearly variable bandpass filter before impinging on
a 32 element photodiode array. Measuring the
current from each photodiode provides data for
determining the spectrum of the analyte. Our IR
photodiodes have low photocurrent due to the
limited amount of light that reaches the filter and is
transmitted to each photodiode. This limits the
maximum SNR the system can achieve. The shunt
resistance, R
T
, of the photodiodes is relatively low
which also limits the system SNR. The DAU must
provide low noise glucose measurements at a
195
W. Cooley D. and R. Andersen D. (2010).
LOW NOISE MEASUREMENT OF PHOTOCURRENT FOR CONTINUOUS GLUCOSE MONITORING - Low Noise Measurement System Enables
Continuous Monitoring of Glucose in Subcutaneous Interstitial Fluid.
In Proceedings of the Third International Conference on Biomedical Electronics and Devices, pages 195-200
DOI: 10.5220/0002747901950200
Copyright
c
SciTePress
frequency of 1 Hz on a continuous basis. We use
low noise metal film resistors to simulate the
glucose sensor while evaluating noise characteristics
of the DAU.
2 THEORY
2.1 Glucose Sensor
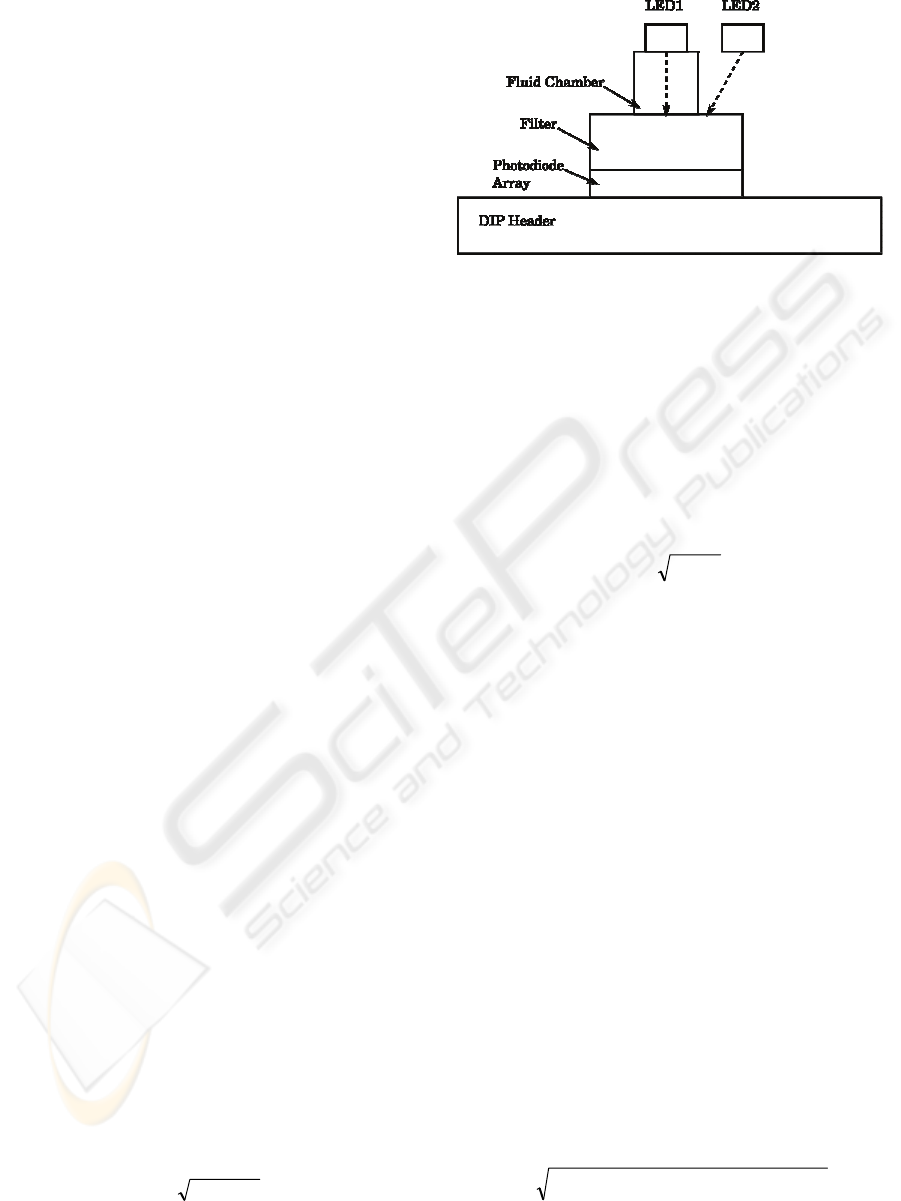
Figure 1 shows a schematic of the glucose sensor.
The sensor has two IR LEDs. LED1 emits light
directly into the fluid chamber containing ISF and
through the linearly variable filter to the 32 channel
photodiode array. Light from LED2 goes around the
fluid chamber before reaching the filter and
photodiodes. The fluid chamber is a thin-walled
capillary with square cross section and 0.8 mm inner
dimensions. The center frequency of the linearly
variable bandpass filter changes along the length of
the filter within the 2.2 to 2.4 μm wavelength range.
Thus each photodiode collects light from a different
portion of the glucose absorption spectrum when
LED1 is on. As IR light from LED1 propagates
through the ISF sample, glucose absorbs a portion of
the light near peaks in the glucose absorption
spectrum.
When the glucose sensor is used with the DAU,
we measure photocurrents with one LED on at a
time and also without any LEDs on in order to
normalize and compensate the sensor data for
temperature changes. To verify the DAU noise
characteristics in preparation for use with glucose
sensors we use low noise metal film resistors with
resistance equal to the photodiode shunt resistance in
place of the photodiodes.
Next we develop a mathematical model for the
noise present in the DAU to evaluate the system
noise performance.
2.2 Noise Model
2.2.1 Transimpedance Amplifier
Two types of noise that affect the system operation
are thermal noise and shot noise (Motchenbacher,
1993). The random motion of charge carriers in a
conductor causes thermal noise, also known as
Johnson noise. The thermal noise voltage of a
resistor R is in series with the resistor and is
f4kTRE
T
Δ=
,
(1)
Figure1: The glucose sensor. LED1 emits light through
fluid chamber to the filter and diode array. LED2 light
goes around the fluid chamber.
where k is Boltzmann's constant, T is temperature in
Kelvin, and ∆f is the measurement bandwidth. The
series combination of the resistor and its thermal
noise voltage may be converted into a current source
of value E
T
/R in parallel with the resistor. Shot noise
occurs in transistors and diodes and is due to
quantized current flowing across a potential barrier.
The shot noise current for I amps of current is
f2qII
S
Δ=
,
(2)
where q is the electronic charge.
We chose the transimpedance amplifier, Figure
2, to convert photodiode current into a voltage for
measurement by an ADC. Another method would be
to use a current input ADC, but we chose the TIA in
order to maximize the system SNR. To develop the
noise model we start with a schematic for the TIA
including op amp noise terms (Steffes, 2005) as
shown in Figure 3. Here E
NI
is the op amp input
noise voltage, I
BI
is the op amp input current noise,
R
T
is the test resistor simulating the photodiode
shunt resistance, I
RT
is the noise current equivalent
to the thermal noise from R
T
, R
F
is the feedback
resistor, and E
RT
is the feedback resistor thermal
noise. We omitted the photodiode series resistance
from the noise model because of its relatively small
magnitude.
We find an expression for the noise at the TIA
output by incoherently adding the noise terms (E
NI
,
I
BI
, I
RT
, and E
RF
) multiplied by the gain between the
noise term and the TIA output. With G
N
= 1 + R
F
/R
T
and combining some terms, the noise voltage at the
TIA output is Eq. 2 from (Steffes, 2005) with R
S
=
0:
()()
NF
2
FBI
2
NNIO
G4kTRRIGEE ++= .
(3)
BIODEVICES 2010 - International Conference on Biomedical Electronics and Devices
196
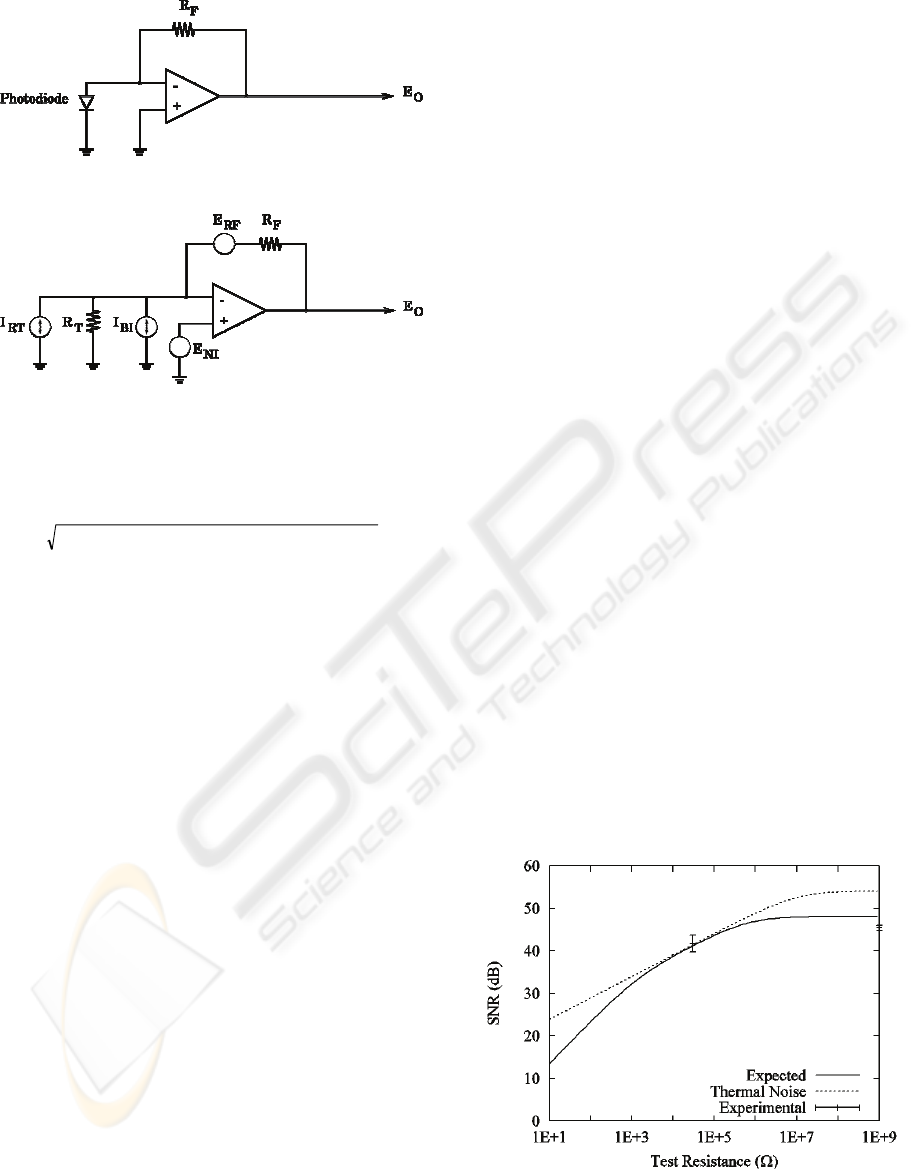
Figure 2: Transimpedance amplifier.
Figure 3: TIA with noise terms.
Including a term for the ADC noise voltage, V
ADC
,
and the voltage reference noise, V
REF
, in Eq. 3 we
find a noise model for the TIA:
()()
2
REF
2
ADCNF
2
FBI
2
NNIO
V/NVG4kTRRIGEE Δ+Δ+++=
, (4)
where typically N = 250 ADC samples are averaged
per data point. We calculate the SNR of the noise
model using the expression
(
)
OFPC10
E/RIlog10SNR = ,
(5)
where I
PC
is the photocurrent. One multiplies the
logarithm in Eq. 5 by 10 instead of 20 when
calculating the SNR because the photocurrent is
proportional to the luminosity of light arriving at the
photodiode and luminosity is luminous power per
unit area.
A plot of the noise model, Figure 4, has three
straight segments and a different term from Eq. 4 is
dominant in each segment. The left segment has a
slope proportional to 1/R
T
and is due to the E
NI
term
in Eq. 4. As E
NI
increases the left segment of the
curve will shift down. The middle segment has a
slope inversely proportional to the square root of R
T
and is due to the third term, the thermal noise. An
increase in thermal noise will reduce the SNR. The
middle section of the curve also shows that
increasing R
T
increases the SNR. The final, flat
section arises from the combination of noise from
thermal noise of the feedback resistor, input current
noise, V
ADC
, and V
REF
. Calculating these noise
voltages with our final component values shows that
the voltage reference noise provides the SNR limit
within the right segment of Figure 4.
2.2.2 Photodiode
The IR photodiode I-V characteristic differs from
typical Si photodiode characteristic curves in several
ways. The IR photodiodes have lower reverse
breakdown voltage, higher reverse saturation
current, lower shunt resistance, and, when operating
as part of the glucose sensor, lower photocurrent
than Si photodiodes. For example the IR
photodiodes have reverse breakdown of 1 to 2 volts
and reverse saturation current of approximately 1A.
The S1133 has a maximum reverse voltage of 10V
and dark current of 15 pA at 10V reverse voltage
(Hamamatsu, 2001).
From our experimental results I
PC
is measured to
be 10 nA. We chose a value of 10 M for R
F
in
order to yield a signal voltage of 0.1 V that is within
the input range of the ADC. The relatively small
photocurrent due to the limited amount of light
reaching the filter and limited amount of light
transmitted through the filter reduce the achievable
SNR when compared to Si photodiodes in typical
applications. For example, the S1133 Si photodiode
can provide 100 A of output current with high
enough illumination (Hamamatsu, 2001), which is
10,000 times more photocurrent than we can obtain
from our glucose sensor.
The IR photodiodes have shunt resistance, R
T
, of
approximately 30 k. This also increases the
difficulty in increasing SNR since the thermal noise
is proportional to the amplifier gain, 1 + R
F
/R
T
. The
typical S1133 shunt resistance is 100 G
(Hamamatsu, 2001), much greater than the IR
photodiode shunt resistance. The low shunt
resistance is due to the increased bandgap
wavelength of the IR photodiodes (2.5 m) versus
that of typical silicon diodes (1.1 m).
Figure 4: Plot of the output from our noise model with
N=250. Thermal noise and experimental data also shown
for comparison.
LOW NOISE MEASUREMENT OF PHOTOCURRENT FOR CONTINUOUS GLUCOSE MONITORING - Low Noise
Measurement System Enables Continuous Monitoring of Glucose in Subcutaneous Interstitial Fluid
197
We cannot reverse bias the IR photodiodes due
to their high reverse saturation current. Increasing
reverse bias increases the dark current and shot noise
on the dark current would dominate other noise
sources and reduce the SNR. Also, since the dark
current increases with more reverse bias as the
photocurrent remains constant, a smaller portion of
the current flowing into the TIA is due to the
photocurrent, reducing the SNR.
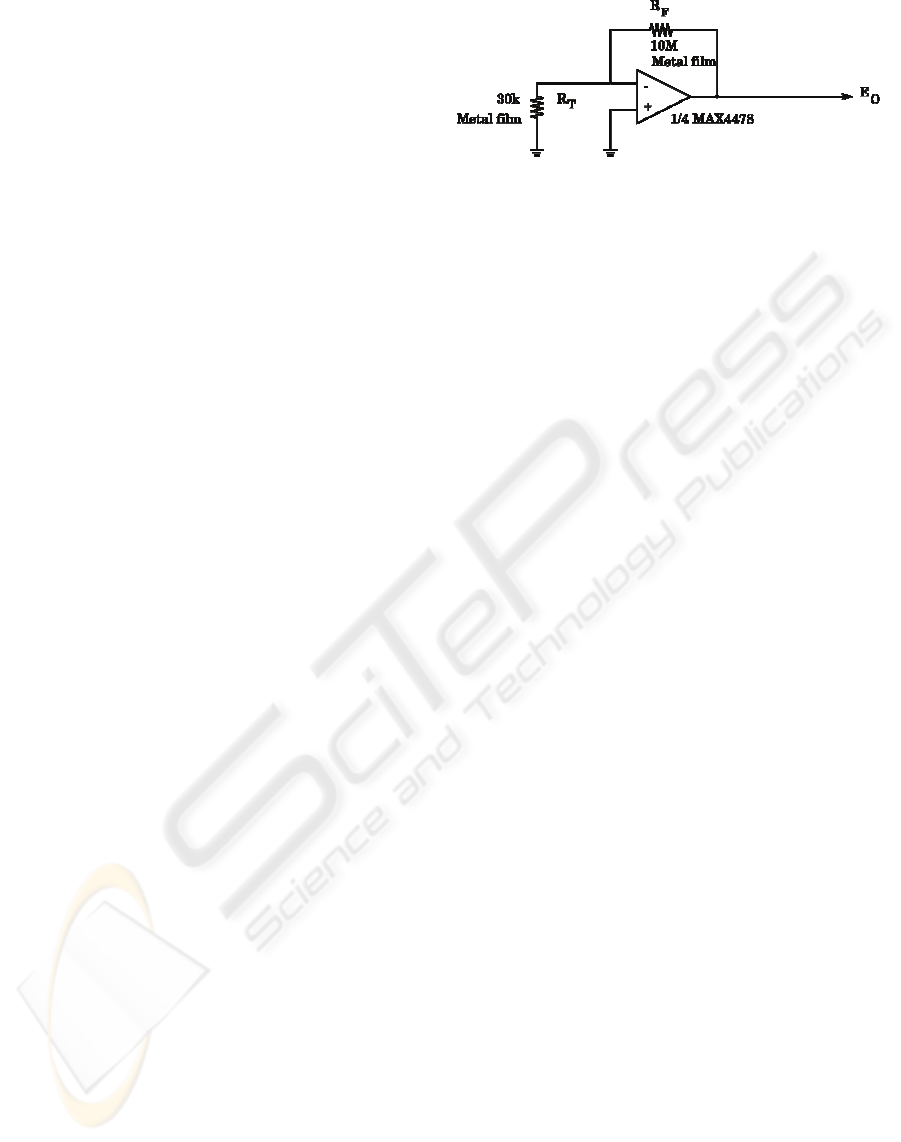
2.3 Circuit Design
Figure 5 shows the final circuit design used for each
channel. We added the shot noise on the offset
current, op amp input current noise, and op amp
voltage noise for a number of op amps to select an
op amp for the TIA. Here the offset current is the
sum of the op amp input offset current and the
current in R
T
due to the op amp offset voltage. We
included shot noise on the offset current since the
source of the photodiode current is a diode junction.
We chose the MAX4478 (Maxim, 2005) because it
minimized the sum of these noise voltages.
The chief factors affecting choice of the ADC
are the resolution, number of delta-sigma (∆-Σ)
blocks in the device, ability to daisy-chain serial data
ports of devices, and conversion time. We chose a
24-bit ∆-Σ ADC with 8 channels, 8 ∆-Σ blocks, and
maximum sampling rate of 52.7 kHz when using
high resolution (Texas Instruments, 2008). Four
ADCs are necessary to sample all 32 channels
simultaneously. We need a minimum of 20 bit ADC
resolution to keep the quantization error well below
the system noise. Since there is one ∆-Σ block for
each photodiode channel, multiplexing ADCs is
unnecessary, allowing time efficiency and
simplifying the software required to archive data.
The serial ports of the ADC we chose can be
daisy-chained which also simplifies the system
because only one serial port is required. We need to
record four types of samples to calculate the glucose
concentration: with LED 1 on/LED2 off, both LEDs
off, LED1 off/LED2 on, and both LEDs off. Since
we sample all channels simultaneously and typically
record N = 250 samples per second, recording four
types of data samples requires a sampling rate of 1
Figure 5: Schematic of one DAU channel.
kHz, well below the ADS1278 maximum sample
rate. We selected a low noise voltage reference with
noise voltage of 1.5 μV and a low temperature
coefficient of 0.6 PPM/deg. C. (Cirrus Logic, 2009)
3 EXPERIMENT AND RESULTS
Figure 6 shows the method we use to record
experimental data. The time per data point, T
Data
, is 1
second and N = 250 so that T
Sample
= 1/250 second.
The DAU samples the voltage on all channels at
points labeled S
n
. At points labeled D
m
the average
value of the samples for all channels are calculated
and archived. When we use the glucose sensor the
four types of data mentioned above must be
recorded in each sample period to calculate the
glucose concentration. While verifying the SNR of
the DAU system in this paper we utilize low noise
resistors and only one of the four types of data is
required since there are no LEDs present without the
glucose sensor.
To test the SNR we record a large (1k data
points) set of experimental data and calculate the
SNR. Figure 7 shows a plot of channel voltage vs.
time for a representative channel. Figure 7 shows
2000 data points from channel 1 taken at a rate of 1
Hz – the last 1000 data points were used to calculate
the SNR. The plot shows approximately 20 µV of
drift with +/- 10 µV of noise in the last 1000 data
points. The standard deviation of this portion of data
is 9.12 μV and the SNR for channel 1 is calculated
to be 40.4 dB. Fig. 8 shows the SNR for all 32
channels. The mean SNR is 41.7 dB and the
standard deviation of the SNR is 2.0 dB. Channels
15 and 31 do have 5 to 7 dB more noise than the
other channels. This is likely due to slight
differences in noise characteristics of the op amps.
Fig. 4 also shows the thermal noise present in the
BIODEVICES 2010 - International Conference on Biomedical Electronics and Devices
198
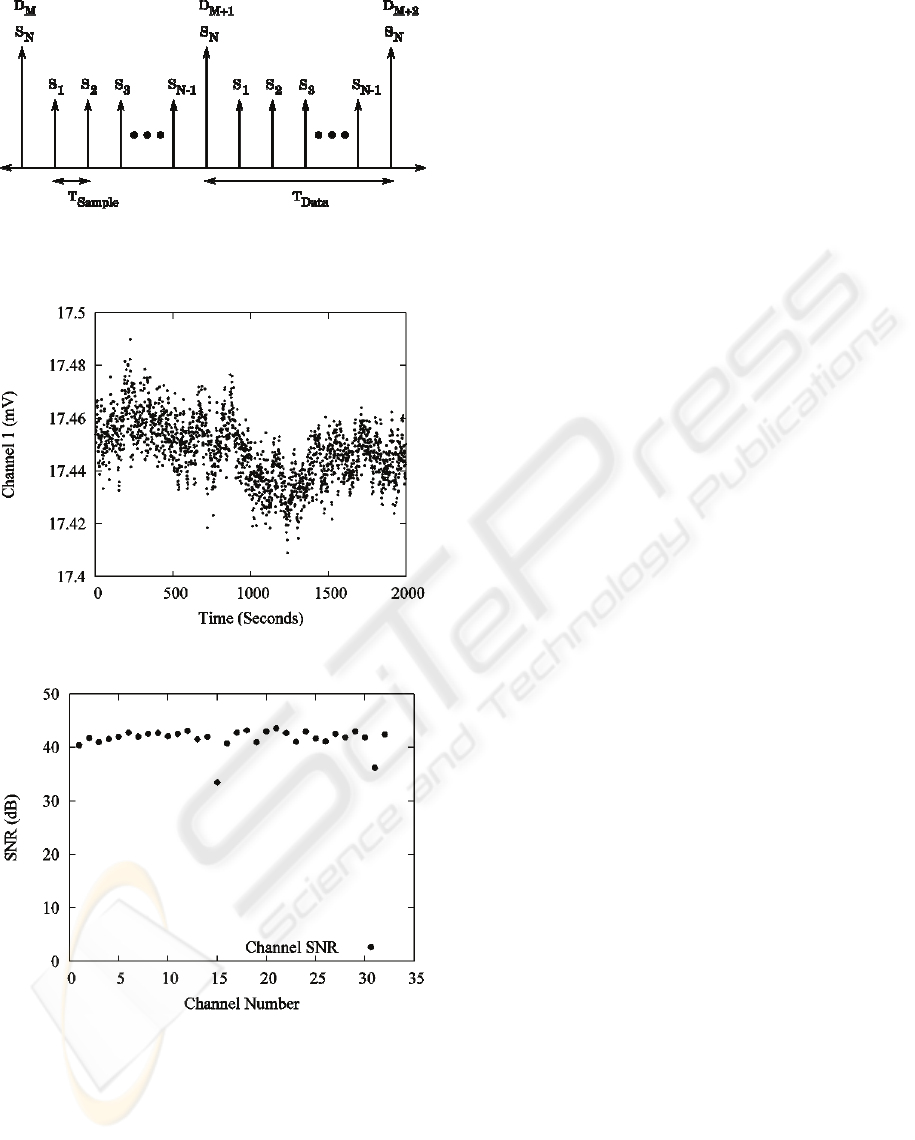
Figure 6: Method for recording experimental data.
Channels are sampled at S
n
and data points are calculated
and recorded at D
m
.
Figure 7: Voltage on channel 1 versus time.
Figure 8: SNR of all 32 channels.
TIA to indicate the maximum SNR possible if the op
amps, ADCs, and voltage reference were ideal
components. The experimental results are within one
standard deviation of both the expected noise and
thermal noise for R
T
= 30 kΩ but the experimental
data point with an open circuit, 45.4 dB, is slightly
below the expected noise of 48 dB. This difference
has been traced to excess ripple on the voltage
reference supply voltage.
4 DISCUSSION
Although thermal noise limits the DAU SNR when
using low noise metal film test resistors, additional
noise sources will be present when using actual
glucose sensors with the DAU. The photocurrent
and dark current would both provide shot noise since
they originate from a diode junction. In order to
eliminate shot noise from dark current the
photodiodes cannot be reverse biased. The shot
noise from 10 nA of photocurrent is 57 fA. The
voltage created by this current passing through R
F
is
0.57 µV. The mean SNR of 41.7 dB corresponds to
6.76 µV of noise voltage. Adding these two noise
voltages still results in 41.7 dB SNR so the shot
noise on the photocurrent will not significantly
degrade the SNR.
A fan cooled the DAU to reduce the effects of
thermal drift during our experiments. This is
reasonable here since when the DAU and glucose
sensor are designed into an implantable device the
system will be in an environment with constant
temperature.
5 CONCLUSIONS
The experimental measurements of SNR agree very
well with the SNR calculated with the noise model
for the TIA. The experimental SNR of 41.7 dB for
R
T
= 30 kΩ is also very close to the thermal noise
limit, i.e., it is the maximum SNR possible with this
TIA design and R
T
of 30 kΩ. This indicates the
DAU is acceptable for use with prototype glucose
sensors and for future miniaturization of the DAU
system and glucose sensor into a continuous glucose
monitoring system.
A noise model was developed for the DAU and
experimental data verified that the system works as
expected by theory. In the future we will use the
DAU to test glucose sensors by measuring
absorption spectra of water and glucose. We also
plan studies using ISF with the glucose sensors
before miniaturization of the sensor and DAU
electronics.
LOW NOISE MEASUREMENT OF PHOTOCURRENT FOR CONTINUOUS GLUCOSE MONITORING - Low Noise
Measurement System Enables Continuous Monitoring of Glucose in Subcutaneous Interstitial Fluid
199

ACKNOWLEDGEMENTS
The authors would like to acknowledge support from
NIH Grant No. DK064569.
REFERENCES
Olesburg, J. T., Cao, C., Yager, J. R., Prineas, J. P.,
Coretsopoulos, C., Arnold, M. A., L. J. Olafsen, L. J.,
Santilli, M., 2006. Proc. of SPIE 694, 609403.
Centers for Disease Control and Prevention, 2007.
"National Diabetes Fact Sheet, 2007,” Department of
Health and Human Services - Centers for Disease
Control and Prevention.
Saudek, C. D., Derr, R. L., Kalyani, R. R., 2006. JAMA
295 No. 14 p. 1688.
Chia, C. W., Saudek, C. D., 2004. Endocrinol. Metab.
Clin. N. Am. 33 p. 175.
Rebrin, K., Steil, G. M., 2000. Diabetes Tech. and
Therapeutics 2 No. 3 p. 461.
Motchenbacher, C. D., Connelly, J. A., 1993. Low-Noise
Electronic System Design, John Wiley and Sons. New
York.
Steffes, M., 2005. Application Report SBOA066A, "Noise
Analysis for High-Speed Op Amps,” (www.ti.com).
Hamamatsu, 2001. Datasheet, “Si Photodiode
S1087/S1133 series,” Hamamatsu Photonics K. K.
Maxim, 2005. MAX4478 datasheet. “MAX4478 SOT23,
Low-Noise, Low-Distortion, Wide-Band, Rail-to-Rail
Op Amps,” Maxim Integrated Products, Inc.
Texas Instruments, 2008. ADS1278 datasheet. “ADS1278
Quad/Octal, Simultaneous Sampling, 24-Bit Analog-
to-Digital Converters,” Texas Instruments, Inc.
Cirrus Logic, 2009. VRE3025 datasheet. “VRE3025
Precision Voltage Reference,” Cirrus Logic, Inc.
BIODEVICES 2010 - International Conference on Biomedical Electronics and Devices
200
