
EEG SIGNALS IN EPILEPSY AND MIGRAINE
Analysis and Simulations by Multi-agent Systems
Alessandro Vigan
´
o, Neri Accornero
C.I.S.B. InterDept. Research Center, Sapienza University - Roma, Italy
Alfredo Colosimo
Dept of Neurology, Sapienza Universita’ - Roma, Italy
Keywords:
EEG, Multi Agent Systems, Epilepsy, Migraine.
Abstract:
The preliminary results of some observations carried out on the spectral content of EEG signals from migran-
ious and epileptic individuals and, in particular, on the spatio-temporal correlation of the neuronal activation
in the two pathologies, are presented. In the aim to simulate the qualitative features of EEG signals associated
to migraine and epilepsy, we used a computational approach based upon Pearson correlations and a Multi
Agent System. Our findings, although still not conclusive, revealed considerable heuristic power on the sole
assumption of a similar synchronization process of the underlying neuronal population, and may provide in
the long term useful hints to a very difficult problem.
1 INTRODUCTION
According to the World Health Organization, epilepsy
is one of the most common neurological disorder and
its prevalence in the total world population is of the
order of about 1%, with no major geographical bias.
Migraine, on the other hand, although less severe as a
disorder, is much more common and its well known
worldwide distribution, according to some hypothe-
sis, linked to economic levels and life styles (Lipton
and Bigal, 2005).
It has been suggested some time ago (Sack, 1992;
Ottman and Lipton, 1996) that epilepsy and migraine
are correlated, indicating that a crucial role in both
pathologies is played by an abnormal synchronization
of the involved neuronal populations. This has been
recently reassessed (Rogawski, 2008) on the basis of
accurate epidemiological data (Fig. 1). Thus, re-
cruiting a larger and larger number of phase-coupled
neurons, should account for: i) the peculiar activity
bursts appearing in EEG signals; ii) the close tem-
poral correlation of the activity bursts with macro-
scopic clinical symptoms like epileptic seizures or in-
dividual perceptions like visual aura; iii) the typical
rythmic occurrence and spatial patterns of the activ-
ity waves. Such apparently simple phenomena ap-
pear amenable to simulation, taking advantage of the
continuous increase in hardware power and flexibil-
ity/sophistication of simulation environments (Brette
et al., 2007).
We report here the preliminary results of a study
on the common features of EEG signals associated to
migraine and epilepsy which include: i) a systematic
correlation of the spectral content of the EEG signals
recorded from individuals with diagnosis of focal and
diffused epilepsy and of migraine, and ii) a simulation
study of the shift from random to synchronous activity
within an artificial Multi Agent System.
2 METHODS
2.1 EEG Records and Exclusion
Criteria
The EEG signals analyzed in this work have been
recorded in the Dept. of Neurological Sciences of
Univ of Rome - Sapienza, according to the stan-
dard protocol (Flink et al., 2002) and using a 10–
20 montage, except in the case of the migraine sig-
nals, which came from the Australian EEG Database
(Hunter et al., 2005). The exclusion criteria used by
clinicians to select the signals included the absence of
447
Viganó A., Accornero N. and Colosimo A. (2010).
EEG SIGNALS IN EPILEPSY AND MIGRAINE - Analysis and Simulations by Multi-agent Systems.
In Proceedings of the Third International Conference on Bio-inspired Systems and Signal Processing, pages 447-451
DOI: 10.5220/0002750204470451
Copyright
c
SciTePress

56%
24%
17%
3%
Non Migraine-affected
people
Interictal Migraine
Postictal Migraine
Preictal Migraine
Figure 1: Statistics about the migraine and epilepsy comorbidity. The illustration shows the prevalence of migraine disease in
a Norwegian epilepsy-affected population. (Data from table 2 in (Syvertsen et al., 2007).)
any pharmacological, psychiatric or behavioral inter-
ference potentially able to produce signal alterations.
2.2 Data Analysis
The software toolset used in this work included a
number of macros written in the programming lan-
guage of MatLab (Mathworks, 2006), JMP (SAS,
2007) and NetLogo (Wilensky, 2009), and are freely
available upon request. The data analysis procedure
can be summarized in the following steps:
• The digitized EEG signals produced by the classi-
cal 10 - 20 montage of the electrodes, described
in (Flink et al., 2002), were carefully cleared
from artifacts, as identified by the clinical experts.
Whenever the artifacts were only present in some
of the signals, all records from that montage were
submitted to the identical clearing procedure, in
order to preserve their phasing.
• The digitized signal (recorded at a 256 Hz) from
each electrode was ’windowed’ in stretches of
about 8 sec. For example, from a 5-minutes-
lasting record, 62 windows were obtained, which
typically reduced to about 40 after the above de-
scribed artifact clearing.
• The spectral content of the signal in each win-
dow was obtained by a macro based upon the DFT
procedure of MatLab (Mathworks, 2006), and the
power spectra of the windows derived from each
electrodic record were aligned in a matrix of typi-
cal size = 20 (windows) * 50 (frequencies in Hz).
• The above matrices (corresponding to whole elec-
trodic records) were correlated by means of the
Pearson correlation coefficient (R) :
R =
∑
n
i=1
(Y
i
−
¯
Y )(X
i
−
¯
X)
p
∑
n
i=1
(Y
i
−
¯
Y )
2
p
∑
n
i=1
(X
i
−
¯
X)
2
(1)
Positive and negative values indicate that the two
variables show the same or, respectively, an oppo-
site trend with respect to each other. Close to zero
values indicate the absence of any significant link-
age. For a complete survey of the Pearson Corre-
lation Coefficient as a powerful data analysis tool,
see (Rodgers and Nicewander, 1988).
2.3 Multi Agent System (MAS)
Multi agent systems (MAS) are useful for simulating
the highly cooperative behaviour of individuals in so-
cial groups like human communities, insect colonies
nests or multicellular organisms (Russell and Norvig,
2005). In a neuroscience context, the architecture of
the agent system is such that each agent corresponds
to a neuron or a neuron class and is able to send
signals according to its neighbours, thus influencing
their activation state. The activation time of the sin-
gle agent may also change according to afferences of
connected fibers, regulating the activation threshold
as well as the firing frequency. A MAS system should
be able to reproduce the EEG signal typical of mi-
graine or epilepsy. The more or less realistic con-
ditions under which this may be achieved, could be
taken as reinforcing/disproving the theory that the ba-
sis of both pathologies is a common synchronization
mechanism.
3 RESULTS
3.1 Correlating Signals from Homo -
and Controlateral Electrodes
An interesting trend is shown by correlating traces
from symmetric couples of electrodes in the two
BIOSIGNALS 2010 - International Conference on Bio-inspired Systems and Signal Processing
448
hemispheres within the same subject. Table I con-
tains the Pearson coefficients obtained by coupling: i)
corresponding electrodes in the two hemispheres, or-
dered in the rostro-caudal direction, from the fronto-
parietal electrodes (F
p1
,F
p2
) to the occipital (O
1
,O
2
)
lobes (columns 1,2,3), and ii) electrodes of the same
(left) hemisphere (columns 4,5).
Table 1: Time dependent Pearson correlations between left
and right emisphere in different pathologies ( S1, S2 = Mi-
graine; S3 = diffused epilepsy; S4 = focal epilepsy; S5 =
control). The correlations were calculated from the records
of the following couples of electrodes: Fp = frontal-pole; T
= temporal; O = occipital. Odd and even suffixes refer to
right and left emispheres, respectively; values higher than
0.66 are in bold.
F p
2
T
4
O
2
T
3
O
1
S1 F p
1
0.77 0.35 0.34
T
3
0.67 0.52
O
1
0.77
S2 F p
1
0.79 0.26 0.15
T
3
0.49 0.22
O
1
0.82
S3 F p
1
0.30 -0.04 0.28
T
3
0.23 0.08
O
1
0.50
S4 F p
1
0.58 0.15 0.40
T
3
0.22 0.08
O
1
0.63
S5 F p
1
0.53 0.22 0.34
T
3
0.16 0.14
O
1
0.64
In all cases, the correlations were carried out over
subsequent, non overlapping windows of 2000 points
each, from signals of about 64,000 points sampled
at 256 Hz. The aim was to check whether in the
time spanned by the signal, namely within the about
138 sec of its total duration, some significant spec-
tral change occurred. An even more ambitious goal
was to enlight a space-dependent trend linked to the
rostro–caudal direction.
Although the data in Table I did not substantiate
clearly the above expectations, it seems fair drawing,
on their basis, the following minimal conclusions: a)
all the analyzed signals show a quite synchronous be-
haviour, between the left and right emispheres, in the
fronto-parietal and occipital lobes; b) the signal as-
sociated to the migraine diagnosis shows the highest
correlation as compared to both the epileptic cases;
c) the highest synchronous activity is concentrated
in the occipital lobe under all conditions. Moreover,
the concomitant lower and higher synchronization in
the temporal/central and frontoparietal areas, respec-
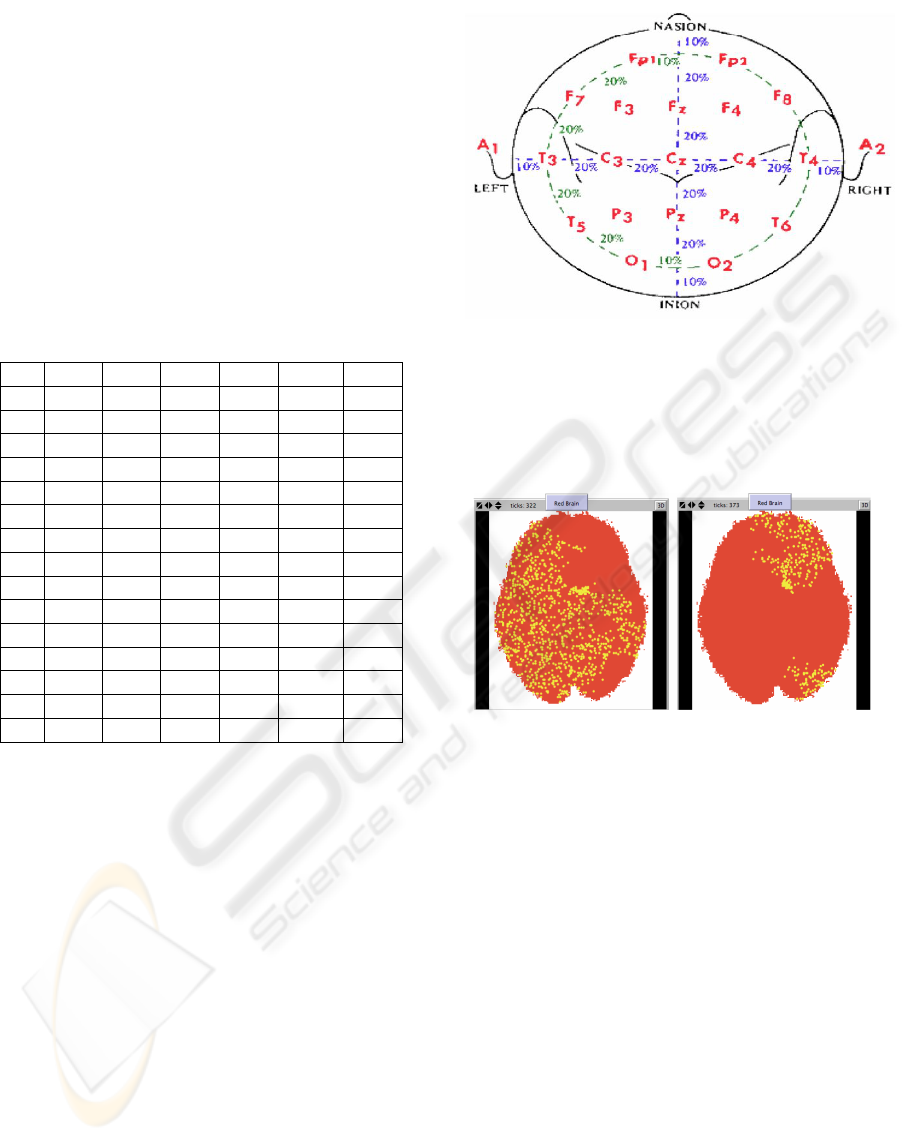
Figure 2: Electrode location on the human scalp in the ”10-
20 montage”. According to a standardized procedure 10
small electrodes (less than 1 cm diameter, wetted by a salt-
past increasing the electrical conductivity) are symmetri-
cally located on each emisphere according to the following
nomenclature: Fp = frontal-pole; T = temporal, C = central,
P = parietal, O = occipital.
Figure 3: Oscillating activity of brain neurons simulated by
a MAS (Wilensky, 2009). Left and right panels refer to
the main peaks of activity within a single oscillation cycle.
Each cycle lasted about 10 machine time units, correspond-
ing to about 1 s, and involved 1500 agents in both hemi-
spheres, whose behaviour was initially random. The oscil-
lating regime apparent in the two panels arises after about
350 machine time units. The algorithm used in the sim-
ulation has been described in detail elsewhere (Colosimo,
2008)
.
tively, are consistent with an oscillating behaviour,
namely a clustering in well defined areas of the maxi-
mal and minimal activity occurring in the considered
time span. It is worth mentioning that a similar (al-
though less clear) trend is also observed by correlat-
ing EEG records from proximal electrodes within the
same (left) hemisphere, reported in columns 4,5 of
Table I. The data concerning the other (right) hemi-
sphere are almost the same.
EEG SIGNALS IN EPILEPSY AND MIGRAINE - Analysis and Simulations by Multi-agent Systems
449
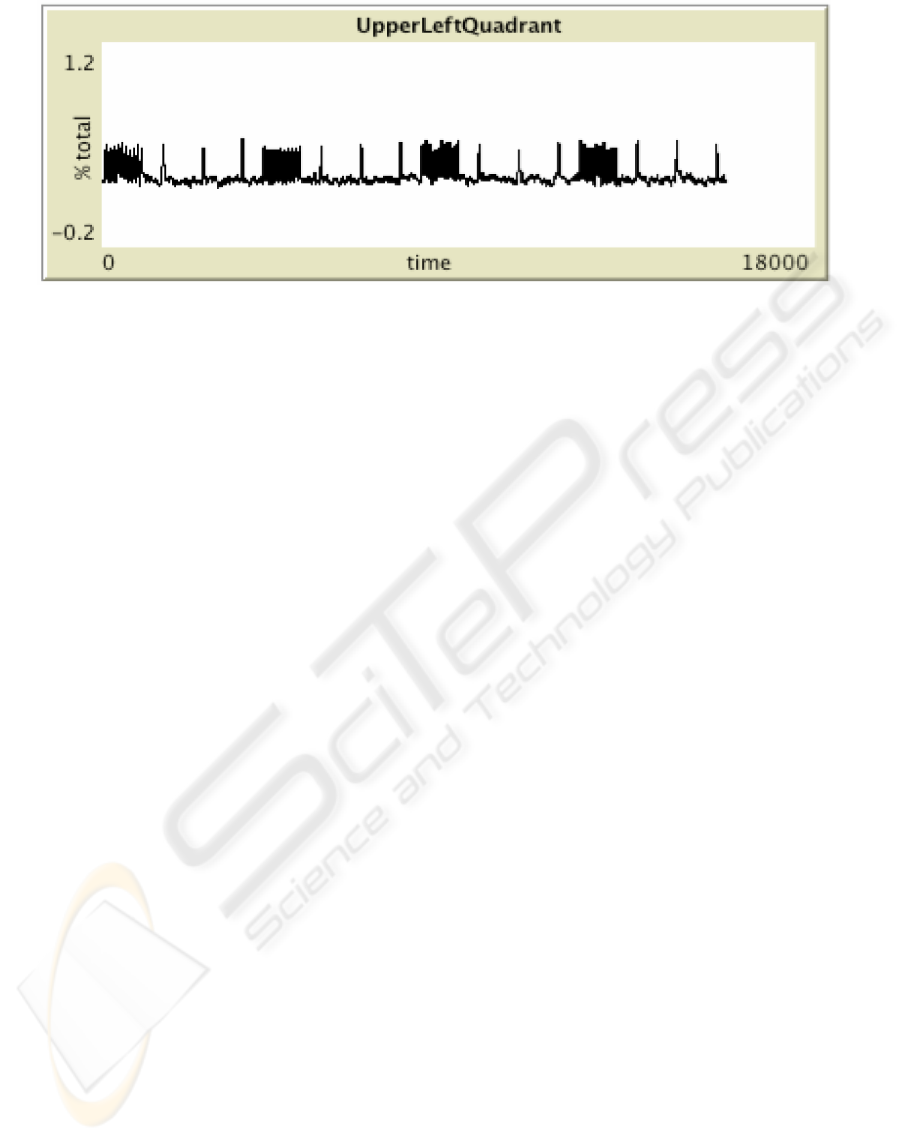
Figure 4: A MAS based oscillating field model for simulating hypersynchronized neuron waves. In this case the two brain
hemispheres have been divided into four identical quadrants and the fraction of the total (5,000) neurons active in one the
quadrants reported.
3.2 Simulating Cortical Spreading
Depression
The first conjecture about the causal relationships
linking synchronization and epilepsy dates back to
Matsumoto (1964),(Matsumoto and Ajmone-Marsan,
1964) showing that hyperactivity of a limited num-
ber of cells unable to recruit a larger network was
also unable to originate an epileptic event. The some-
how paradoxical discovery of the extensive synchro-
nization occurring in migraine is due to Leao (Leao,
1944), while studying an epileptic model in rabbits.
Leao observed a depolarizing wave moving at a 3
mm/min speed in the rabbits cortex. He named the
wave Cortical Spreading Depression (CSD), since af-
ter its passage the cortex remained inactive for some
time. Only in 1994, however, Lauritzen (Lauritzen,
1994) hypothesized that CSD could have been at
the origin of the visual aura in human migraine.
He showed that associated with the visual aura was
a high-activity wave moving in the anterior direc-
tion from the occipital region at speed from 2 to 6
mm/min. Such a wave was followed by a tempo-
rary suppression of the cortical electrical activity. The
frequent absence of the visual aura in many subjects
has been explained by assuming that CSD may also
originate in visually silent regions (Pietrobon, 2005).
CSD, in fact is not limited to the occipital area: its
starting point may be observed most frequently in the
CA1 hyppocampal area, followed by the neo-cortex,
and it remains a most interesting phenomenon of neu-
ral synchronization.
Figure 3 shows the activity patterns observed in
the area representing a coronal section of the human
brain, by means of a simulation device described else-
where (Wilensky, 2009). The 2 panels in the figure
show the clustering of active neurons in different re-
gions of the ”brain” during a repeating functional cy-
cle. The period of such cycle can be easily modulated
by a number of factors, primarily of metabolic nature.
4 CONCLUSIONS
Even if neither migraine nor epilepsy are actually
fully understood in their deep causes and detailed
mechanisms, a most probable connection between
them concerns the abilitiy of neural cells to get patho-
logically hypersynchronized under various circum-
stances. In this frame, it is maybe worth stressing
that the main goal of our research plan, is to simu-
late the cortical depression wave dynamics. Although
obviously related to the synchronized activity of neu-
ron populations, this represents a higher level of com-
plexity, since it involves both a time and space depen-
dence of the oscillatory activity whose reproduction
in silico, at our knowledge, has not been successfully
attempetd as yet.
All in all, the most interesting outcome of our
study may be summarized as follows:
- Concerning the analysis of EEG signals, a nec-
essary prerequisite to any modelistic effort, a simple
and flexible tool like the Pearson correlation coeffi-
cient showed considerable heuristic power: as a mat-
ter of fact Figures 3,4 and Table I indicate that by
just dissecting the time series into a number of subse-
quent windows in order to increase the resolution of
the method, allowed to identify the presence of time
and space ordered activity patterns of neurons from
both homo- and contralateral signals.
- Concerning the multi-agent simulation environ-
ment, NetLogo (Wilensky, 2009)appeared more flexi-
ble as compared to other programmable tools special-
ized for neuronal systems, like, for example, Gene-
BIOSIGNALS 2010 - International Conference on Bio-inspired Systems and Signal Processing
450

sis (Beeman and Bower, 2009) or Neuron (Carnevale
and Hines, 2006), although probably less powerful
in terms of manageable models sizes. (Brette et al.,
2007) As an example, by the very same tool (Netlogo)
it was relatively straightforward to work out simula-
tions as those shown in figures 3 and 4.
- Although still far from conclusive, our results
and, in particular, the similarity of the simulated sig-
nals in figure 4 with the alternating bursts of activities
and ’interictal’ phases, observed in vitro (Panuccio
et al., 2009) and in vivo (Steriade, 2006), represents
an encouraging first step towards the clarification of
neural pathologies by means of relatively simple and
flexible numerical methods.
ACKNOWLEDGEMENTS
We would like to thank all the colleagues from the
CISB InterDept. Center of Sapienza University for
suggestions, discussions and encouragement. AV is
grateful to Lorenzo Rocchi for his help on everyday
EEG practice.
REFERENCES
Beeman, D. and Bower, J. (2009). The GENESIS Simula-
tion System. Web Site. http://genesis-sim.org.
Brette, R., Rudolph, M., Carnevale, T., Hines, M., Beeman,
D., Bower, J., et al. (2007). Simulation of networks
of spiking neurons: a review of tools and strategies. J
Comput Neurosci, 3(23):349–98.
Carnevale, N. and Hines, M. (2006). The NEURON Book.
Cambridge UK: Cambridge University Press.
Colosimo, A. (2008). Biological simulations by au-
tonomous agents: two examples using the NetLogo
environment. Biophysics and Bioengineering Letters,
1(3):40–50.
Flink, R., Pedersen, B., Guekht, A., Malgren, K.,
Michelucci, R., Neville, B., and et al (2002). Guide-
lines for the use of EEG methodology in the diagno-
sis of epilepsy. International League Against Epilepsy:
commission report. Commission on European Affairs:
Subcommission on European Guidelines. Acta Neurol
Scand, (106):1–7.
Hunter, M., Smith, R., Hyslop, W., Rosso, A., Gerlach, R.,
Rostas, J., Williams, D., and Henskens, F. (2005). The
Australian EEG Database. Clinical EEG and neuro-
science, 36(2).
Lauritzen, M. (1994). Pathophysiology of the migraine
aura. The spreading depression theory. Brain,
1(117):199–210.
Leao, A. (1944.). Spreading depression of activity in the
cerebral cortex. J. Neurophysiol, 1(7):359–90.
Lipton, R. and Bigal, M. (2005). The epidemiolgy of mi-
graine. The American Journal of Medicine, 118(Supp
1):3s–10s.
Mathworks (2006). MatLab – The language of technical
computing. Web Site. http://www.mathworks.it/.
Matsumoto, R. and Ajmone-Marsan, C. (1964). Cortical
cellular phenomena in experimental epilepsy: ictal
manifestations. Exp Neurol 1964, (80):305326.
Ottman, R. and Lipton, R. (1996). Is the comorbidity of
epilepsy and migraine due to a shared genetic suscep-
tibility? Neurology, 4(47):918–24.
Panuccio, G., Curia, G., Colosimo, A., Cruccu, G., and
Avoli, M. (2009). Epileptiform synchronization in the
cingulate cortex. Epilepsia, 3(50):521–36.
Pietrobon, D. (2005). Migraine: new molecular mecha-
nisms. Neuroscientist, 4(11):373–86.
Rodgers, J. and Nicewander, W. (1988). Thirteen ways
to look at the correlation coefficient. The American
Statistician, 42(1):59–66.
Rogawski, M. (2008). Common pathophysiologic mech-
anisms in migraine and epilepsy. Arch Neuro,
6(65):709–14.
Russell, S. and Norvig, P. (2005). Artificial Intelligence: a
modern Approach. Prentice Hall International.
Sack, O. (1992). Migraine. Random House Inc.
SAS (2007). SAS - Home page. Web Site.
http://www.jmp.com.
Steriade, M. (2006). Grouping of brain rhythms in corti-
cothalamic systems. Neuroscience, (137):1087–1106.
Syvertsen, M., Helde, G., Stovner, L., and Brodtkorb, E.
(2007). Headaches add to the burden of epilepsy. J
Headache Pain, (8):224–230.
Wilensky, U. (2009). NetLogo - Home page. Web Site.
http://ccl.northwestern.edu/netlogo/.
EEG SIGNALS IN EPILEPSY AND MIGRAINE - Analysis and Simulations by Multi-agent Systems
451
