
VALIDATION OF AN AUTOMATED SEIZURE DETECTION
SYSTEM ON HEALTHY BABIES
Histogram-based Energy Normalization for Montage Mismatch Compensation
A. Temko
1
, I. Korotchikova
2
, W. Marnane
1
, G. Lightbody
1
and G. Boylan
2
1
Neonatal Brain Research Group, Department of Electrical and Electronic Engineering, University College Cork, Ireland
2
Neonatal Brain Research Group, Department of Peadiatrics and Child Health, University College Cork, Ireland
Keywords: Neonatal, Seizure, Detection, Automated, Energy, Normalization, Support vector machines, Healthy
patients, False detections per hour.
Abstract: Seizures in newborn babies are commonly caused by problems such as lack of oxygen, haemorrhage,
meningitis, infection and strokes. The aim of an automated neonatal seizure detection system is to assist
clinical staff in a neonatal intensive care unit to interpret the EEG. In this work, the automated neonatal
seizure detection system is validated on a set of healthy patients and its performance is compared to the
performance obtained on sick patients reported previously. The histogram-based energy normalization
technique is designed and applied to EEG signals from healthy patients to cope with montage mismatch.
The results on healthy babies compares favourably to those obtained on sick babies. Several useful
observations are made which were not possible to obtain by testing on sick babies only such as a practically
useful range of probabilistic thresholds, minimum detection duration restriction, and an influence of the
database statistics on the system performance.
1 INTRODUCTION
The brain is the most complex organ of the human
body and further understanding of its function
represents a huge future challenge for medicine,
biomedical engineering and informatics. Brainwaves
are generated by neural sources within the brain,
which propagate a measurable electromagnetic field
onto the scalp. The resulting electroencephalogram
(EEG) provides a non-invasive measurement of
brain electrical activity, which can be recorded using
surface electrodes and a recorder. The EEG shows
apparently ‘random’ activity in the µ-volt range.
Seizures or ‘fits’ in newborn babies are
commonly caused by problems such as lack of
oxygen, haemorrhage, meningitis, infection and
strokes. The incidents of clinically apparent neonatal
seizures is generally reported as around 3 per 1000
and under certain circumstances, such as very
preterm babies, 50 per 1000 (Rennie and Boylan,
2007). In reality, these values are highly
underestimated because only around 1/3 of all
seizures are clinically visible and only around 1/10
are actually documented (Murray et al., 2008).
Failure to detect seizures and the resulting lack of
treatment can result in brain damage and in severe
cases, death.
Seizures are missed because they are very
difficult to detect which is mainly attributable to
large intra- and inter-patient variability of the EEG.
Unlike older children and adults, babies do not
exhibit obvious clinical changes during seizures. The
only available method to detect all seizures in babies
is to use a dedicated monitor which records the
electrical activity of the brain. These monitors are
expensive and require special expertise to interpret
the results. Most hospitals lack this expertise and
seizures go undiagnosed. The hospitals which do
have special expertise cannot provide monitoring on
24/7 basis. Therefore the aim of an automated
neonatal seizure detection system is to assist clinical
staff in a neonatal intensive care unit to interpret the
EEG. Although a number of methods and algorithms
have been proposed that attempt to automatically
detect neonatal seizures, to date their transition to
clinical use has been limited due to unsatisfactory
performance.
312
Temko A., Korotchikova I., Marnane W., Lightbody G. and Boylan G. (2010).
VALIDATION OF AN AUTOMATED SEIZURE DETECTION SYSTEM ON HEALTHY BABIES - Histogram-based Energy Normalization for Montage
Mismatch Compensation.
In Proceedings of the Third International Conference on Bio-inspired Systems and Signal Processing, pages 312-317
DOI: 10.5220/0002750303120317
Copyright
c
SciTePress

Moving average
Moving average
Moving average
OR Collar outp
ut
R
aw EEG
Preprocessing &
Feature Extraction
Threshold
Threshold
Threshold
SVM
SVM
SVM
vectors
Binary decisionSingle channel
feature vectors
Probability
of seizure
Figure 1: Architecture of the SVM-based seizure detection system.
Recently, a neonatal seizure detection system has
been reported whose performance (seizure detection
rate of ~82% with 0.5 false detections per hour) was
good enough to meet the initial clinical requirements
(Temko et al., 2009). Unlike existing systems, which
are based on a set of heuristic rules and thresholds
(Navakatikyan et al., 2006; Deburchgraeve et al.,
2008; Mitra et al., 2009), the developed system is
based on rules, which are automatically derived
using machine learning and pattern recognition
techniques. A multi-channel patient-independent
neonatal seizure detection system was designed
based on a Support Vector Machine (SVM)
classifier and a set of features extracted from time,
frequency and information theory domains. The
system was evaluated using several epoch-based and
event-based metrics on a large clinical dataset of 267
hours total duration comprising 17 seizure babies.
By varying the level of confidence of the system
decisions, the curves of performance were reported
which allowed comparison of the system with
existing alternatives. Additionally, as the probability
of seizure was the output of the system, the designed
SVM-based neonatal seizure detector allowed
control of the final decision by choosing different
confidence levels which made the proposed system
flexible for clinical needs.
In this work, this automated neonatal seizure
detection system is validated on a clinical set of 47
healthy babies and its performance is compared to
the performance obtained on the database of seizure
patients reported previously (Temko et al., 2009).
The histogram-based energy normalization
technique is applied to EEG signals from healthy
patients to cope with the montage mismatch between
the sick and healthy patients. In fact, many features
used in the detector (such as sub-band energies,
curve length, etc) incorporate information based on
the absolute energy of the EEG signals used in
training, thus making the system sensitive to the
changes in incoming signal energy levels. The
proposed energy normalization technique overcomes
this restriction and potentially enables the user to
apply the seizure detector to signals derived by an
arbitrary montage, acquired by different recording
equipment, or to compensate any other possible
energy-related adverse effects.
This work is organized as follows: Section 2
provides the brief overview of the SVM-based
neonatal seizure detector. Section 3 reviews the
datasets of sick and healthy babies used in the study.
The description of the energy normalization
technique is proposed in Section 4. Section 5
provides experimental results and discussion.
Section 6 concludes the study.
2 NEONATAL SEIZURE
DETECTOR OVERVIEW
The outline of the system is shown in Figure 1. The
signal from each EEG channel is down-sampled
from 256Hz to 32Hz with an anti-aliasing filter set at
16Hz. Then the EEG signal is segmented into 8s
epochs with 50% overlap between epochs. A set of
time-domain, frequency-domain, and information
theory based features is extracted from each EEG
epoch. The feature vectors are then fed to the SVM
classifier where a probability of a seizure is obtained
for each EEG epoch. These probabilities are
smoothed with central moving average filter and
transformed into binary {0, 1} decisions. The single
channel binary decisions are then combined into a
multi-channel binary decision. A final post-
processing step is the collar operation, which
consists in expanding all seizure (positive decision
in our case) events forward and backward in time.
3 DATASETS
The dataset of sick babies used in (Temko et al.,
2009) was composed of recordings from 17
newborns obtained in the Neonatal Intensive Care
Unit (NICU) of Cork University Maternity Hospital,
Cork, Ireland. The dataset contains multi-channel
continuous EEG recordings with a mean duration of
15.76 hours, not edited to remove the large variety
of artifacts and poorly conditioned signals
commonly encountered in the real-world NICU
VALIDATION OF AN AUTOMATED SEIZURE DETECTION SYSTEM ON HEALTHY BABIES - Histogram-based
Energy Normalization for Montage Mismatch Compensation
313
environment. Thus the dataset allowed the most
robust estimate of the algorithm’s performance.
The patients were full term babies ranging in
gestational age from 39 to 42 weeks. A Viasys
Healthcare NicoletOne video EEG machine was
used to record multi-channel EEG at 256Hz using
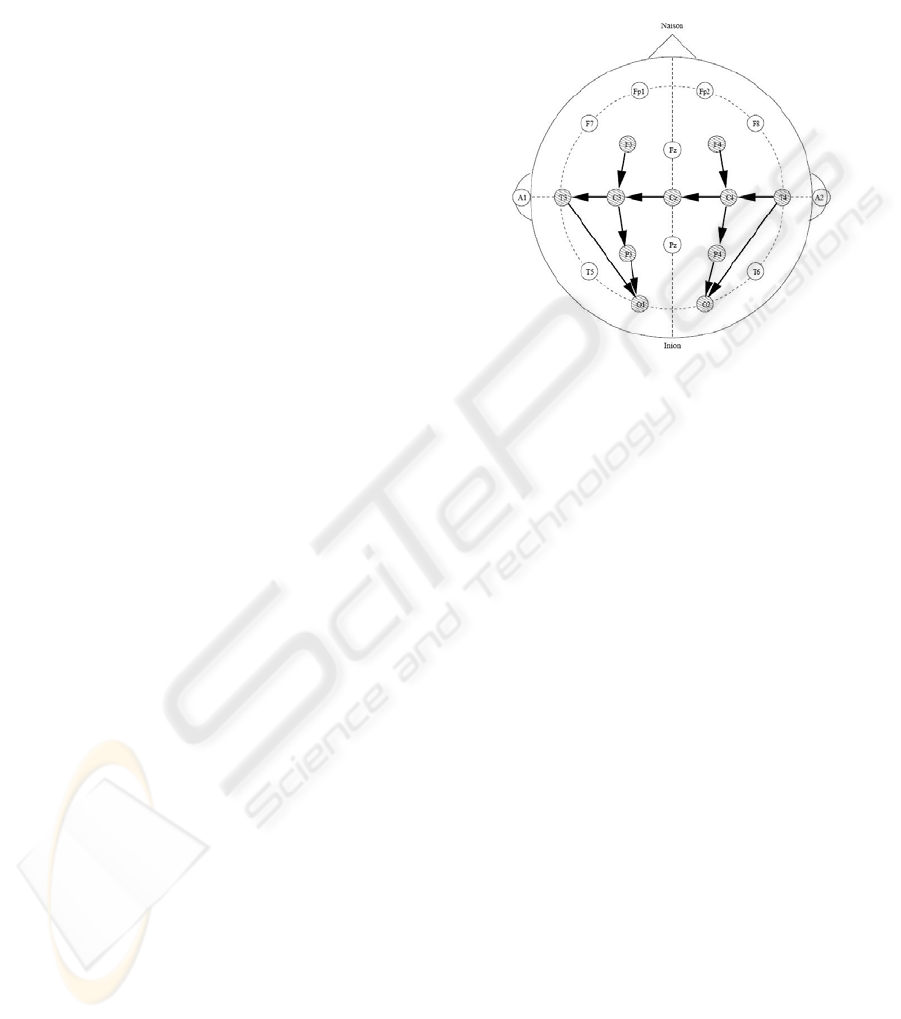
the 10-20 system of electrode placement (Figure 2)
modified for neonates. The following 8 bipolar EEG
channels were used in that study: F4-C4, C4-O2,
F3-C3, C3-O1, T4-C4, C4-Cz, Cz-C3 and C3-T3.
The combined length of the recordings totals 267.9h
and contains 691 seizures which range from less
than 1m to 10m in duration. All seizures were
annotated independently by 2 neonatal
electroencephalo-graphers. Further details regarding
the dataset can be found in (Temko et al., 2009).
The N-fold cross-validation was used to evaluate
the system in a patient-independent way. Here N
was the number of patients. In this way N-1 patients’
data is used for training and the data of the
remaining patient is used for testing. This scheme is
repeated N times and the results are averaged.
The dataset of healthy babies used in this study
to validate the seizure detection algorithm consists
of 47 full-term newborn babies recruited from the
postnatal wards in Cork University Maternity
Hospital with around 1 hour per baby.
Babies were enrolled as healthy babies if they
met the following criteria:
• Gestation > 37 weeks
• No requirement for resuscitation following
delivery
• Apgar scores of > 8 at 5 mins
• Normal cord pH (>7.1)
Exclusion criteria were:
• Maternal epilepsy or diabetes
• Birth weight < 2.5kg
• Congenital anomalies
• Admission to the neonatal unit for special
or intensive care.
Following parental consent, babies were
examined using the Amiel-Tison assessment, a
standardised neurological examination (Amiel-
Tison, 2002). Only babies with a normal
neurological examination were then recruited for the
study. The study had full approval from the Clinical
Ethics Committee of the Cork Teaching Hospitals
and written informed parental consent was obtained
for all infants studied.
Continuous video-EEG data was recorded using
the same NicoletOne EEG system. All the infants
were in the supine position in their cots at the
mother’s bedside during each recording. All
recordings commenced as soon as possible after
birth. EEG was recorded from 7 scalp electrodes
positioned using the 10-20 system of electrode
placement, modified for neonates (F4, F3, Cz, T4,
T3, P4, P3) and the following 4 bipolar EEG
channels are used: F3-P3, F4-P4, T4-Cz, and Cz-T3.
The data was sampled at 256 Hz.
Figure 2: The 10-20 electrode placement with sick baby
montage shown.
As can be seen from the description of the
datasets, there is a difference between electrodes
used to capture signals for sick and healthy babies
which results in the montage mismatch. The
montage mismatch results in different levels of
energy of incoming signals which are mainly
attributable to the distance between channels used in
the montage (Quigg and Leiner, 2009). In our case,
the montage difference arises from the fact that for
healthy babies a simpler montage was used in order
to minimize the time of interference. However, there
can be other reasons that a limited number of
channels can be captured such as the size of the
baby’s head. To cope with such situations a
histogram-based energy normalization technique is
developed.
4 HISTOGRAM-BASED ENERGY
NORMALIZATION
On the transition of the developed seizure detection
algorithm to day-by-day clinical usage it has been
identified that the system is sensitive to the
mismatch in energy levels of EEG signals used in
training and testing. This sensitivity comes from the
fact that many features used are based on the
absolute energy of the signal which is discriminative
by itself but also carries the information of the
recording environment. In turn, the mismatch may
BIOSIGNALS 2010 - International Conference on Bio-inspired Systems and Signal Processing
314
arise from a difference in montages, acquisition
hardware, etc. In practice, however, the desired EEG
montage cannot be always granted. Likewise the
seizure detector should not be linked to the specific
hardware equipment. Thus, in an ideal situation, it
should be possible to apply the detector to the EEG
signal acquired by any device for arbitrarily chosen
channels. It is worth noting that the mentioned
mismatch can only be seen when tested on a
database for which recording conditions differ from
those used in training, i.e. facing a real-world
clinical application. Thus, to the best of our
knowledge, there are no papers that discuss the need
for a normalization of the EEG signal, or the effect
of such normalization.
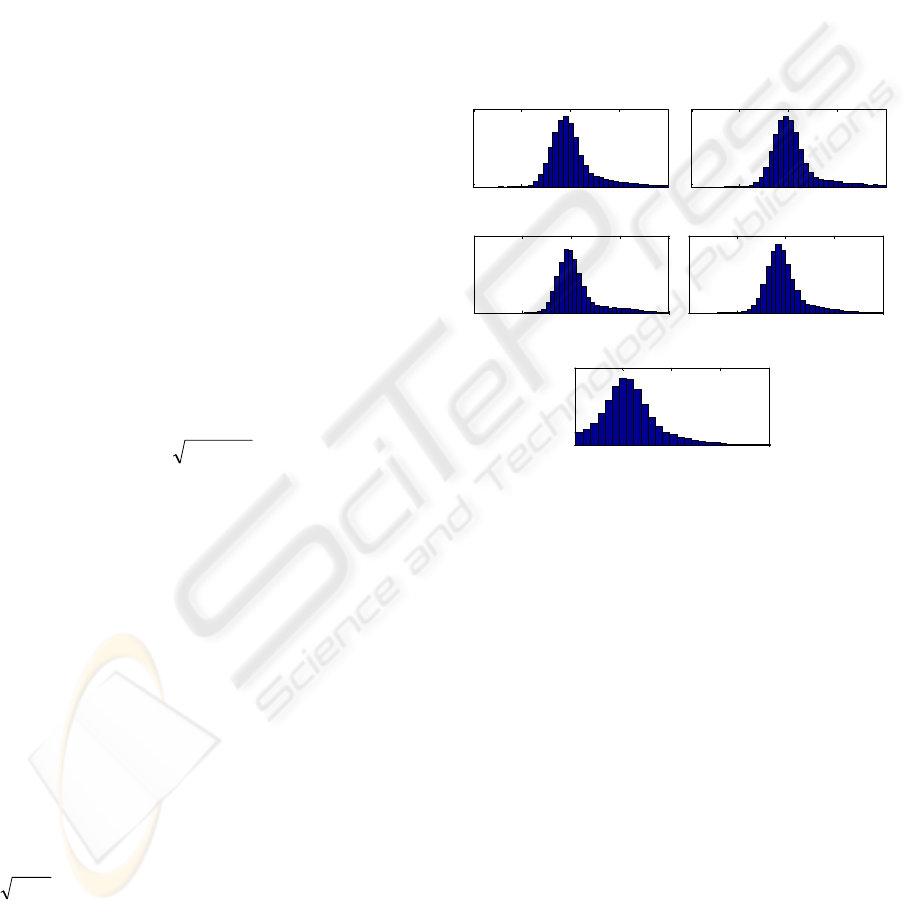
The normalization algorithm works as follows.
Firstly, the histogram of the logarithm of energy of
EEG signals from training database is computed,
where the energy is calculated for each epoch. The
peak of the distribution indicates the energy of the
background EEG as it is the most frequent event in
any recording if the recording is long enough. The
idea is to normalize the energy of the background
EEG of any incoming (testing) signals to match the
energy of the background EEG used in training. For
this, the histogram of energy of all available signals
is computed for a particular channel in a chosen
montage and a normalization coefficient is given
using the formula:
testtr
EE
coef
−
= 10
(1)
where E
tr
, E
test
are the coordinates of the peaks of
the distributions of log-energy of EEG signals used
in training and testing, respectively. 10 is the chosen
logarithm base. The power of 10 and a square root
are used to return from the log scale back to the
initial signal amplitude scale. The incoming test
signal is multiplied by the coefficient computed in
Eq. 1.
An example of energy normalization is shown in
Figure 3, where histograms of the log-energy are
calculated for each channel of the healthy patients
and for all channels in the sick patients. As can be
seen, the most frequent level of energy of the
channels used in testing is around 3 in log scale,
while the energy of signals in channels used in
training is around 2 in log scale. Thus the
normalization coefficient will be around
3.010
32
≈
−
, i.e. the test input signal has to be
divided roughly by 3.
It was observed that the energy normalization
used in this work is patient-independent as the
difference among coefficients calculated for each
patient is by orders smaller than the difference
among coefficients calculated for each channel.
Additionally, the whole process of normalization is
based on a mild assumption that there are EEG
signals available for a chosen montage for the used
acquisition hardware. These signals can be used to
calculate the normalization coefficients in advance.
In real-world applications, the hard-coded
coefficients calculated for all possible montages and
all possible recording devices could be retrieved
using a simple lookup table. On the other hand, the
algorithm can be easily modified to estimate
histograms adaptively online if the system is to be
applied to EEG signals from unknown recording
hardware.
1 2 3 4 5
Channel F4-P4
1 2 3 4 5
Channel F3-P3
1 2 3 4 5
Channel T4-Cz
1 2 3 4 5
Channel Cz-T3
1 2 3 4 5
All channels from the training DB
Figure 3: Histograms of the log-energy calculated over the
testing database (except for a testing patient) for a
particular channel. The bottom plot shows the log-energy
of all the channels in the training database.
A version of the above-described normalization
has been previously applied in (Temko et al, 2008)
for detection of acoustic events in meeting room
environments to compensate for the effects of
various recording environments and equipments to
audio and speech signal energy.
5 EXPERIMENTAL RESULTS
One measure of performance used in our work is the
number of false positive detections per hour (FD/h).
This measure represents an important indicator of
the practical usability of the algorithm, because each
FD implies that somebody in the NICU will have to
check the patient and the raw EEG recording
unnecessarily. Additionally, we report the mean
false detection duration introduced in (Temko et al.,
VALIDATION OF AN AUTOMATED SEIZURE DETECTION SYSTEM ON HEALTHY BABIES - Histogram-based
Energy Normalization for Montage Mismatch Compensation
315
2009). It is assessed by averaging the durations of all
false detections produced by the system at a single
operating point (with a chosen threshold). In a real
application, FD/h indicates the number of times a
clinician has to check the results of an automatic
detector in vain; however, not only the number of
times but also the total amount of time should be
reported. For instance, if both systems can give 90%
of good seizure detection rate, the first one with a
cost of 1 FD/h of 20m duration and the other with a
cost of 2 FD/h each of 1m duration, the second
system may be preferred as the results of the first
system imply that ~33% of time a clinician has to
check the EEG recording in vain, with only ~ 3% of
time in the second case.
The curve of performance is obtained for healthy
babies and is compared to the one obtained on sick
babies reported in (Temko et al., 2009) for FD/h
metric varying the threshold on a probability of a
seizure. The results are reported in Figure 4. To be
able to compare the results on sick and on healthy
babies the same N-fold cross validation is used here
(N=17). That is, each of 47 healthy babies is tested
N times using N models trained on N-1 sick patients
with a normalization coefficient for each channel in
the montage calculated on the remaining 46 healthy
patients. This way, the performances on healthy and
sick babies are completely comparable as the same
model is used to test the remaining sick baby and all
healthy babies (which are not used in training at all).
As can be seen from Figure 4, the performance
of the seizure detection system before normalization
is much worse than the performance of the system
on sick babies. However, after normalization, the
curve of the FD/h for healthy babies is consistently
better than that for sick babies. Additionally, the
duration of false detection on healthy babies is
significantly lower than that for sick babies. It is
worth noting that as the normalization coefficients
are calculated to normalize to the background energy
in the training database, the actual performance in
term of good seizure detection rate on sick babies is
not changed because the resulting coefficient is
equal to one (i.e. no change is applied to the sick
baby signals).
It is interesting that after a certain point (~0.65 in
our case), the FD/h for healthy babies becomes
larger than that for sick babies. It actually shows that
the performance on sick and healthy babies cannot
be compared on the full scale of FD/h. For instance,
statistics of the database of sick babies say that there
are in average ~2.6 seizures every hour. It naturally
restricts the maximum number of false detections
obtainable for this dataset by a given algorithm. On
the healthy babies however, there are no upper limit
0 0.1 0.2 0.3 0.4 0.5 0.6 0.7
0
0.2
0.4
0.6
0.8
1
Threshold on Probability of Non-Seizure (1 - Probability of Seizure)
False Detections per Hour
2.1m
2.1m
1.5m
2.2m
1.6m
2.3m
1.8m
2.4m
2.1m
Sick patients
Healthy patients before normalization
Healthy patients after normalization
Figure 4: The curves of performance for sick and healthy
babies for FD/h metric.
on false detections, so after a certain threshold the
algorithm will stop producing the false detections on
sick patients due the presence of actual seizures
while still producing false detections on healthy
babies.
This interesting phenomenon firstly reveals the
range of thresholds which are practically useful for
the designed algorithm which could not have been
seen while testing on sick babies only. In our case,
the threshold on the probability of the seizure should
be set higher than 0.35 to guarantee the reported
performance for all possible testing patients.
Apart from the practically useful range of
thresholds, testing on healthy patients shows how
the statistics of the dataset can affect the metrics
which measure the performance of the system. In
other words, the same algorithm tested on different
datasets can obtain different metric values
depending on the density of seizures in the datasets.
For instance, in (Mitra et al., 2009), the average
number of seizures per hour was ~4.9, in
(Navakatikyan et al., 2006) there were ~4 seizures
per hour, and in (Deburchgraeve et al., 2008) ~3.3
seizures per hour. Comparing the statistics of the
datasets in the mentioned studies, the results
obtained on our dataset with ~2.6 seizures per hour
can be seen as an over-pessimistic performance
assessment.
In fact, the large difference between the FD/h
obtained on healthy babies and on sick babies
suggests that the results on sick and on healthy
babies should be reported separately as it has been
done in (Mitra et al., 2009). In a certain sense, these
values indicate the average upper and lower bounds
on FD/h achievable in practice. If reported together
the final FD/h score will be skewed by the amount
of healthy baby data which can differ from study to
study (Navakatikyan et al., 2006; Deburchgraeve et
al., 2008). For example, in our study, the developed
BIOSIGNALS 2010 - International Conference on Bio-inspired Systems and Signal Processing
316
seizure detection system can detect ~82% of seizures
with ~0.5 FD/h on sick babies and ~0.12 FD/h on
healthy babies. Combining both values will result in
an over-optimistic assessment and will neither show
the actual system performance nor indicate its
lower/upper bounds.
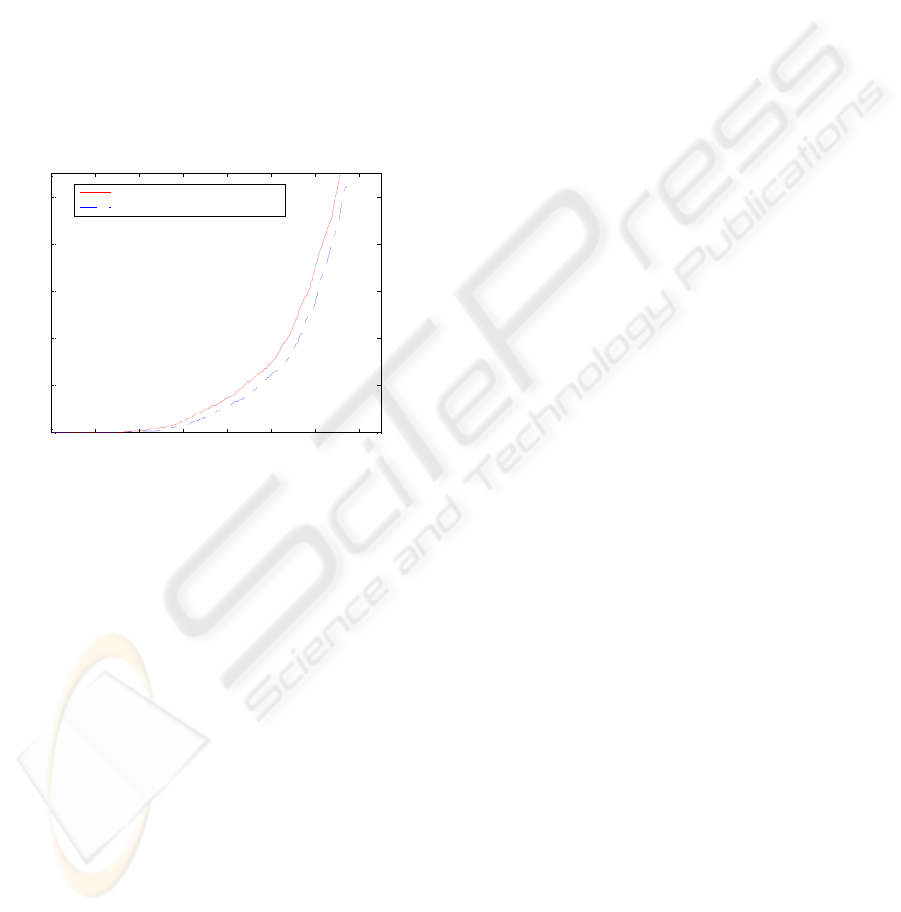
Another outcome of the testing on healthy babies
is the influence of the restriction on minimum
seizure duration on the FD/h metric. The effect can
be seen on Figure 5. The restriction eliminates all
produced seizures which are shorter than 3 epochs
(~12 seconds). Actually, this new rule was tested on
sick babies before but no significant difference was
obtained. While testing on healthy babies, the
sensitivity of the algorithm is higher which allows
observing the effect of the introduced system
modification.
0 0.1 0.2 0.3 0.4 0.5 0.6 0.7
0
0.2
0.4
0.6
0.8
1
Threshold on Probability of Non-Seizure (1 - Probability of Seizure)
False Detections per Hour
Without Minimum Duration Restriction
With Minimum Duration Restriction
Figure 5: The curves of performance for healthy babies for
FD/h metric with and without Minimum Duration
Restriction.
6 CONCLUSIONS
The seizure detection algorithm is validated on a
clinical set of 47 healthy babies. The curves of
performance are obtained for sick and healthy babies
for false detections per hour metric varying the
threshold on probability of seizure. The results on
healthy babies compares favourably to those
obtained on sick babies. The energy normalization
technique contributes to channel and montage
independence. Several useful observations are made
which were not possible to do by testing on sick
babies only, such as a practically useful range of
probabilistic thresholds, minimum duration
restriction, and an influence of the database statistics
on the system performance.
ACKNOWLEDGEMENTS
This work is supported in part by Science
Foundation Ireland (SFI/05/PICA/1836) and the
Wellcome Trust (085249/Z/08/Z). The first author
would like to thank Rob McEvoy for fruitful
discussion.
REFERENCES
Amiel-Tison C., 2002 Update of the Amiel-Tison
neurologic assessment for the term neonate or at 40
weeks corrected age. Pediatric Neurology, v. 27,
pp. 196–212.
Deburchgraeve W., Cherian P., Vos M., Swarte R., Blok
J., Visser G., Govaert P., Huffel S., 2008. Automated
neonatal seizure detection mimicking a human
observer reading EEG. Clinical Neurophysiology,
v.119, pp. 2447-54.
Korotchikova I., Ryan C., Murray D., Connolly S., Temko
A., Greene B., Boylan G., 2009. EEG in the Healthy
Term Newborn within 12 hours of Birth. Clinical
Neurophysiology, v. 120, pp.1046-53.
Mitra J., Glover J., Ktonas P., Kumar A., Mukherjee A.,
Karayiannis N., Frost J., Hrachovy R., Mizrahi E.,
2009. A Multistage System for the Automated
Detection of Epileptic Seizures in Neonatal
Electroencephalography. Journal of Clinical
Neurophysiology, v.26, pp. 1-9.
Murray D., Boylan G., Ali I., Ryan C., Murphy B.,
Connolly S. Defining the gap between electrographic
seizure burden, clinical expression and staff
recognition of neonatal seizures. Archives of Disease
of Childhood, v.93, pp. 187-91.
Navakatikyan M., Colditz P., Burke C., Inderd T.,
Richmond J., Williams C., 2006. Seizure detection
algorithm for neonates based on wave-sequence
analysis. Clinical Neurophysiology, v.117, pp. 1190-
203.
Quigg M., Leiner D., 2009. Engineering Aspects of the
Quantified Amplitude-Integrated Electroencephalo-
gram in Neonatal Cerebral Monitoring. Journal of
Clinical Neurophysiology, v.26, pp 145-9.
Rennie J., Boylan G., 2007. Treatment of neonatal
seizures. Archives of Disease in Childhood - Fetal and
Neonatal Edition, v. 92, pp. 148-50.
Temko A., Nadeu C., Biel J-I., 2008. Acoustic Event
Detection: SVM-based System and Evaluation Setup
in CLEAR'07. In CLEAR'07 Evaluation Campaign
and Workshop. LNCS, v.4625, pp.354-63, Springer.
Temko A., Thomas E., Boylan G., Marnane L., Lightbody
G., 2009. An SVM-Based System and Its Performance
for Detection of Seizures in Neonates. In IEEE
International Conference on Engineering in Medicine
and Biology, pp.2643-6.
VALIDATION OF AN AUTOMATED SEIZURE DETECTION SYSTEM ON HEALTHY BABIES - Histogram-based
Energy Normalization for Montage Mismatch Compensation
317
