
MODELLING GLYCAEMIA IN ICU PATIENTS
A Dynamic Bayesian Network Approach
Catherine G. Enright
1
, Michael G. Madden
1
, Stuart Russell
2
, Norm Aleks
2
, Geoffrey Manley
3
John Laffey
1
, Brian Harte
4
, Anne Mulvey
4
and Niall Madden
1
1
National University of Ireland, Galway, Ireland
2
University of California, Berkeley, U.S.A.
3
University of California, San Francisco, U.S.A.
4
University Hospital Galway, Ireland
Keywords: Dynamic Bayesian Network, Glycaemia.
Abstract: Presented in this paper is a Dynamic Bayesian Network (DBN) approach to predict glycaemia levels in
intensive care patients. The occurrence of hyperglycaemia is associated with increased
morbidity and
mortality in critically ill patients. Due to the large inter-patient and intra-patient variability, the sparse nature
of observations, inaccuracies in the data and the large number of factors that influence glycaemia, the
system being modelled contains several sources of uncertainty. In the context of this uncertainty, the DBN-
based system presented here performs extremely well. By using a DBN we integrate multiple strands of
temporal evidence, arriving at varying time intervals, to determine the most probable underlying
explanations. A key contribution of this work is that it presents a principled technique for recalibration of
model parameters from general population-level values to patient-specific values, based entirely on standard
real-time measurements from the patient. While in this paper we apply our approach to the glycaemia
problem, this approach is equally applicable to other applications where unseen variables must be assessed
and individualized in real time.
1 INTRODUCTION
Proper control of glycaemia (i.e., serum glucose
levels) in critically ill patients in the intensive care
unit (ICU) is a subject that is of great importance to
physicians. Tight control of serum glucose levels has
previously been demonstrated to improve outcome
in a predominantly surgical population of critically
ill patients (Van den Berghe et al. 2001). In contrast,
the recent NICE-SUGAR study found that
attempting to keep serum glucose levels within a
tight range actually increases mortality rates (The
NICE-SUGAR Study Investigators 2009).
Therefore, the optimal target range for blood glucose
and the optimal approach to controlling blood
glucose levels in critically ill patients is still unclear.
The goal of this work is to develop a system that
accurately predicts the glycaemia levels of a patient
receiving insulin and glucose infusions. This would
provide physicians with more accurate real-time
estimates of glycaemia levels, which in turn would
be useful in determining the optimal dosage for a
given patient, through modelling the most likely
effects of planned dosages.
To achieve this goal, we develop a Dynamic
Bayesian Network (DBN) model that is derived
from an existing differential equation model of
glycaemia in ICU patients (see Section 2.1). By
recasting it as a DBN, we provide a framework for
computing solutions with continuous re-estimation
of parameters, taking account of dependencies
between variables and conditional distributions on
them. In this way, it interprets the system as being a
set of stochastic differential equations (SDEs).
Unlike the original system of differential equations,
in the DBN model all of the model terms are
allowed to vary, and accordingly are automatically
recalibrated to patient-specific values over time.
At a more general level, this paper introduces a
method for mapping a system of differential
452
G. Enright C., G. Madden M., Russell S., Aleks N., Manley G., Laffey J., Harte B., Mulvey A. and Madden N. (2010).
MODELLING GLYCAEMIA IN ICU PATIENTS - A Dynamic Bayesian Network Approach.
In Proceedings of the Third International Conference on Bio-inspired Systems and Signal Processing, pages 452-459
DOI: 10.5220/0002750804520459
Copyright
c
SciTePress

equations directly to a DBN, so that they can be
solved in a way that allows all model terms to vary,
while directly incorporating both continuous and
sporadic temporal evidence in the solutions.
1.1 Hyperglycaemia in an ICU Patient
Hyperglycaemia in non-diabetic patients is a
common phenomenon in an ICU setting (Van den
Berghe et al. 2001). The standard practice is to
control a patient’s glucose levels using glucose and
insulin infusions. Each patient reacts differently to
these insulin infusions depending on the nature of
their illness, their insulin sensitivity and other
medication they may be receiving. As well as inter-
patient variability, there is intra-patient variability. A
patient’s condition and medication intake vary
considerably while in the ICU, and hence so does
the response to insulin.
To assess a patient’s response to insulin, glucose
levels are typically measured at intervals of between
one and four hours in an ICU ward. When one
considers that the half-life of insulin is only a few
minutes, a lot can happen in a four hour interval.
However, this is the only quantitative evidence
available to physicians. From this sparse data, a
physician must prescribe an appropriate dosage
regime.
Another consideration is the quality of the data.
There may be inaccuracies in the recorded dosage
quantities and the time stamps on these records.
Plasma glucose measurements are not always
precise: depending on the method used error levels
vary from 3% -12% (Chase et al. 2006).
1.2 Why use a DBN?
The challenge when building a model to predict an
ICU patient’s insulin/glucose dynamics reflects the
challenge facing a physician trying to keep a
patient’s glucose levels within safe limits. Given the
large inter-patient and intra-patient variability, the
large number of factors that influence glucose levels
and very sparse evidence, creating an accurate
model is difficult.
Our objective in this work is to build a model
capable of reasoning in the context of this
uncertainty. However, as well as dealing with
uncertainty, the temporal nature of the problem must
also be addressed. A patient’s glucose level depends
not only on the current I.V. (intravenous) infusion
rates but also past infusion rates and past glucose
levels. Dynamic Bayesian Networks are an effective
tool for modelling uncertainty in real time in a time-
varying environment as was shown by Aleks et al.
(2008). That paper describes an early application of
full DBNs to analysing ICU data, and demonstrated
very accurate detection and removal of artefacts in
the arterial-line blood pressure sensor data.
Other DBN applications in the medical setting
have used only discrete variables. The applications
include a network to diagnose ventilator-associated
pneumonia in ICU Patients (Charitos et al. 2009)
and a prognostic model for carcinoid patients (van
Gerven et al. 2008). In the separate, but related
topic, of simulating human physiology, Abkai &
Hesser (2009) recognised the need to use
deterministic and probabilistic models. However
unlike our approach, they separate ordinary
differential equation solvers and DBN models.
It is assumed that readers are already familiar
with Dynamic Bayesian Networks. They are
described in a number of Artificial Intelligence
textbooks, for example Russell & Norvig (2002).
2 A GLYCAEMIA MODEL
2.1 A Basic Mathematical Model of the
Glucose/Insulin Dynamics
The first step in building the DBN model is to
establish a relationship between the administered
glucose and insulin and the resulting plasma levels.
The ICU-Minimal Model (ICU-MM) developed by
Van Herpe et al. (2007) is a mathematical model of
this relationship. It is an adaptation of Bergman’s
Minimal Model (Bergman et al. 1981) specifically
for ICU patients. The ICU-MM is described by a
system of four differential equations:
dG(t)/dt= (P
1
− X(t))G(t) − P
1
G
b
+
F
G
/V
G
(1a)
dX(t)/dt=P
2
X(t) + P
3
(I
1
(t) − I
b
)
(1b)
dI
1
(t)/dt= α max(0,I
2
(t))
− n(I
1
(t)−I
b
)+F
I
/V
I
(1c)
dI
2
(t)/dt= βγ(G(t)
−h)
−
nI
2
(t)
(1d)
The terms are briefly explained in Appendix 1.
However, for a detailed explanation of the model,
please refer to Van Herpe et al. (2007).
Other models exist for describing the
glucose/insulin interaction in critically ill patients.
Chase et al. (2006) reviewed three different
metabolic models used in critical care glycaemia
control. Since then, other models have been
proposed (Lin et al. 2008) (Hovorka et al. 2008).
MODELLING GLYCAEMIA IN ICU PATIENTS - A Dynamic Bayesian Network Approach
453
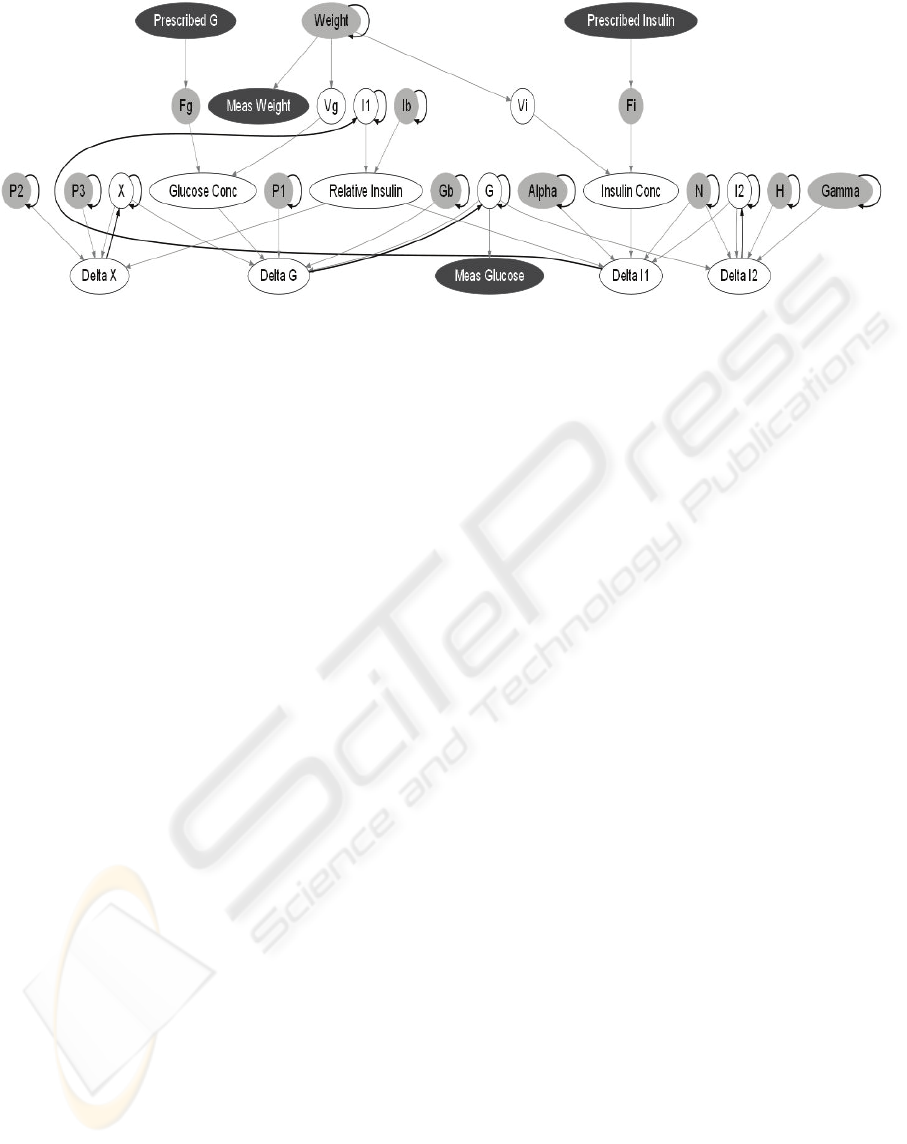
Figure 1: A Dynamic Bayesian Network for Glycaemia in ICU Patients. Grey nodes are conditionally Gaussian and vary
over time. White nodes are deterministic and black nodes are observed. Grey arrows connect nodes within a time slice;
black arrows connect nodes between time slices.
Both these models are of interest. The ICU-MM
however is based on Bergman’s Minimal Model.
Bergman’s model is the most well-known and well-
understood model that exists of glucose metabolism.
Indeed, Bergman’s Minimal Model has previously
been re-worked into a Bayesian graphical model
(Anderson and Højbjerre 2003). Their approach is,
however, significantly different to ours. They first
derive a system of SDEs from the Minimal Model
and then specify the SDEs as a DBN. As will be
explained in Section 2.2, our approach does not
require such transformation of a system of
differential equations prior to constructing the DBN.
It should also be noted that the Minimal Model is
less complex than the ICU-MM. It was developed to
assist in the diagnoses of diabetes and not for use in
the ICU setting.
2.2 The DBN Model
A DBN is made up of a series of discrete time slices.
In our model we use a one-minute time interval.
Figure 1 shows one time slice of the DBN
constructed based on the ICU-MM. Grey arrows
connect nodes within a time slice; black arrows
connect nodes from the previous time slice to the
current time slice.
The DBN contains both observed and hidden
variables. Given the history of observations up to the
current time, the DBN can compute a probability
distribution over the values of any or all of the
hidden variables: past, present, or future. Observed
nodes are coloured black in Figure 1. In our case, the
prescribed insulin and glucose infusion rates and the
measured weight of the patient are observed, and can
be viewed as inputs to the DBN. The intermittent
plasma glucose level measurements are also
observed. These glucose observations ground the
DBN in reality, so that the inferred values for the
hidden variables are specific to the patient and take
into account all of the measurements made. We are
specifically interested in inferring current and future
glucose levels, even when the most recent
measurement may have been several hours in the
past. By setting the values of nodes that correspond
to hypothetical future actions and asking the DBN to
predict future glucose levels for the patient, we can
also evaluate and select among possible treatments.
The quantitative aspect of the DBN model
consists of a conditional distribution for each node
conditioned on its parents’ values. In this system, a
node is either deterministic (i.e. its value can be
determined exactly from its parent values) or
Gaussian (i.e. the conditional distribution is a
Gaussian whose mean is a linear function of its
parents’ values). Gaussian nodes are shaded grey in
Figure 1; deterministic nodes are clear with a black
outline.
The observed value for plasma glucose (Meas.
Glucose in the DBN) is assumed to contain a certain
amount of measurement error. It is therefore
modelled with a Gaussian distribution whose mean
is its parent node, the true plasma glucose level, G.
Likewise, the data from the ICU reflects the
prescribed I.V. infusion rates for insulin and
glucose; the actual administered rates may be
different. Therefore we model the actual rates with
Gaussian distributions whose means are the
prescribed rates.
In many cases truncated Gaussian distributions
are used, in order to constrain the DBN to postulate
values that are not unrealistic for nodes. For
example, the true I.V. infusion rate for insulin (F
i
)
cannot be a negative value, only positive values are
BIOSIGNALS 2010 - International Conference on Bio-inspired Systems and Signal Processing
454
possible. The mean, standard deviation values and
limits used for the Gaussian nodes are detailed in
Appendix 2.
Similar limits were also placed on some
deterministic nodes. For example, it is not possible
to have a negative quantity of glucose in plasma, so
a limit is placed on node G to reflect this.
In the DBN, all terms of the ICU-MM can vary
over time as a patient’s insulin sensitivity changes.
Even terms that are fixed parameters in the original
ICU-MM model are allowed to vary in the DBN.
The delta nodes capture changes in quantities
over time. These changes are calculated using the
differential equations of the ICU-MM. Each delta
node has, as parent nodes, the various terms needed
to solve the appropriate differential equation.
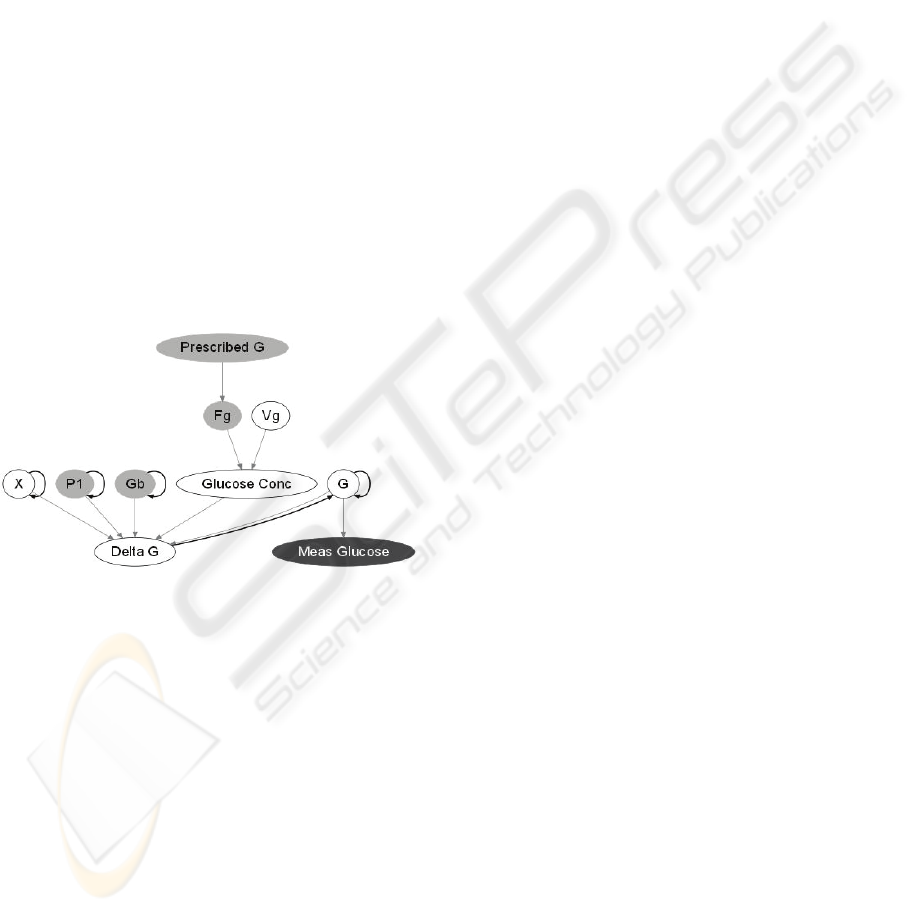
To illustrate this, Figure 2 shows a section of the
DBN that is related to Eq. (1a) of the ICU-MM.
Here, the Delta G node determines the per-minute
change in plasma glucose levels. The current plasma
glucose level is determined based on the glucose
level and Delta G calculated in the previous time
slice. Each of the terms in the differential equation
for G is represented as a parent node of Delta G.
Figure 2: Section of DBN for predicting plasma glucose
levels.
We used in-house software for building the DBN
and for performing inference using particle filtering.
Particle filtering is the means by which we
determine the most probable states of the DBN
nodes. We performed preliminary sensitivity
analyses to determine that, for this DBN, using
50,000 particles gave an acceptable balance between
execution time and accuracy.
2.3 Data Selection
In testing our model, we used data from real patients
in the ICU of University Hospital Galway.
Permission for extracting this data was given by the
Galway Research Ethics Committee, UHG. All
records were anonymised and stored on encrypted
drives.
For this research, data from patients with the
following characteristics was selected:
• Sepsis as a primary diagnosis
• Non-diabetic
• Not receiving steroids
• No major organ failure
In the next section, the results for one sample
patient are presented.
2.4 DBN Glycaemia Prediction for a
Sample Patient
Patient 23 was an ICU patient with acute pancreatitis
who was administered N6 OliClinomel 900 E
(glucose) and Actrapid (human soluble insulin)
intravenously. As was explained in Section 2.2, the
actual infusion rates are modelled as Gaussian
distributions whose means are the prescribed
infusion rates. The standard deviations on the nodes
for the actual infusion rates, F
i
and F
g
, represent the
expected error in the records. It was assumed that
the records for the prescribed infusion rates were
reasonably accurate therefore the standard deviations
on the nodes F
i
and F
g
were set to relatively small
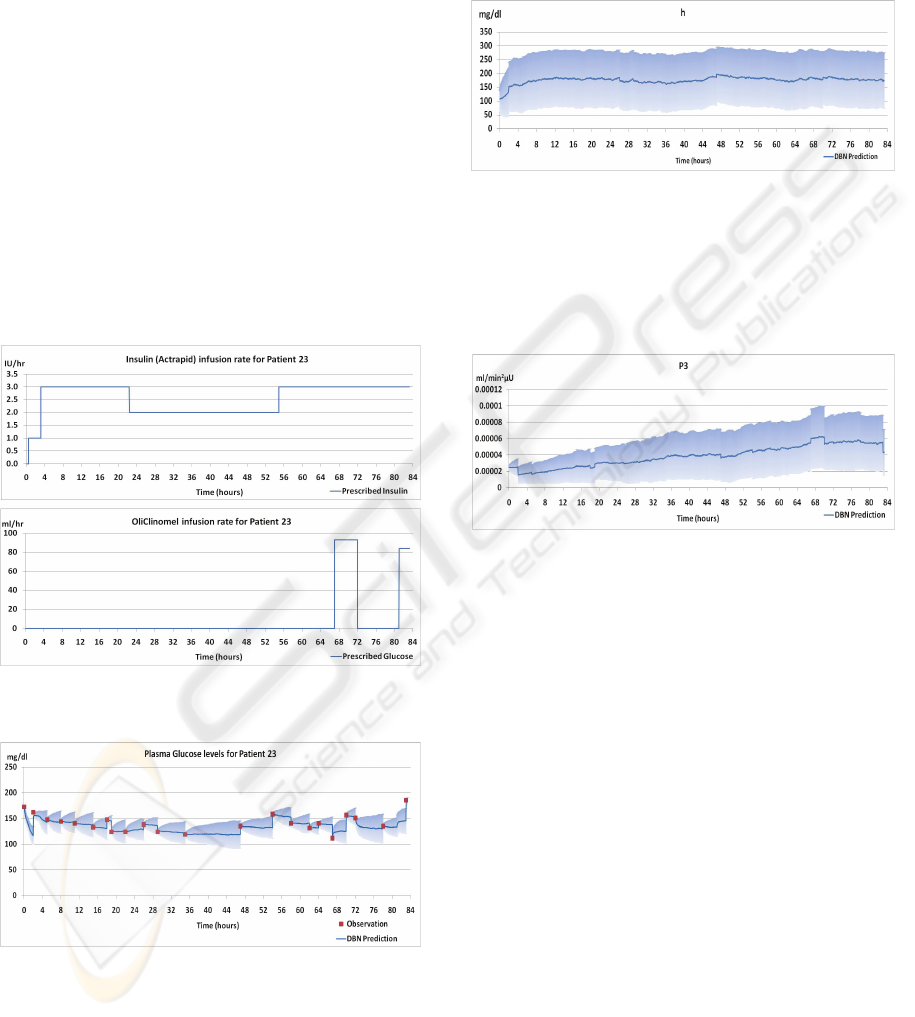
values. The prescribed infusion rates are shown in
Figure 3.
In the ICU, plasma glucose levels are measured
at frequencies of between one and four hours. The
square markers (coloured red) in Figure 4 show
these measured glucose levels. These values are
used as observations by the DBN to ground it in
reality.
As can be seen in Figure 4, the observations for
plasma glucose are intermittent; the DBN therefore
makes internal predictions of plasma glucose levels
in between observations. The accuracy of the
predictions can be evaluated by comparing the
predicted value at the time of a measurement to the
actual value. In Figure 4, the dark blue lines are the
mean values inferred by the DBN at each minute,
and the lighter blue shaded areas show the standard
deviations of inferred values, thereby giving a sense
of the uncertainty associated with its predictions
over time.
One can observe that the mean value often jumps
when a new observation becomes available. There
are factors which are unknown to the model that
influence plasma glucose levels. Because of these
unknown factors, the mean values predicted by the
model can drift from reality in between
observations. Once a new observation is available,
the model realigns itself with reality. Although the
MODELLING GLYCAEMIA IN ICU PATIENTS - A Dynamic Bayesian Network Approach
455
figures do not show it, the DBN can compute the
distribution over past glucose levels given all
previous and subsequent measurements; this
“smoothed” estimate does not have jumps in the
estimated value.
It is informative to consider the way that the
standard deviations vary over time. Because the
DBN always assumes some variability of values
over time, and because actual observations of
plasma glucose levels are available very
intermittently (once every few hours), as the time
from the last observation increases, so too does the
range of possible values. Therefore the uncertainty
of the predictions also increases. As uncertainty
increases, the mean values also drift. This is why the
standard deviations on the inferred plasma glucose
grow between observations. Whenever an
observation is provided, its plasma glucose
prediction realigns to the actual level, and its
uncertainty collapses.
Figure 3: The prescribed infusion rates used as inputs to
the DBN.
Figure 4: Glucose Levels inferred from the DBN.
It is interesting to observe the model terms to see
how they vary over time. Take for example, the
values inferred for h shown in Figure 5. Here, h
represents the glucose threshold. When this
threshold is reached, the body produces endogenous
insulin. The model starts with a population average
but quickly adjusts to a patient-specific value within
the first 4 hours. Once the node adjusts to the
patient-specific value, h does not vary to such a
large degree.
Figure 5: Values for h inferred by the DBN.
In contrast with this, other terms vary considerably
over time. P
3
for example, shown in Figure 6,
continues to rise over time. This variation reflects
the changing condition of the patient and the
possible effect of other medical interventions.
Figure 6: Values for P3 inferred by the DBN.
3 DISCUSSION
One of the difficulties with the mathematical model,
on which the DBN is based, is that not only do the
model terms vary quite considerably between
patients, there is also a large intra-patient variability
over time. In Figure 7 we compare the results for the
DBN with those obtained by using just the
differential equation model (1a)-(1d). For the latter,
shown in the lower dashed line (coloured green),
computed solutions were obtained by using the
standard Euler's method (e.g., Iserles 2009). The
DBN and the differential equation solutions both use
the same initial values. Both use the I.V. infusion
rates for glucose and insulin as inputs. Only the
DBN considers the actual measured plasma glucose
values. As can be seen, the solution to the
differential equations on their own does not succeed
in tracking the plasma glucose levels over time,
since it does not include a mechanism to recalibrate
to the measured values. By contrast the DBN
performs reasonably well, because the DBN
BIOSIGNALS 2010 - International Conference on Bio-inspired Systems and Signal Processing
456
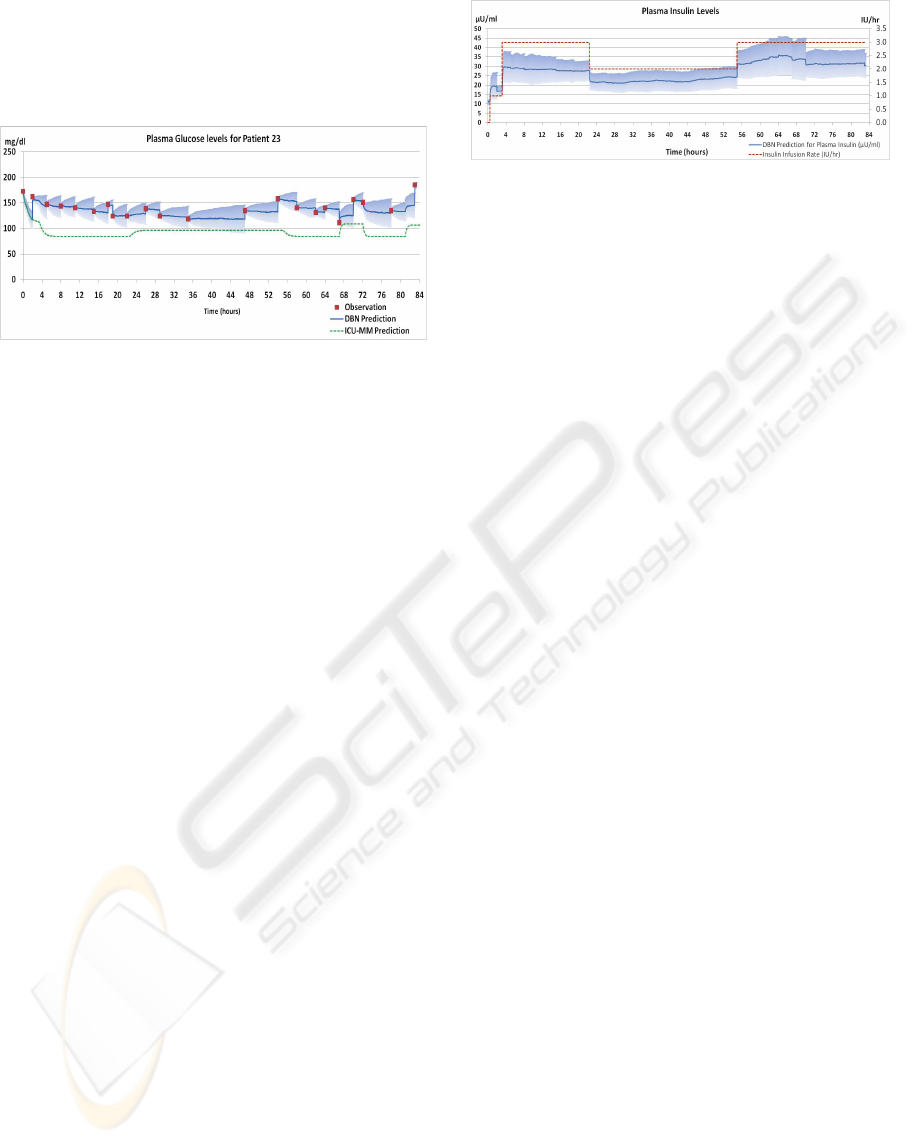
considers real-time observations of the true state and
because the DBN allows the model terms adjust to
patient-specific values in each time step, so that its
predictions are much closer to the true state than
those of the simple mathematical model.
Figure 7: ICU-MM prediction using Euler's method vs.
DBN prediction.
It should be noted that in the original
implementation of the ICU-MM by Van Herpe et al.
(2007), they did not simply use fixed values as was
done for the solution of the differential equations in
Figure 7. Their strategy for dealing with the large
inter-patient and intra-patient variability was to
choose patient-specific terms to fit the data offline,
after analysing 24 hours of data for each patient, and
then re-estimating these parameters every hour or
every 4 hours.
Our DBN-based system uses quite a different
approach for recalibration of model parameters from
general values to patient-specific values. We select
Gaussian distributions, suited to the cohort of
patients in our dataset, as starting values for the
model, and the DBN then adjusts these terms in each
time-slice to find the best fit for the specific patient,
given all the evidence up to that point. Often the
first 24 hours in the ICU are the most critical and
also the most unstable. Having a model that is
calibrated to the patient in the first 24 hours is of
clinical value.
Despite the large variance of the initial parameter
estimates, the sparsity of the evidence, the
prevalence of uncertainty in the model, and the
omission of several factors from the model, the DBN
performs remarkably well. For example, the
predicted values for the hidden Plasma Insulin
variable, shown in Figure 8, are strongly correlated
with the prescribed insulin infusion rates as one
would expect.
Figure 8: Plasma insulin levels inferred by the DBN are
strongly correlated with the prescribed insulin infusion
rates.
The underlying mathematical model is relatively
simple. It does not fully describe the complexity of
the system being modelled. The only inputs to the
DBN model are the I.V. infusion rates and the
patient’s weight. Plasma glucose levels are the only
sources of evidence available to help align the DBN
to reality. This evidence is both sparse and
intermittent. The dynamics of the system being
modelled are constantly changing as the patient’s
insulin sensitivity changes. But by allowing the
model terms to vary, the DBN can anticipate these
changes, even though they are unobserved. The light
blue shaded areas in Figure 4 show the range of
possible values for plasma glucose predicted by the
DBN. New observations are generally within this
range.
4 FUTURE DIRECTIONS AND
CONCLUSIONS
4.1 Future Directions
The DBN model presented in this paper is a
relatively basic model. There are many factors that
influence how a patient reacts to insulin and glucose
infusions. These include the reason for which the
patient was admitted to the ICU. For example, a
patient with sepsis is more likely to have
hyperglycaemia than a patient who was admitted
following cardiac surgery (Chase et al. 2006). Then
there are interactions with other medications. For
example, steroids can reduce a patient’s insulin
sensitivity. Future models will incorporate these
important factors that influence a patient’s response
to insulin.
The current model assumes that all glucose is
administered intravenously. Many ICU patients are
fed enterally. Gut absorption of glucose must be
included if this model is to be of use in a clinical
setting.
MODELLING GLYCAEMIA IN ICU PATIENTS - A Dynamic Bayesian Network Approach
457

With these factors in mind we hope to work on
new systems of differential equations to model the
physical phenomena and also novel techniques to
solve these numerically. This work will enable a
comprehensive comparison of this DBN approach to
numerical simulations.
Future work will also include additional
validation of the model. We would like to validate
the model on a larger number of patients and
compare our methodology to other approaches.
4.2 Concluding Remarks
The system that has been presented in this paper,
which uses a Dynamic Bayesian Network approach
to modelling glycaemia in critically ill patients,
shows great promise. The system performs
extremely well in the context of great uncertainty,
sparse observations and limited system knowledge.
Our approach demonstrates a principled
technique for using standard real-time measurements
from ICU patients, to recalibrate model parameters
from general values to patient-specific values. This
model has the potential to be used by physicians to
individualise insulin dosage or to be incorporated
into a control system to automate insulin delivery.
The approach demonstrated here is applicable to
other applications where unseen variables must be
assessed and individualized in real-time.
Finally, the methodology introduced in this
paper, for mapping a system of differential equations
directly to a DBN, can be applied to other systems of
differential equations where all model terms vary,
and both continuous and sporadic temporal evidence
must be incorporated for an accurate solution.
ACKNOWLEDGEMENTS
We are grateful to the UHG Research Ethics
Committee for granting permission to extract
historical records from the database in the ICU of
University Hospital Galway. We acknowledge the
contributions of Dr Petri Piiroinen to the research
project overall and his feedback on this paper. This
research has been supported by Science Foundation
Ireland under grant 08/RFP/CMS1254, and by a
Marie Curie Transfer of Knowledge Fellowship of
the EU 6th Framework Programme contract CT-
2005-029611.
REFERENCES
Abkai, C. & Hesser, J., 2009. Virtual intensive care unit
(ICU): real-time simulation environment applying
hybrid approach using dynamic Bayesian Networks
and ODEs. Studies in Health Technology and
Informatics, 142, 1-6.
Aleks, N., Russell, S., Madden, M.G., Morabito, D.,
Staudenmayer, K., Cohen, M., Manley, G., 2008.
Probabilistic detection of short events, with
application to critical care monitoring. Proceedings of
NIPS 2008: 22nd Annual Conference on Neural
Information Processing Systems, Vancouver, Canada.
Andersen KE, Højbjerre M., 2003. A Bayesian approach
to Bergman’s minimal model. In C. M. Bishop and B.
J. Frey (eds), Proceedings of the Ninth International
Workshop on Artificial Intelligence and Statistics, Jan
3-6, 2003, Key West, FL.
Bergman, R.N., Phillips, L.S. & Cobelli, C., 1981.
Physiologic evaluation of factors controlling glucose
tolerance in man: measurement of insulin sensitivity
and beta-cell glucose sensitivity from the response to
intravenous glucose. Journal of Clinical Investigation,
68(6), 1456–1467.
Charitos, T., Van der Gaag, L.C., Visscher, S., Schurink,
K.A. & Lucas, P.J., 2009. A dynamic Bayesian
network for diagnosing ventilator-associated
pneumonia in ICU patients. Expert Systems with
Applications, 36(2P1), 1249–1258.
Chase J, Shaw G, Wong X, Lotz T, Lin J, Hann C., 2006.
Model-based glycaemic control in critical care—A
review of the state of the possible. Biomedical Signal
Processing and Control, 1(1), 3-21.
Van Gerven, M.A., Taal, B.G. & Lucas, P.J., 2008.
Dynamic Bayesian networks as prognostic models for
clinical patient management. Journal of Biomedical
Informatics, 41(4), 515-529.
Haverbeke N, Van Herpe T, Diehl M, Van den Berghe G,
De Moor B, 2008. Nonlinear model predictive control
with moving horizon state and disturbance estimation
– application to the normalization of blood glucose in
the critically ill. Proceedings of the 17th IFAC World
Congress 2008.
Hovorka, R., Chassin, L.J., Ellmerer, M., Plank, J. and
Wilinska, M.E.:,2008. A simulation model of glucose
regulation in the critically ill. Physiological
Measurement, 29, 959-978.
Iserles, Arieh, 2009. A first course in the numerical
analysis of differential equations. Second edition.
Cambridge Texts in Applied Mathematics. Cambridge
University Press, Cambridge.
Lin, J., Lee, D., Chase, J., Shaw,G., Le Compte, A., Lotz,
T., Wong, J., Lonergan, T., Hann, C.,2008. Stochastic
modelling of insulin sensitivity and adaptive glycemic
control for critical care. Comput. Methods Prog.
Biomed., 89(2), 141-152.
Russell, S. & Norvig, P., 2002. Artificial Intelligence: A
Modern Approach (2nd Edition), Prentice Hall.
The NICE-SUGAR Study Investigators, Finfer S, Chittock
DR, Su SY, Blair D, Foster D, Dhingra V, Bellomo R,
BIOSIGNALS 2010 - International Conference on Bio-inspired Systems and Signal Processing
458

Cook D, Dodek P, Henderson WR, Hébert PC,
Heritier S, Heyland DK, McArthur C, McDonald E,
Mitchell I, Myburgh JA, Norton R, Potter J, Robinson
BG, Ronco JJ. et al., 2009. Intensive versus
Conventional Glucose Control in Critically Ill
Patients. New England Journal of Medicine, 360(13),
1283-1297.
Van Herpe, T., Espinoza, M. & Haverbeke, N., De Moor,
B., Van den Berghe, G.2007. Glycemia prediction in
critically ill patients using an adaptive modeling
approach. Journal of Diabetes Science and
Technology, 1(3), 348-356.
Van den Berghe, G., P. Wouters, P. ,Weekers, F.,
Verwaest, C., Bruyninckx, F., Schetz, M., Vlasselaers,
D., Ferdinande, P., Lauwers, P., Bouillon, R., 2001.
Intensive Insulin Therapy in Critically Ill Patients. N
Engl J Med, 345(19), 1359-1367.
APPENDIX 1: THE ICU-MM
Van Herpe et al. (2007) define the model terms as:
G: Glucose concentration in blood plasma.
I
1
: The insulin concentration in blood
plasma.
X: The effect of insulin on net glucose
disappearance. X is proportional to the
insulin in the remote compartment.
I
2
: The remote insulin. This variable does not
have a strictly defined clinical
interpretation but can be approached by
the fraction of insulin concentration
derived from the endogenous insulin
secretion.
G
b
: The basal value of plasma glucose.
I
b
: The basal value of plasma insulin.
F
I
and F
G
: The intravenous rate of insulin and
glucose are the two input variable to the
model.
V
G
: The glucose distribution space.
V
I
: The insulin distribution volume.
P
1
: The glucose effectiveness (i.e. the
fractional clearance of glucose) when
insulin remains at basal level.
P
2
: The fractional rate of net remote insulin
disappearance.
P
3
: The fractional rate of insulin-dependent
increase.
γ: The proportion by which endogenous
insulin is released when glycaemia
exceeds a threshold.
h: The glucose threshold. When this
threshold is reached the endogenous
insulin is produced.
n: The time constant for insulin
disappearance.
β: An additional model coefficient to keep
units correct. β = 1 min.
α: A scaling factor for the second insulin
variable I
2
.
APPENDIX 2: NODE VALUES AS
USED IN THE DBN
Table 1 below specifies the values set in the DBN
for the Gaussian nodes. Initially values were taken
from Haverbeke et al. (2008), subsequently G
b,
P
1
,
and P
3
were modified.
Table 1: The means, standard deviations and limits for the
Gaussian nodes.
Node Mean Standard Deviation Range
Sensor
Model
Transition
Model
G
b
135 mg/dl 5 1 0+
I
b
10.7 μU/ml 1 0.1 0+
P
1
-0.0371
per min
0.005 0.005 -1:0
P
2
-0.0224
per min
0.002 0.002 -1:0
P
3
2.5E-5
ml/(min
2
μU)
2.0E-7 1.0E-6 0:1
h 107.4 mg/dl 30 10 0:360
N 0.2623
per min
0.1 0.001 0:1
Alpha 0.35 0.1 0.01 0+
Gamma 1.4001E-4
per min
1.0E-5 1.0E-5 0:1
F
i
Prescribed I 1 0+
F
g
Prescribed G 1 0+
Meas G G 5
Meas
Weight
Weight 0.1
The nodes V
g
and V
i
are modelled as
deterministic nodes. Their values are calculated as
1.6*Weight and 120*Weight respectively.
MODELLING GLYCAEMIA IN ICU PATIENTS - A Dynamic Bayesian Network Approach
459
