
SHANNON ENTROPY AND FRACTAL ANALYSIS FOR THE 16S
RIBOSOMAL RNA AND COX2 MT-DNA SEQUENCES IN
PRIMATES INCLUDING NEANDERTHAL
N. Gadura*, Todd Holden**, G. Tremberger, Jr**, E. Cheung**
P. Schneider*, D. Lieberman** and T. Cheung**
Biology* and Physics** Departments, CUNY Queensborogh Community College, Bayside, NY 11364 U.S.A.
Keywords: Mono-nucleotide entropy, Di-nucleotide entropy, Fractal dimension, Neanderthal mt-DNA COX2,
Neanderthal mt-DNA 16S rRNA.
Abstract: The primate mt-DNA 16S rRNA and COX2 sequences, including Neanderthal sequences, were studied
using nucleotide frequency, mono- and di-nucleotide entropy, and fractal dimension. The fractal dimension
was computed with the Higuchi method when a nucleotide sequence is expressed as a numerical sequence
where each nucleotide is assigned its proton number. The results shows that the C+G percent correlates
with the fractal dimension with R-square value of around 0.88 (N = 8) for both gene sequences. The Di- and
mono-nucleotide entropy is also well correlated with similar R-square values. For the COX2 gene, the
human and Neanderthal cluster at high entropy suggests that chimp, gorilla, and orangutan were subjected to
a higher selection pressure for this gene. The human COX2 has less entropy than the Neanderthal COX2
consistent with the presence of some selection pressure.
1 INTRODUCTION
Closely related species can be classified by a
collection of phylogenetic markers with numbers
determined from mathematical operations on DNA
sequence. In cases where such markers are
significantly different from what would be expected
for random mutations, we can get an idea of how
much natural selection has influenced the evolution
of a particular gene. Here, we analyze primate mt-
DNA 16S ribosomal RNA (rRNA) and COX2
sequences, including Neanderthal sequences, using
nucleotide frequency, mono- and di-nucleotide
entropy, and fractal dimension. For protein encoded
by the mt-DNA genome, COX2 have experienced
four amino acid substitutions on the modern human
mtDNA lineage (Green et al, 2008). COX2 encodes
a protein that maintains a proton gradient across the
mitochondrial inner membrane, which drives the
phosphorylation of ADP to ATP. The conclusion
that the evolution of human COX2 from Neanderthal
has been for minor adaptive advantages without
significant functional consequences for
mitochondrial function were put forward using the
fact that the substitutions are on non-functional site
in the crystal structure. The relationship of the
above mentioned phylogenetic markers would shed
light whether there is selection pressure
corresponding to some yet to be discovered
significant function. The 16S rRNA is an important
gene in classification and is included in this study.
The nucleotide base pair changes over a gene
sequence can be viewed as a fluctuation and,
consequently, can be investigated with standard
tools that include correlation and fractal dimension
analysis. For this study, the numerical sequence
representing the fluctuation of nucleotides in a gene
sequence was generated using the proton number of
each nucleotide. This numerical series can then be
processed further using numerical methods such as a
moving average, which is often used in stock market
time series analysis. The fractal dimension of such a
random series or random series derived from the
original atomic number based sequence can be
computed. A recent comparison of human and
chimpanzee genomes revealed that it is possible to
measure the acceleration rate of the accelerated
regions of the human genome (Pollard, et al, 2006a).
The most accelerated region, HAR1, was shown by
a gene expression experiment in the human embryo
to be transcription active and co-expressed with
257
Gadura N., Holden T., Tremberger Jr G., Cheung E., Schneider P., Lieberman D. and Cheung T. (2010).
SHANNON ENTROPY AND FRACTAL ANALYSIS FOR THE 16S RIBOSOMAL RNA AND COX2 MT-DNA SEQUENCES IN PRIMATES INCLUDING
NEANDERTHAL.
In Proceedings of the First International Conference on Bioinformatics, pages 257-260
DOI: 10.5220/0002753002570260
Copyright
c
SciTePress
reelin, which is an essential protein involved in the
development of the six-layer cortex of the human
brain. Fractal analysis was applied to the HAR1
nucleotide sequence and the homologous sequence
in the chimpanzee genome. Analysis shows that the
differences in fractal dimension can be used as a
marker of evolution. The 118-bp in HAR1 contains
18 point substitutions over an evolutionary span of 5
million years when comparing the human to the
chimpanzee. However, the same 118-bp region only
contains two point substitutions over a span of 300
million years when comparing the chicken to the
chimpanzee. The implications of evolution and
positive selection have been discussed in recent
literature (Pollard, et al, 2006b).
2 MATERIALS & METHODS
The nucleotide sequences were downloaded from
Genbank. The accession numbers of the mtDNA
database are listed in the Appendix. The studied
primates are human, Neanderthal, chimp (chimp and
pygmy chimp), gorilla (western and western
lowland), and orangutan (Bornean and Sumatran).
The ATCG sequence was converted to a
numerical sequence by assigning the atomic number,
the number of protons, to each of the nucleotides:
A(70), T(66), C(58), G(78). The assigned number is
roughly proportional to the nucleotide mass. This
assignment was consistent with the recently reported
mass fractal analysis of a ribosome sequence (Lee
2006). The A-T and C-G pairs in a double strand
DNA would have the same value of 136.
Fractal dimension analysis can be used in the
study of correlated randomness. Among the various
fractal dimension methods, the Higuchi fractal
method is well suited for studying signal fluctuation
(Higuchi, 1998). The signal from the sequence
represents a random spatial intensity series. The
spatial intensity (Int) random series with equal
intervals could be used to generate a difference
series (Int(j)-Int(i)) for different lags in the spatial
variable. The non-normalized apparent length of the
spatial series curve is simply L(k) = Σ absolute
(Int(j)-Int(i)) for all (j-i) pairs from 1 to k. The
number of terms in a k-series varies and
normalization must be used to get the series length.
If the Int(i) is a fractal function, then the log (L(k))
versus log (1/k) should be a straight line with the
slope equal to the fractal dimension. Higuchi
incorporated a calibration division step (divide by k)
such that the maximum theoretical value is
calibrated to the topological value of 2. The detailed
calculation is given in the literature (Higuchi, 1998).
When comparing the dimension of two fractal
forms, the popular method of taking the difference
of the two Higuchi fractal dimension values is valid
to within a constant regardless of the calibration
division step. The Higuchi fractal algorithm used in
this project was calibrated with the Weierstrass
function. This function has the form W(x) = Σ a
-nh
cos (2 π a
n
x) for all the n values 0, 1, 2, 3… The
fractal dimension of the Weierstrass function was
given by (2 - h) where h takes on an arbitrary value
between zero and one.
The Shannon entropy of a sequence can be used
to monitor the level of functional constraints acting
on the gene (Parkhomchuk, 2006). A sequence with
relatively low nucleotide variety would have a low
Shannon entropy (more constraint) in terms of the
set of 16 possible di-nucleotide pairs. A sequence’s
entropy can be computed as the sum of (p
i
) log(p
i
)
over all states i and the probability p
i
can be
obtained from the empirical histogram of the 16 di-
nucleotide-pairs. The maximum entropy is 4 binary
bits per pair for 16 possibilities (2
4
). The maximum
entropy is 2 bits per mono-nucleotide with 4
possibilities (2
2
).
3 RESULTS & DISCUSSION
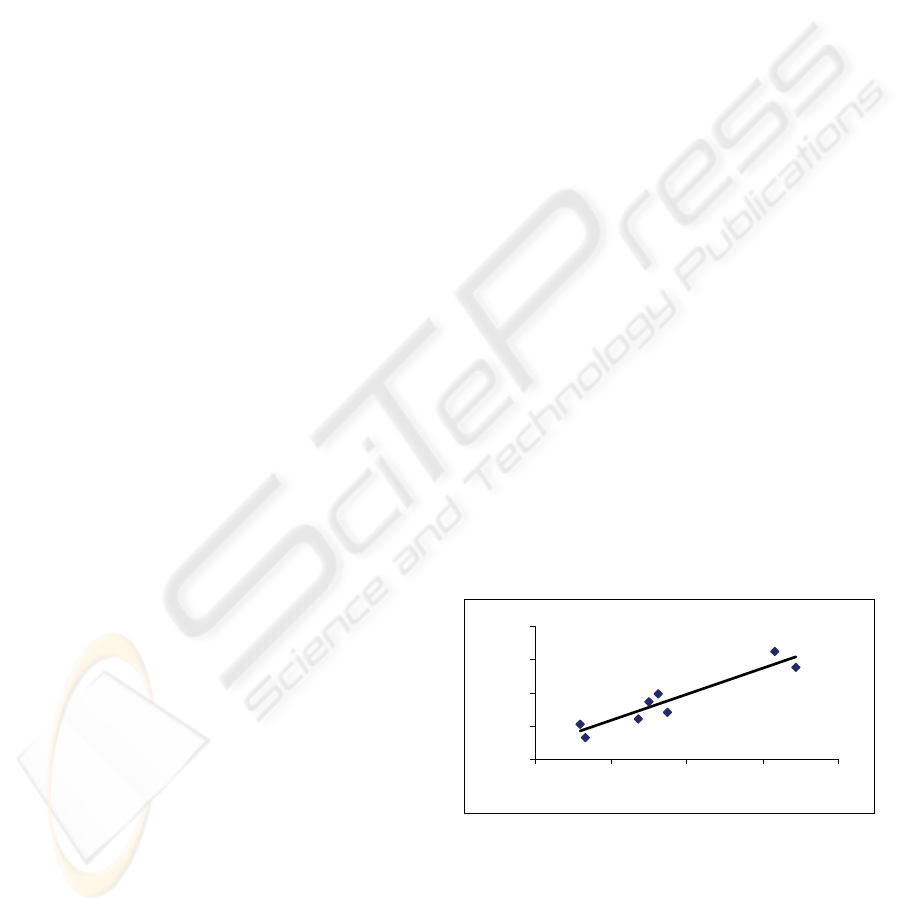
For the 16S rRNA sequences, the C+G percent
correlates with fractal dimension, FD, with R-square
value of 0.88, N = 8, in Figure 1. Dropping human
and Neanderthal data would increase the R-square
value to ~ 0.91 because the data are in the middle as
small outliers.
y = 0.7981x + 1.6265
R
2
= 0.881
1.96
1.965
1.97
1.975
1.98
0.42 0.425 0.43 0.435 0.44
Figure 1: The C+G percent (x-axis) versus FD (y-axis) for
the studied 16S rRNA sequences.
The mono-nucleotide entropy correlates with di-
nucleotide entropy in the 16S rRNA sequence with
R-square value of ~ 0.88, N = 8 (Figure 2).
Dropping human and Neanderthal increases R-
BIOINFORMATICS 2010 - International Conference on Bioinformatics
258
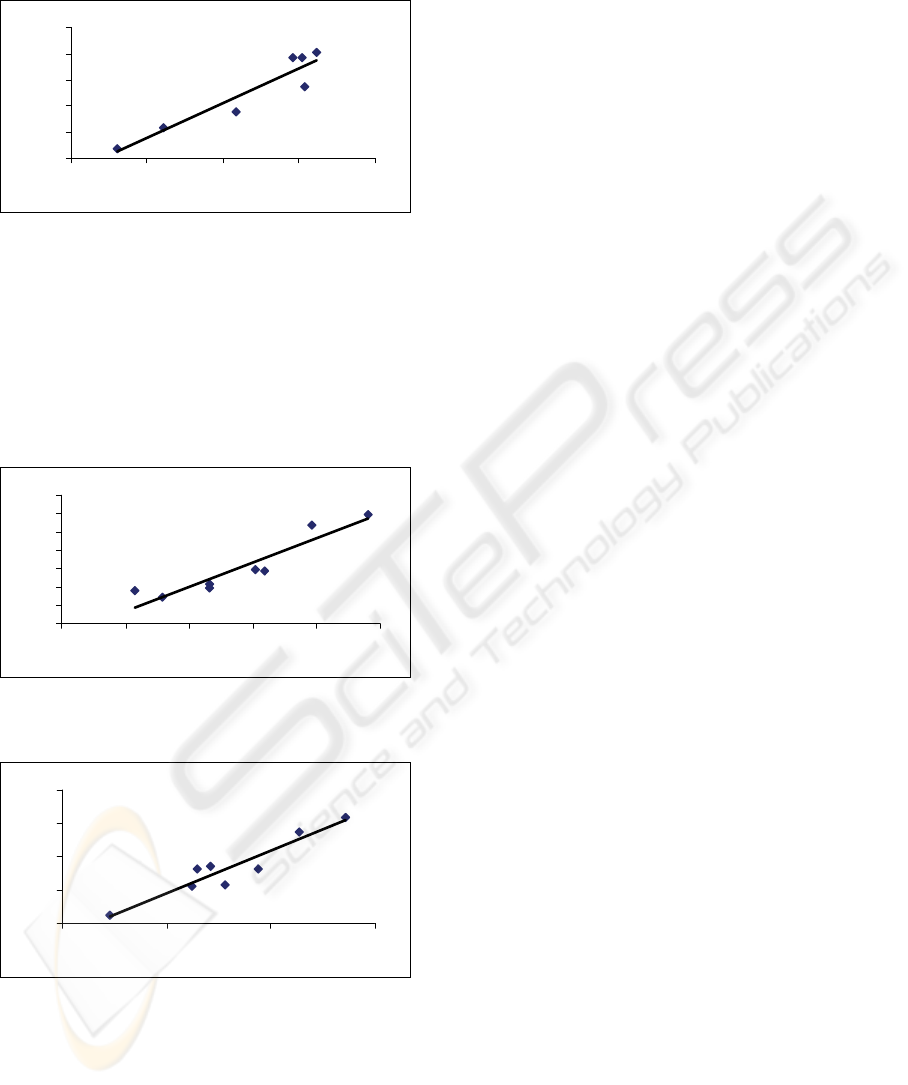
square value of ~ 0.99 because they are in the
middle as moderate outliers
y = 3.3227x - 2.5987
R
2
= 0.8838
3.87
3.875
3.88
3.885
3.89
3.895
1.946 1.948 1.95 1.952 1.954
Figure 2: The mono-nucleotide entropy (x-axis) versus the
di-nucleotide entropy (y-axis) for the studied 16S rRNA
sequences.
Similar correlation of the C+G percent with FD is
observed for COX2 sequences R-square value of ~
0.8756, N = 8 (Figure 3). Dropping the human and
Neanderthal data would increase the R-square value
to ~ 0.93 because they are in the middle as moderate
outliers.
y = 1.3163x + 1.3876
R
2
= 0.8756
1.96
1.97
1.98
1.99
2
2.01
2.02
2.03
0.43 0.44 0.45 0.46 0.47 0.48
Figure 3: The C+G percent (x-axis) versus FD (y-axis) for
the studied COX2 sequences.
y = 2.5412x - 1.0639
R
2
= 0.8979
3.87
3.88
3.89
3.9
3.91
1.94 1.945 1.95 1.955
Figure 4: The mono-nucleotide entropy (x-axis) versus the
di-nucleotide entropy (y-axis) for the studied COX2
sequences.
Similar correlation of the single entropy with pair
entropy is observed for COX2 sequences R-sq ~
0.8979 (Figure 4). The interesting point is that if
human and Neanderthal are deleted then the
correlation drops to 0.7601 because they are the two
end points at large values (mono-nucleotide entropy
for Neanderthal ~ 1.953 bits, for human 1.951 bits).
Correlation would suggest similar selection
pressure mechanism. Conserved regions would
imply less random nucleotide fluctuation across
species and the fractal dimension would differ from
2 and the di-nucleotide Shannon entropy would be
smaller than 4 bits. Our previous results have
associated fractal dimension with functionality
(Tremberger, Jr., et al., 2009). The observation of
fractal dimension correlation to the C+G percent
(which is correlates to the A+T percent) shows that
human and Neanderthal occupy the mid range region
and thus would indicate a mild selection pressure on
the functionality of the 16S ribosomal RNA and
COX2 sequences as compared to the other primates.
Our previous results have associated entropy with
constrains (Holden et al, 2008). The high-value
positions of the COX2 sequences in the single-
entropy and pair entropy correlation suggests a
weaker constraint in human and Neanderthal as
compared to other primates. Di-nucleotide
frequency distributions confirm the closeness of
relations among the various primates. For the COX2
genes, lowered entropy is largely a manifestation of
high Cytosine (~30 %) and low Guanine (~15 %)
content. Di- and mono-nucleotide entropy is well
correlated. That human and Neanderthal cluster at
high entropy indicates that chimp, gorilla, and
orangutan were subjected to a higher selection
pressure for this gene. The human COX2 has less
entropy than the Neanderthal COX2 consistent with
the presence of some selection pressure.
Whether the mild selection pressure and the
weak constraint observed in the mtDNA 16S rRNA
and COX2 sequences have activated other selection
response such as those observed in the brain
function related HAR1 sequence is an interesting
consideration. The HAR1 hardly evolved in 300
million years from chicken to chimp and then
experienced accelerated selection pressure. The
fractal analysis shows that the HAR1 has a fractal of
2.02 while the chimp is at 1.97, the di-nucleotide
entropy is 3.86 bits for human and 3.64 bits for
chimp; and single entropy is 1.97bits for human,
1.86 bits for chimp. If the HAR1-like activation
exists such that the selection pressure would be mild
on the mt-DNA, it would suggests that the
Neanderthal would have similar HAR1-like response
as their 16S rRNA and COX2 sequences are very
similar to the human’s in terms of the above studied
parameters. The activation would be an indication
of cooperation in multi-cellular organism. In this
regard the CNV (copy number variants) strategy
SHANNON ENTROPY AND FRACTAL ANALYSIS FOR THE 16S RIBOSOMAL RNA AND COX2 MT-DNA
SEQUENCES IN PRIMATES INCLUDING NEANDERTHAL
259

should also be considered. It is possible that less
demand on the Cs and Gs with multiple copies could
be more advantageous than higher demand on Cs
and Gs bias with fewer copies for responding to
selection pressure. The correlation analysis method
can be a good supplemental tool to the relative
comparison method inherent in the BLAST method.
4 CONCLUSIONS
The nucleotide fluctuation of the mtDNA 16S rRNA
and COX2 gene sequences in primates including
Neanderthal were studied. The tools are fractal
dimension, Shannon mono- and di-nucleotide
entropy, and C+ G content. We found that C+G
content correlates with the fractal dimension. The
correlation of the mono- and di-nucleotide entropy
shows that the human COX2 gene has experienced
some selection pressure. Future studies include the
extension to other species.
ACKNOWLEDGEMENTS
The project was partially supported by several
CUNY PSC and Collaborative grants. N.G.
received partial support from CUNY Collaborative
CCIRG and Perkins Grant. E.C. thanks the
hospitality of QCC. We thank the research groups
for posting their gene sequence data in Genbank.
REFERENCES
Green, RE, 2008, Malaspinas AS, et al. “A Complete
Neandertal Mitochondrial Genome Sequence
Determined by High-Throughput Sequencing”, Cell,
134, 416-426.
Holden, T. 2008, G. Tremberger, Jr., P. Marchese, E.
Cheung, R. Subramaniam, R. Sullivan, P. Schneider,
A. Flamholz, D. Lieberman, & T. Cheung, “DNA
sequance based comparative studies of between non-
extremophile and extremophile organisms with
implications in exobiology”, SPIE Proceedings,
70970Q, (12 pages) invited.
Higuchi, T., 1998, "Approach to an irregular time series
on the basis of fractal theory", Physica D vol 31, 277-
283.
Lee, Chang-Yong, 2006 “Mass Fractal Dimension of the
Ribosome and Implication of its Dynamic
Characteristics”, Physical Review E 73, 042901.
Parkhomchuk, DV, 2006 ” Di-nucleotide Entropy as a
Measure of Genomic Sequence Functionality”,
arXiv:q-bio/0611059
Pollard, KS 2006a, Salama SR, Lambert N, Coppens S,
Pedersen JS, et al., “An RNA gene expressed during
cortical development evolved rapidly in humans”.
Nature 443, 167-172.
Pollard KS, 2006b, Salama SR, King B, Kern AD, Dreszer
T, et al. “Forces shaping the fastest evolving regions
in the human genome”, PLoS Genet 2(10): e168. DOI:
10. 1371/journal.pgen.0020168
Tremberger, Jr., George, E. Cheung; N. Gadura; T.
Holden; R. Subramaniam; R. Sullivan; P. Schneider;
A. Flamholz; D. Lieberman; T. Cheung, “Multi-fractal
property of perchlorate reductase gene sequences and
DNA photonics application to UV fluorescence
detection on Mars-like surface”, SPIE Proceedings
Vol. 7441, 74410G, (10 pages) invited, 2009
APPENDIX
The studied sequences were downloaded from the
Genbank mtDNA database. The accession numbers
are:
NC_001644 Pan paniscus mitochondrion, (pygmy
chimpanzee).
NC_001643 Pan troglodytes mitochondrion,
(chimpanzee).
NC_011120 Gorilla gorilla gorilla mitochondrion
(Western lowland gorilla).
NC_001645 Gorilla gorilla mitochondrion (Western
Gorilla).
AC_000021 Homo sapiens mitochondrion, (human).
NC_011137 Homo sapiens neanderthalensis
mitochondrion, (Neanderthal).
NC_001646 Pongo pygmaeus mitochondrion
(Bornean orang-utan).
NC_002083 Pongo abelii mitochondrion, (Sumatran
orangutan).
BIOINFORMATICS 2010 - International Conference on Bioinformatics
260
