
SPARSE BUMP MODELING OF MILDAD PATIENTS
Modeling Transient Oscillations in the EEG of Patients with Mild Alzheimer’s
Disease
Franc¸ois-Benoit Vialatte
a,1
, Charles Franc¸ois Vincent Latchoumane
b
, Nigel Hudson
c
Sunil Wimalaratna
d
, Jordi Sol´e-Casals
e
, Jaeseung Jeong
b
and Andrzej Cichocki
a
a
Riken BSI, Lab. ABSP, Wako-Shi, Japan
b
KAIST, Dept of Bio and Brain Engineering, Daejeon, South Korea
c
Derriford Hospital, Dept of Neurophysiology, Plymouth U.K.
d
Radcliffe Infirmary, Dept of Neurology, Oxford, U.K.
e
Digital Technologies Group,University of Vic, Vic, Spain
Keywords:
EEG, Alzheimer, Time-frequency, Bump, Local synchrony.
Abstract:
We explore the potential of bump modeling to extract transient local synchrony in EEG, as a marker for
mildAD (mild Alzheimer’s disease). EEG signals of patients with mildAD are transformed to a wavelet time-
frequency representation, and afterwards a sparsification process (bump modeling) extracts time-frequency
oscillatory bursts. We observed that organized oscillatory events contain stronger discriminative signatures
than averaged spectral EEG statistics for patients in a probable early stage of Alzheimer’s disease. Specifically,
bump modeling enhanced the difference between mildAD patients and age-matched control subjects in the θ
and β frequency ranges. This effect is consistent with previous results obtained on other databases.
1 INTRODUCTION
Alzheimer’s disease is a brain disorder, whose preva-
lence is dramatically increasing (due to the general in-
crease of life expectancy), threatening our societies.
It would be a great asset if we were able to detect
it as early as possible. A cost-efficient technique
would be necessary to screen populations at risk, po-
tentially thousands to even millions of people. Elec-
troencephalography (EEG) is cost-effective, and was
suggested as a tool for diagnosing AD (Jeong, 2004);
however its specificity to the disease is low, so that
its reliability is sometimes questioned. Nevertheless,
EEG data are not totally exploited by medical teams,
especially its main advantage: a very precise time
resolution, allowing investigations of brain dynamics
(see (Jeong, 2004) for a review). Our purpose here is
to explore the potential of transient local synchrony in
EEG, as a marker for the early stages of Alzheimer’s
disease.
Brain signals evolve quickly and non-linearly in
1
FBV was at KAIST, Dept of Bio and Brain Engineer-
ing, when this investigation was done
time. EEG recordings consist of stable and sustained
activities on one hand, and unstable and transitory ac-
tivities on the other hand. When these transitory ac-
tivities become organized in patterns, they form bursts
in EEG signals. Here, we are interested in these
bursts, usually characterized as a succession of 4-5
oscillations, within a limited frequency range: they
are hypothesized to be representative of transient syn-
chronies of neural populations (Vialatte et al., 2007;
Vialatte et al., 2009b; Vialatte et al., 2009c). In the
past few years, a lot of attention was devoted to EEG
signals evoked or induced by specific stimulations
(see e.g. (Bas¸ar, 1980; Quiroga et al., 2001; Moratti
et al., 2007; Nikulin et al., 2007; Klimesch et al.,
2007; Vialatte et al., 2009b)). The brain responses
to stimuli can be observed in EEG signals, and such
oscillatory bursts can be part of this response. But
this kind of activity is not shut down during rest pe-
riods. We intend here to study oscillatory bursts in
EEG signals recorded in rest condition, at the single
trial level (not using averaging, which is meaningless
in this context). For this purpose, we applied bump
modeling as a transient local synchrony marker for
479
Vialatte F., François Vincent Latchoumane C., Hudson N., Wimalaratna S., Solé-Casals J., Jeong J. and Cichocki A. (2010).
SPARSE BUMP MODELING OF MILDAD PATIENTS - Modeling Transient Oscillations in the EEG of Patients with Mild Alzheimer’s Disease.
In Proceedings of the Third International Conference on Bio-inspired Systems and Signal Processing, pages 479-484
DOI: 10.5220/0002755104790484
Copyright
c
SciTePress

AD detection.
2 METHODS
2.1 EEG Data - Patients With MildAD
These data were obtained using a strict protocol from
Derriford Hospital, Plymouth, U.K. and had been
collected using normal hospital practices (Henderson
et al., 2006). EEGs were recorded during a resting
period with various states: awake, drowsy, alert and
resting states with eyes closed and open. All record-
ing sessions and experiments proceeded after obtain-
ing the informed consent of the subjects or the care-
givers and were approved by local institutional ethics
committees. We used two EEG databases: database
A and database B.
Database A was composed of 24 healthy control sub-
jects (age: 69.4±11.5; 10 males) and 17 patients with
AD (age: 77.6±10.0; 9 males). The two groups were
not perfectly age-matched. This might later introduce
biases. However, it was shown in a previous study that
no major effects stemming from this disparity were
found (Henderson et al., 2006). The patient group
underwent full cognitive tests, but no neuro-imaging
study or neuropsychological scores were available
due to disparity among patients’ districts. EEG time
series were recorded at a sampling frequency of 128
Hz using 19 electrodes disposed according to the
Maudsley System, which is similar to the 10-20 in-
ternational system.
Database B was composed of age-matched subjects,
including 5 healthy control subjects (age: 76.6±5.6;
3 males; MMSE: 29.3±0.7) and 5 AD patients (age:
78.8±2.4; 2 males; MMSE: 22.3±3.1). The AD
patients were diagnosed according to the NINCDS-
ADRDA and DSM IV criteria and underwent general
medical, neuromedical, and psychiatric assessments.
The cognitive evaluation included a large number of
tests such as the MMSE (Mini Mental State Exami-
nation), Clinical Dementia Rating Scale (CDRS), and
Geriatric Depression Scale (GDS). EEG time series
were recorded at a sampling frequency 8 of 128 Hz
using 21 electrodes disposed according to the 10-20
international system.
EEGs were band-pass filtered with digital 2nd or-
der Butterworth filter (forward and reverse filtering)
between 0.5 and 30 Hz (a sampling rate of 128 Hz
means that frequencies above 25 Hz cannot be reli-
ably studied (Barlow, 1993)). All recordings are in
rest condition. The two databases were pooled for the
analysis, into a combined set of 29 early AD patients
and 22 Control subjects.
2.2 Signal Processing
2.2.1 Independent Component Analysis
ICA pre-processing of data was performed using
ICAlab ver 3.0, with the IWASOBI algorithm. Time-
frequencysparse modeling was performed using Mat-
lab r 7.0, and the ButIf toolbox (Vialatte et al.,
2009c). Three EEG researchers visually inspected
EEGs, and each recording’s least corrupted continu-
ous 20 sec interval were chosen for the analysis. Each
trial was then decomposed using ICA, and artifacts
(drifts, eye blinks, sharp waves, abnormal amplitude
sources) were removed independently using the pro-
cedure detailed in (Vialatte et al., 2009d).
2.2.2 Wavelets Time-frequency Representation
EEG signals were first transformed to a time-
frequency representation using complex Morlet
wavelets. Wavelets (see (Mallat, 1999; Percival and
Walden, 2000) for details), especially complex Mor-
let wavelets (Kronland-Martinet et al., 1988), have al-
ready been widely used for time-frequency analysis
of EEG signals (Tallon-Baudry et al., 1996; D¨uzel
et al., 2003; Caplan et al., 2001; Li et al., 2007;
Slobounov et al., 2008; Vialatte et al., 2008b; Vialatte
et al., 2009a). Complex Morlet wavelets ϑ of Gaus-
sian shape in time (deviation σ) are defined as:
ϑ(t) = A. exp
−t
2
2σ
2
. exp(2iπft), (1)
where σ and f are interdependent parameters, linked
with the constraint 2π ft > 5. The wavelet family de-
fined by 2π ft = 7, as described in (Tallon-Baudry
et al., 1996), is adapted to the investigation of EEG
signals. This wavelet has positive and negative val-
ues resembling those of an EEG, but also a symmet-
ric Gaussian shape both in the time and frequency
domains - i.e. this wavelet locates accurately time-
frequency oscillations both in the time and frequency
domain.
We scale complex Morlet wavelet ϑ to compute
time-frequency wavelet representations of the signal
X of length T:
C
x
(t, s) =
Z
T
X(τ)ϑ
∗
τ−t
s
dτ, (2)
where s, the scaling factor, controls the central fre-
quency f of the mother wavelet. The modulus of
this time-scale representation can therefore be used
BIOSIGNALS 2010 - International Conference on Bio-inspired Systems and Signal Processing
480
-30
30
0
1
2
0
Time (sec)
Amplitude (mV)
EEG signal
1
20
40
1
Frequencies (Hz)
Time (sec)
Wavelet transform Z-scored map
Sparse time-frequency
time position t
frequency position f
height h
width w
Half ellipsoid bump
amplitude A
(offset=1)
bump model
of the signal
(a)
(b)
(c)
(c)
(d)
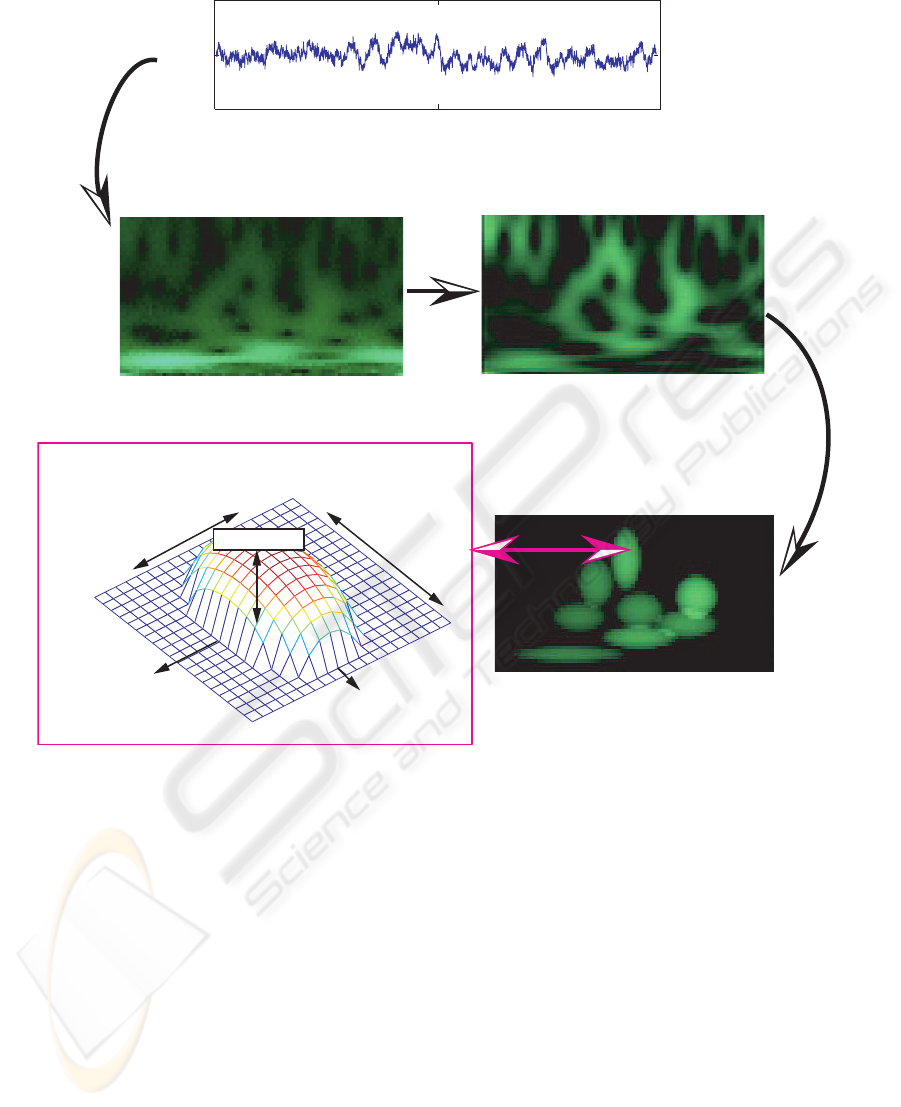
Figure 1: Principle of sparse time-frequency bump modeling.
as a positive time-frequency spectrogram, noted C
x
.
C
x
is a time-frequency matrix of dimension T × F,
where F scales are used to compute appropriate fre-
quency steps (usually linear or logarithmic, in the case
of bump modeling we use linear steps).
2.2.3 Bump Modeling
The bump modeling method is covered in detail in
(Vialatte et al., 2007; Vialatte et al., 2009c). The
principle is illustrated on Figure 1. The wavelet map
was computed from 4 to 25 Hz with 0.25 Hz steps,
and afterwards normalized using a z-score normaliza-
tion (see e.g. (Vialatte et al., 2008b)). We then mod-
eled the oscillatory patterns present in the normalized
time-frequency map:
E(A, h, w, f,t, y, x) =
W
∑
x=1
H
∑
y=1
kω
y,x
(s, τ) − ξk
2
, (3)
where the sums are computed over a set of windows,
ξ(A, h, w, f, t, y, x) are half-ellipsoid functions, y and x
are respectively the time and frequency position of the
adaptation window on the time-frequency map (fixed
parameters), f and t are respectively the time and fre-
quency position of the bump on the time-frequency
map, h and w are respectively the height and width
of the bump, A is the amplitude of the bump, and k.k
is a Frobenius norm. Adaptation is performed using
a combination of first and second order gradient de-
scent. The results presented here were obtained with
a pruning threshold F
t
= 0.30, and a z-score offset
φ = 0.
SPARSE BUMP MODELING OF MILDAD PATIENTS - Modeling Transient Oscillations in the EEG of Patients with
Mild Alzheimer's Disease
481

3 RESULTS
3.1 Statistical Analysis
We compared the statistics of EEG power before (us-
ing the waveletmap before and after z-score) and after
bump modeling (using the amplitude A of the bumps
in the frequency range), in three frequency ranges:
θ (4-8 Hz), α (8-12 Hz), and β (12-25 Hz). These
results are computed in relative power (the power in
each frequency range is divided by the total power).
First, we compared the general average over all elec-
trodes for each patient, and for each of the three fre-
quency ranges, using a Mann-Whitney test
1
(Table 1).
The difference of power between the control subjects
and the mildAD patients is increased after modeling
in the θ and β ranges, but slightly decreased in the α
range. The variability of EEG power did not differ
between mildAD or controls, wether for wavelets or
bumps (Levene test p >> 0.10). However, if we com-
pare the distributions before and after bump model-
ing, the intra-group variability (midlAD vs. mildAD,
and controls vs. controls) is significantly decreased in
the α and β ranges (Table 2).
Table 1: Difference between mildAD patients and Control
subjects, before and after the wavelet map is modeled with
bumps (relative power, all subjects from databases A and B
grouped). The p-value, Mann-Whitney z-score statistic, and
Bonferroni corrected p-values are displayed. All p-values
are highly significant (p < 0.01 after correction).
Frequency Wavelets Bumps
range (Hz) p-value p-value
(Z, corrected p) (Z, corrected p)
θ (4-8) 1.02· 10
−5
7.40· 10
−9
(-4.4, 6.12· 10
−5
) (-5.8, 4.44· 10
−8
)
α (8-12) 3.67· 10
−5
8.16· 10
−4
(4.1, 2.20· 10
−4
) (3.3, 4.90· 10
−3
)
β (12-25) 3.99· 10
−5
5.14· 10
−7
(4.1, 2.39· 10
−4
) (5.0, 3.08· 10
−6
)
3.2 Classification
Classification of the whole database was compared,
using either the amplitude on the wavelet map, or
from the bump modeling. We used a linear classi-
fier (linear discriminant analysis) in a leave-one-out
scheme (Stone, 1974). The relative power of all fre-
quency ranges, computed for each patient, was used
1
Wavelet coefficients are usually not distributed accord-
ing to a normal distribution, hence a non-parametric test has
to be used.
Table 2: Intra-group difference as measured by a Levene
test for homoscedasticity. The test measure variations of
the standard deviation before and after bump modeling (a
positive p-value indicates a decrease or an increase in the
intra-group difference). Here, all the significant p-values
are indicative of a decrease (mildAD patients became more
similar to other mildAD patients after bump modeling, and
likewise for control subjects). The p-values are indicated
before and after Bonferroni correction. * significant p-value
(p < 0.05 after correction); ** highly significant p-value
(p < 0.01 after correction).
Frequency Controls MildAD
range (Hz) p-value p-value
(corrected p) (corrected p)
θ (4-8) 0.0032 0.0065
(0.019*) (0.039*)
α (8-12) 0.0013 9.36· 10
−4
(0.0078**) (0.0056**)
β (12-25) 0.5343 0.5784
(1) (1)
Table 3: Classification results (leave-one-out validation),
per frequency range.
Frequency Wavelet Bumps
range (Hz) % validation error % validation error
θ (4-8) 25.49% 11.76%
α (8-12) 27.45% 31.37%
β (12-25) 25.49% 15.69%
global 25.49% 11.76%
8
1
0.2
0.4
0.6
0.
0.1
0.2
0.3
0.4
0.5
0
0.1
0.2
0.3
0.4
Time-frequency (wavelet) model
(8 missclassified)
θ
α
β
Figure 2: Linear classification using relative power of the
wavelet map (both databases A and B). Cross = control sub-
jects, Circle = mildAD patients. The line separates the two
classes, circled subjects are misclassified (8 missclassified
in total = 15.7%).
as an input feature. The learning error decreased from
15.7% for wavelets (illustrated on Figure 2), to 2.9%
for bump models (illustrated on Figure 3). The clas-
sification error decreased from 25.5% (wavelets) to
11.8% (bumps), this result being mostly due to the
improved separation of the θ range (see the Table 3).
BIOSIGNALS 2010 - International Conference on Bio-inspired Systems and Signal Processing
482

A better classification rate should be obtained with
optimized parameter combinations (using feature se-
lection) together with a more complex classifier; this
is however out of the scope of the present investiga-
tion.
0
0.2
0.4
0.6
0.8
1
0
0.5
1
0
0.1
0.2
0.3
0.4
0.5
0.6
θ
Sparse bump model
(2 missclassified)
α
β
Figure 3: Linear classification using relative power of the
sparse bump modeling (both databases A and B). Cross =
control subjects, Circle = mildAD patients. The line sep-
arates the two classes, circled subjects are misclassified (2
missclassified in total = 2.92%).
4 CONCLUSIONS
We observed that organized oscillatory events con-
tain stronger discriminative signatures of mildAD
than averaged spectral EEG statistics. Similarly to
our previous results on patients in the early stage of
Alzheimer’s disease, using another database of pa-
tients in MCI (mild cognitive impairment) stage vs.
Control subjects (Vialatte et al., 2008a), bump mod-
eling improved the separation between mildAD pa-
tients and control subjects, specifically in the θ and β
ranges. Furthermore, the intra-group variablity was
significantly reduced after bump modeling in the θ
and α ranges. Finally, this statistical improvement led
to a decreased error rate. We were thus able to con-
firm here our previous observations, using a different
database.
Background activity in EEG is mostly attributed
to cortical neural events (Barlow, 1993); on the other
hand, the oscillatory bursts, generated by locally syn-
chronous neural populations, could be related to inter-
area interactions, including sub-cortical areas. In-
deed, low-frequency synchrony is probably repre-
sentative of cortico-subcortical connectivity (Uhlhaas
and Singer, 2006). Subcortical damages are induced
in the early stage of Alzheimer’s disease, and have
been correlated with low-frequency power changes
(Helkala et al., 1996; Fern´andez et al., 2003). As a
conclusion, using bump modeling allowed us to clas-
sify the two groups specifically in the θ and β range.
We postulate that the observed strong increase of θ
range transient oscillatory activity could be a corre-
late of sub-cortical damages.
ACKNOWLEDGEMENTS
FBV thanks Prof. J. Jeong for having allowed
his visit to KAIST. JSC’s work has been supported
by the “Programa Jos´e Castillejo 2008” from Span-
ish Government under the grant JC2008-00389, and
by the University of Vic under de grant R0904.
EEG databases were collected within the Biopattern
project, in collaboration with the Plymouth Univer-
sity, UK.
REFERENCES
Bas¸ar, E. (1980). EEG-brain dynamics: Relation between
EEG and brain evoked potentials. Elsevier, Amster-
dam.
Barlow, J. (1993). The Electroencephalogram: Its Patterns
and Origins. MIT Press, Cambridge MA, USA.
Caplan, J., Madsen, J., Raghavachari, S., and Kahana, M.
(2001). Distinct patterns of brain oscillations under-
lie two basic parameters of human maze learning. J
Neurophysiol, 86(1):368–380.
D¨uzel, E., Habib, R., Schott, B., Schoenfeld, A., Lobaugh,
N., McIntosh, A. R., Scholz, M., and Heinze, H. J.
(2003). A multivariate, spatiotemporal analysis of
electromagnetic time-frequency data of recognition
memory. Neuroimage, 18:185–197.
Fern´andez, A., Arrazola, J., Maest´u, F., Amo, C., Gil-
Gregorio, P., Wienbruch, C., and Ortiz, T. (2003).
Correlations of hippocampal atrophy and focal low-
frequency magnetic activity in alzheimer disease: vol-
umetric mr imaging-magnetoencephalographic study.
AJNR Am J Neuroradiol, 24(3):481–487.
Helkala, E., H¨anninen, T., Hallikainen, M., K¨on¨onen, M.,
Laakso, M., Hartikainen, P., Soininen, H., Partanen,
J., Partanen, K., Vainio, P., and Riekkinen, P. S.
(1996). Slow-wave activity in the spectral analysis of
the electroencephalogram and volumes of hippocam-
pus in subgroups of alzheimer’s disease patients. Be-
hav Neurosci, 110(6):1235–1243.
Henderson, G., Ifeachor, E., Hudson, N., Goh, C., Out-
ram, N., Wimalaratna, S., Del Percio, C., and Vec-
chio, F. (2006). Development and assessment of meth-
ods for detecting dementia using the human electroen-
cephalogram. IEEE Transaction on Biomedical Engi-
neering, 53:1557–1568.
Jeong, J. (2004). Eeg dynamics in patients with alzheimers
disease. Clinical Neurophysiology, 115:1490–1505.
Klimesch, W., Sauseng, P., Hanslmayr, S., Gruber, W., and
Freunberger, R. (2007). Event-related phase reorgani-
SPARSE BUMP MODELING OF MILDAD PATIENTS - Modeling Transient Oscillations in the EEG of Patients with
Mild Alzheimer's Disease
483

zation may explain evoked neural dynamics. Neuro-
science and biobehavioral reviews, 31(7):1003–1016.
Kronland-Martinet, R., Morlet, J., and Grossmann, A.
(1988). Analysis of sound patterns through wavelet
transforms. International Journal on Pattern Recog-
nition and Artificial Intelligence, 1(2):273–301.
Li, X., Yao, X., Fox, J., and Jefferys, J. (2007). Interac-
tion dynamics of neuronal oscillations analysed using
wavelet transforms. Journal of Neuroscience Meth-
ods, 160(1):178–185.
Mallat, S. (1999). A wavelet tour of signal processing, 2nd
edition. Academic Press, New York.
Moratti, S., Clementz, B., Gao, Y., Ortiz, T., and Keil, A.
(2007). Neural mechanisms of evoked oscillations:
Stability and interaction with transient events. Human
Brain Mapping, 28(12):1318–1333.
Nikulin, V., Linkenkaer-Hansen, K., Nolte, G., Lemm,
S., M¨uller, K., Ilmoniemi, R., and Curio, G. (2007).
A novel mechanism for evoked responses in the
human brain. European Journal of Neuroscience,
25(10):3146–3154.
Percival, D. and Walden, A. (2000). Wavelet Methods for
Time Series Analysis. Cambridge University Press,
New York.
Quiroga, R., Sakowitz, O., Bas¸ar, E., and Sch¨urmann, M.
(2001). Wavelet transform in the analysis of the fre-
quency composition of evoked potentials. Brain Re-
search Protocols, 8:16–24.
Slobounov, S., Hallett, M., Cao, C., and Newell, K. (2008).
Modulation of cortical activity as a result of voluntary
postural sway direction: An eeg study. Neuroscience
Letters, 442(3):309–313.
Stone, M. (1974). Cross-validatory choice and assessment
of statistical predictions (with discussion). Journal of
the Royal Statistical Society B, 36:111–147.
Tallon-Baudry, C., Bertrand, O., Delpuech, C., and Pernier,
J. (1996). Stimulus specificity of phase-locked and
non-phase-locked 40 hz visual responses in human.
Journal of Neuroscience, 16:4240–4249.
Uhlhaas, P. and Singer, W. (2006). Neural synchrony in
brain disorders: relevance for cognitive dysfunctions
and pathophysiology. Neuron, 52:155–168.
Vialatte, F., Bakardjian, H., Prasad, R., and Cichocki, A.
(in press 2009a). Eeg paroxysmal gamma waves dur-
ing bhramari pranayama: A yoga breathing technique.
Consciousness and Cognition.
Vialatte, F., Dauwels, J., Maurice, M., Yamaguchi, Y., and
Cichocki, A. (2009b). On the synchrony of steady
state visual evoked potentials and oscillatory burst
events. Cognitive Neurodynamics, 3(3):251–261.
Vialatte, F., Martin, C., Dubois, R., Haddad, J., Quenet, B.,
Gervais, R., and G, D. (2007). A machine learning
approach to the analysis of time-frequency maps, and
its application to neural dynamics. Neural Networks,
20:194–209.
Vialatte, F., Maurice, M., and Cichocki, A. (2008a). Why
sparse bump models? In Proceedings of OHBM meet-
ing: June 15-19 2008, Melbourne, Australia - Neu-
roimage, 41(S1):S159.
Vialatte, F., Sol´e-Casals, J., and Cichocki, A. (2008b). Eeg
windowed statistical wavelet scoring for evaluation
and discrimination of muscular artifacts. Physiolog-
ical Measurements, 29(12):1435–1452.
Vialatte, F., Sol´e-Casals, J., Dauwels, J., Maurice, M., and
Cichocki, A. (2009c). Bump time-frequency tool-
box: a toolbox for time-frequency oscillatory bursts
extraction in electrophysiological signals. BMC Neu-
roscience, 10(46).
Vialatte, F. B., Sol´e-Casals, J., Maurice, M., Latchoumane,
C., Hudson, N., Wimalaratna, S., Jeong, J., and An-
drzej, C. (2009d). Improving the quality of eeg
data in patients with alzheimers disease using ica.
In Proceedings of t15th International Conference on
Neural Information Processing, ICONIP, Auckland,
New Zealand, November 25-28 2008 - LNCS, Part II,
5507:979-986.
BIOSIGNALS 2010 - International Conference on Bio-inspired Systems and Signal Processing
484
