
ICA CLEANING PROCEDURE FOR EEG SIGNALS ANALYSIS
Application to Alzheimer's Disease Detection
J. Solé-Casals
1
, F. Vialatte
2
, J. Pantel
3
, D. Prvulovic
3
, C. Haenschel
4
and A. Cichocki
2
1
Digital Technologies Group, University of Vic, Sagrada Família 7, 08500 Vic, Spain
2
RIKEN Brain Science Institute, LABSP, 2-1 Hirosawa, Saitama, 351-0106 Wako-Shi, Japan
3
Johann Wolfgang Goethe University, Heinrich-Hoffmann-Str. 10, 60528 Frankfurt, Germany
4
Bangor University, Bangor, U. K.
Keywords: EEG, Mild Cognitive Impairment, Alzheimer disease, ICA, BSS, Neural networks.
Abstract: To develop systems in order to detect Alzheimer’s disease we want to use EEG signals. Available database
is raw, so the first step must be to clean signals properly. We propose a new way of ICA cleaning on a
database recorded from patients with Alzheimer's disease (mildAD, early stage). Two researchers visually
inspected all the signals (EEG channels), and each recording's least corrupted (artefact-clean) continuous 20
sec interval were chosen for the analysis. Each trial was then decomposed using ICA. Sources were ordered
using a kurtosis measure, and the researchers cleared up to seven sources per trial corresponding to artefacts
(eye movements, EMG corruption, EKG, etc), using three criteria: (i) Isolated source on the scalp (only a
few electrodes contribute to the source), (ii) Abnormal wave shape (drifts, eye blinks, sharp waves, etc.),
(iii) Source of abnormally high amplitude (≥100 μV). We then evaluated the outcome of this cleaning by
means of the classification of patients using multilayer perceptron neural networks. Results are very
satisfactory and performance is increased from 50.9% to 73.1% correctly classified data using ICA cleaning
procedure.
1 INTRODUCTION
Alzheimer’s disease (AD) is the most prevalent form
of neuropathology leading to dementia; it affects
approximately 25 million people worldwide and is
expected to have a fast recrudescence in the near
future (Ferri et al., 2006). Numerous clinical
methods that are now available to detect this disease
include brain imaging (Alexander, 2002), (Deweer
et al., 1995), genetic studies (Tanzi and Bertram,
2001), and other physiological markers (Andreasen
et al., 2001).
However, these methods cannot be employed for
the mass screening of a large population. A
combination of psychological tests, such as Mini-
mental score evaluation (MMSE), with
electrophysiological analysis (e.g.
electroencephalogram or EEG), would be a more
efficient and inexpensive screening approach for
detecting elderly subjects affected by AD.
Independent component analysis (ICA) is a
method for recovering underlying signals from
linear mixtures of those signals. ICA draws upon
higher-order signal statistics to determine a set of
"components" which are maximally independent of
each other.
The aim of this paper is to apply ICA algorithms
as a pre-processing stage with EEG signals in order
to clean data. The evaluation of this cleaning
procedure was calculated in terms of classification
rate. Obtained results with clean data are much
better that those obtained with raw data, hence the
detection of Alzheimer's disease is simplified.
2 EXPERIMENTAL DATA
Experimental data comes from the Alzheimer
rehabilitation database, recorded at Klinik für
Psychiatrie, Psychosomatik und Psychotherapie der
Johann Wolfgang Goethe-Universität, Frankfurt,
Germany. A total number of 23 mild cognitive
impairment patients affected by Alzheimer’s disease
and followed clinically (labelled AD set) and a 31
485
Solé-Casals J., Vialatte F., Pantel J., Prvulovic D., Haenschel C. and Cichocki A. (2010).
ICA CLEANING PROCEDURE FOR EEG SIGNALS ANALYSIS - Application to Alzheimer’s Disease Detection.
In Proceedings of the Third International Conference on Bio-inspired Systems and Signal Processing, pages 485-490
DOI: 10.5220/0002755904850490
Copyright
c
SciTePress
age-matched controls (labelled Control set), where
recorded via a 62 channel scalp montage plus a
VEOG channel. This database was recorded in
normal routine. Reference electrodes were placed
between Fz and Cz, and between Cz and Pz. The
sampling frequency was 500 Hz.
3 ICA CLEANING PROCEDURE
3.1 Methodology
We apply EWASOBI (an Independent Component
Analysis algorithm) with Kurtosis criteria for
ordering independent components. The choice of
this algorithm is based on work (Solé-Casals et al.,
2008) where many different ICA algorithms are
investigated for EEG analysis. The detailed
description of the algorithm is neglected here; for
relevant references see (Cichocki and Amari, 2002).
The algorithm is implemented in MATLAB and
available for download from the original
contributors (Cichocki et al. WWW).
The estimated output signal y
t
is assumed to be
the source signals of interest up certain scaling and
permutation ambiguity. In addition, as we are only
interested in denoising or getting rid of specific
component, we can set that specific output signal
(say y
i
) to zero while keeping other components
intact, and apply back projection procedure to
recover the original scene. This is the key idea of our
proposed cleaning procedure that we detail below:
Two EEG researchers visually inspected EEGs,
and each recording's least corrupted (artefact-clean)
continuous 20 sec interval were chosen for the
analysis. Each trial was then decomposed using ICA.
Sources were ordered using a kurtosis measure, and
the researchers cleared up to 1/3 sources per trial
corresponding to artefacts (eye movements, EMG
corruption, EKG, etc), using three criteria:
1. Isolated source on the scalp (only a few
electrodes contribute to the source)
2. Abnormal wave shape (drifts, eye blinks,
sharp waves, etc.)
3. Source of abnormally high amplitude (≥100
μV)
Once artefactual sources have been eliminated,
remaining data are back-projected in order to
recover the original scene but now the electrodes
signals doesn't have the contribution of the
considered artefactual sources.
Absolute Fourier power is computed from 1 to
25 Hz in a resolution of 1Hz. Fourier data has been
grouped at different frequency bands, according to
the typically used division on Delta (2 to 4 Hz.),
Theta (4 to 8 Hz.), Alpha 1 (8 to 10 Hz.), Alpha 2
(10 to 12 Hz.) and Beta (12 to 25 Hz.) bands.
Finally, channels are also grouped in nine regions of
interest: prefrontal, left frontal, right frontal, left
temporal, central, right temporal, left parietal, right
parietal and occipital.
3.2 Graphical Examples
Some graphical examples of how ICA cleaning
procedure works are presented here.
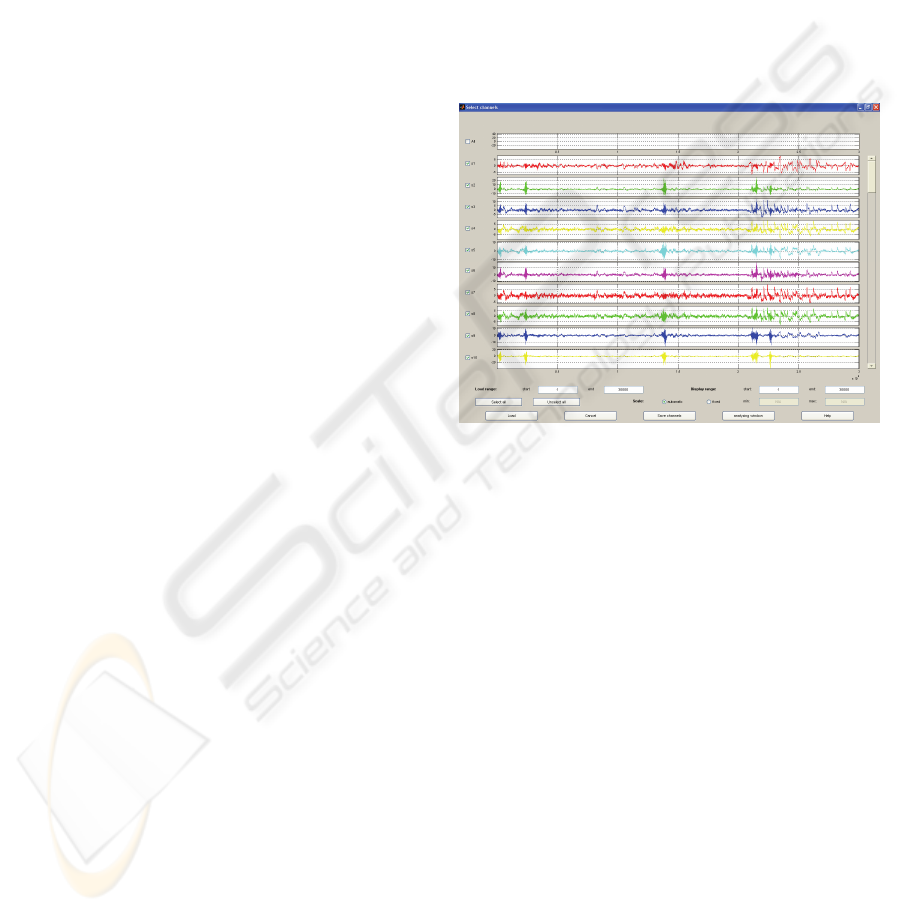
In Figure 1 we present a typical original EEG
data with artefacts.
Figure 1: Original EEG signals. Many artefacts can be
seen in several parts of the time courses.
Applying the detailed algorithm (Sec. 3.1), we can
easily eliminate artefact and noise contributions.
Figures 2 and 3 show some examples of the
considered criteria for detecting and eliminating
non-EEG sources.
4 CLASSIFICATION
4.1 Linear Discriminant Analysis
(LDA)
Linear Discriminant Analysis (LDA) is a well-
known scheme for feature extraction and dimension
reduction. It has been used widely in many
applications involving high-dimensional data, such
as face recognition and image retrieval. Classical
LDA projects the data onto a lower-dimensional
vector space such that the ratio of the between-class
distances to the within-class distance is maximized,
thus achieving maximum discrimination. The
optimal projection (transformation) can be readily
BIOSIGNALS 2010 - International Conference on Bio-inspired Systems and Signal Processing
486
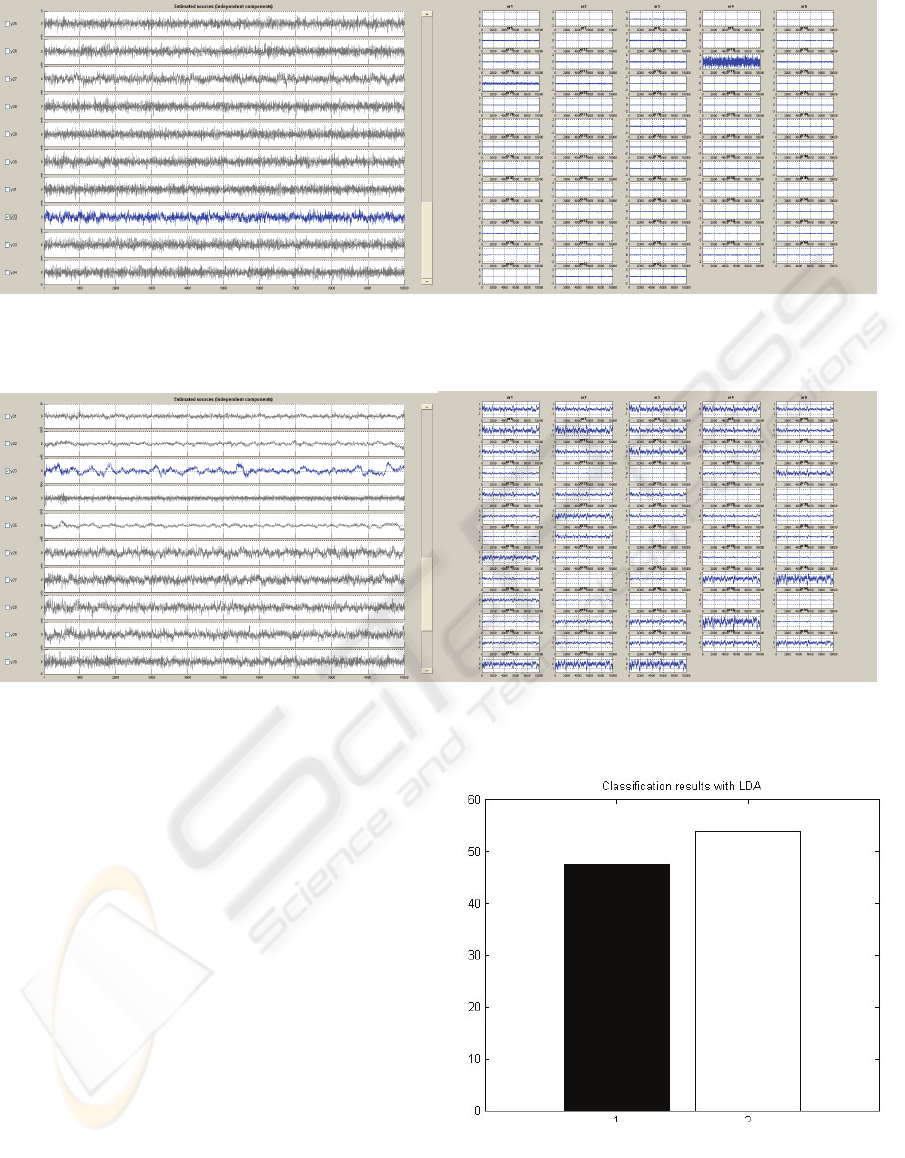
Figure 2: On the top a similar-like EEG signal (in blue); and on the down the back-projected signal to EEG sensors. In this
example, the signals came (almost) from the 14th electrode, so we decide to eliminate this independent component (case 1,
isolated source on the scalp).
Figure 3: On the top a clearly non EEG signal (in blue); and on the down the back-projected signal to EEG sensors. In this
case it is easy to decide that independent component labelled as y23 (the blue one on the left part of the figure) must be
eliminated (case 2, abnormal wave shape).
computed by applying the eigendecomposition on
the scatter matrices. See (Duda et al., 2000)
(Fukunaga, 1990) for details on the algorithm.
As a first experiment we use LDA in order to
classify between Alzheimer and Control patients,
using all the available frequency bands. As we don't
have a very huge database, a leave-one-out
procedure is used. In this leave-one-out cross-
validation scheme of N observations, N-1 are used
for training and the last is used for evaluation. This
process is repeated N times, leaving one different
observation for evaluation each time. The mean
success classification value in percentage (%) is
obtained as a final result.
As we are interested in testing the cleaning
procedure, we will compare results obtained with
raw data and with cleaned data. Of course, as our
classification problem is not linear, obtained results
will be poor, but in any case they can be used as a
lower bound.
Figure 4: Classification results obtained with LDA. Black
bar corresponds to raw data (47.37 % of classification
success) and white bar to clean data (53.85 % of
classification success).
RawClean
ICA CLEANING PROCEDURE FOR EEG SIGNALS ANALYSIS - Application to Alzheimer's Disease Detection
487
In figure 4 we present the % of classification
success obtained with LDA, for raw data (black bar)
and clean data (white bar), using all 5 frequency
bands as features (see section 3.1).
Even if results are not sufficiently good, cleaning
procedure improves the results in 6.48 %, from
47.37 % to 53.85 %.
4.2 Neural Network
In recent years several classification systems have
been implemented using different techniques, such
as Neural Networks.
The widely used Neural Networks techniques are
very well known in pattern recognition applications.
An artificial neural network (ANN) is a
mathematical model that tries to simulate the
structure and/or functional aspects of biological
neural networks. It consists of an interconnected
group of artificial neurons and processes information
using a connectionist approach to computation. In
most cases an ANN is an adaptive system that
changes its structure based on external or internal
information that flows through the network during
the learning phase.
Neural networks are non-linear statistical data
modelling tools. They can be used to model complex
relationships between inputs and outputs or to find
patterns in data.
One of the simplest ANN is the so called
perceptron that consist of a simple layer that
establishes its correspondence with a rule of
discrimination between classes based on the linear
discriminator. However, it is possible to define
discriminations for non-linearly separable classes
using multilayer perceptrons (MLP).
The Multilayer Perceptron (Multilayer Perceptron,
MLP), also known as Backpropagation Net (BPN) is
one of the best known and used artificial neural
network model as pattern classifiers and functions
approximators (Lippman, 1987), (Freeman and
Skapura, 1991). It belongs to the so-called
feedforward networks class, and its topology is
composed by different fully interconnected layers of
neurons, where the information always flows from
the input layer, whose only role is to send input data
to the rest of the network, toward the output layer,
crossing all the existing layers (called hidden layers)
between the input and output. Essentially the inner
layers are responsible for carrying out information
processing, extracting features of the input data.
Although there are many variants, usually each
neuron in one layer has directed connections to the
neurons of the subsequent layer but there is no
connection or interaction between neurons on the
same layer. (Bishop, 1995) (Hush and Horne, 1993).
In this work we have used a multilayer perceptron
with one hidden layer of several different neurons
(nodes), obtained empirically in each case. Each
neuron is associated with weights and biases. These
weights and biases are set to each connections of the
network and are obtained from training in order to
make their values suitable for the classification task
between the different classes.
The number of input neurons is equal to the
number of frequency bands considered, and the
number of output neurons is just one as we needs to
discriminate between only two classes (binary
problem).
As showed before, LDA with cleaned data
obtains better results, with an improvement of 6.48
%. But for classification purposes, these results are
poor and are not useful at all. Hence, we will
conduct some experiments with neural networks,
particularly with multi-layer perceptrons as a
classification system. As now we have a non-linear
classifier we expect to increase the percentage of
classification success.
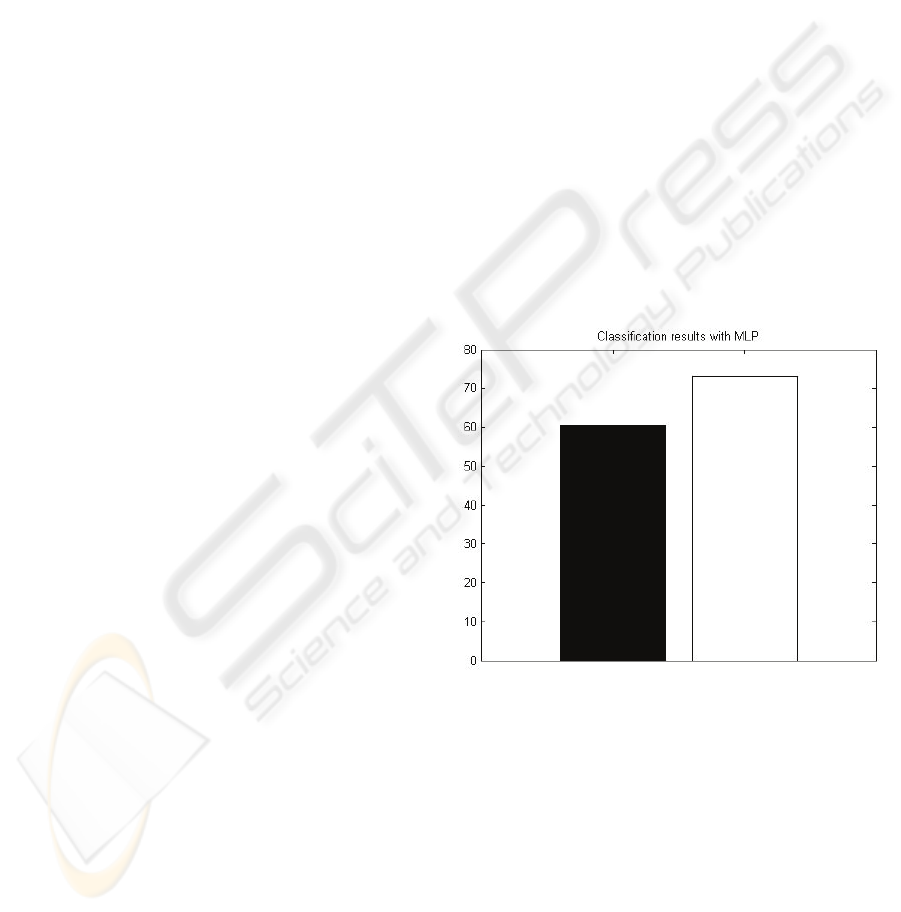
Figure 5: Classification results obtained with MLP. Black
bar corresponds to raw data (60.38 % of classification
success) and white bar to clean data (73.08 % of
classification success).
All the experiments are done with a MLP with
one hidden layer of 50 units with a logistic nonlinear
function and trained with a scaled conjugate gradient
(SCG) algorithm (Moller, 1993) to find a local
minimum of the function error function. Using SCG
algorithm we avoid the linear search per learning
iteration by using Levenberg-Marquardt way of
RawClean
BIOSIGNALS 2010 - International Conference on Bio-inspired Systems and Signal Processing
488
scaling the step size, and hence the computational
time is reduced.
As done in LDA case, leave-one-out cross-
validation scheme is used and the mean success
classification value in percentage (%) is obtained as
a final result.
In figure 5 we present the results obtained, as in
the LDA case, using all 5 frequency bands available
as input features. As expected, results are much
better, and also the classification success is
increased using cleaned data (%) instead of raw data
(%). The difference between clean and raw data is
now of 12.70 %, higher than this obtained in LDA
case.
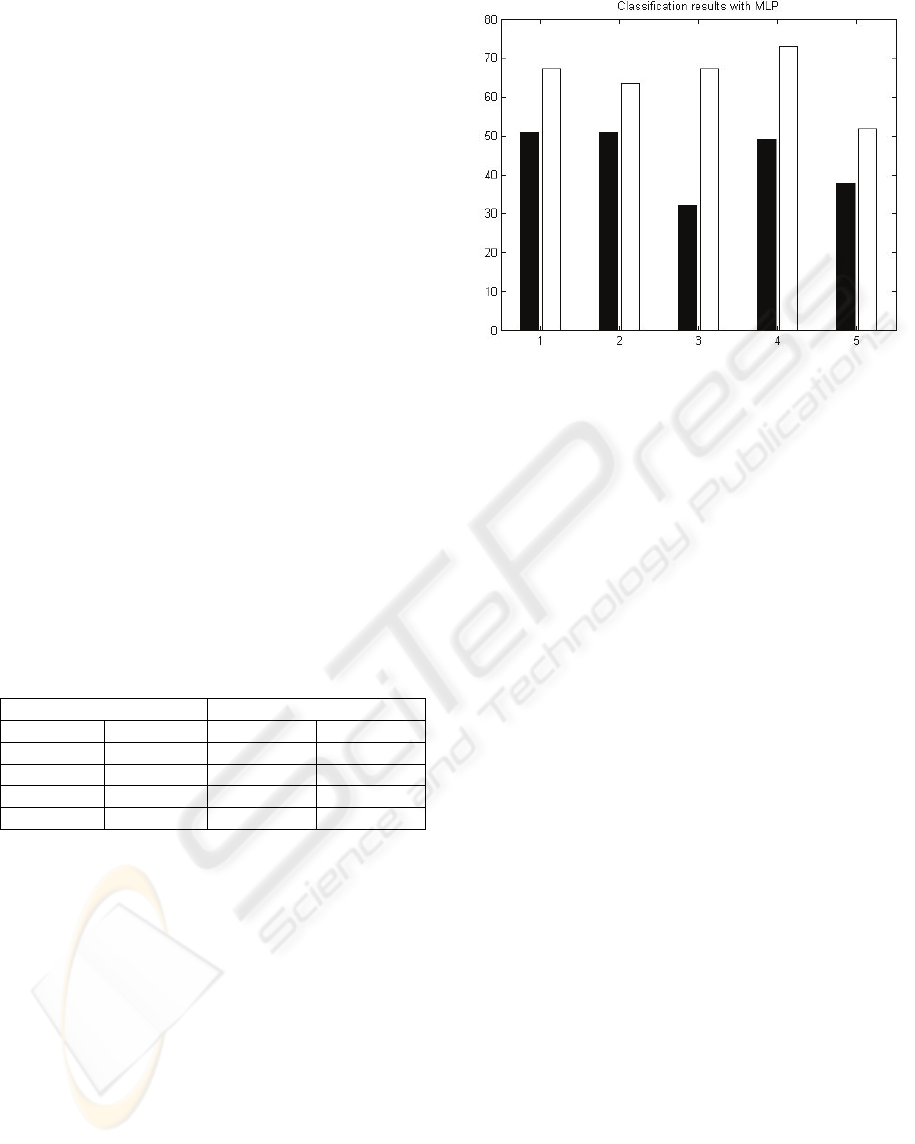
In order to investigate which frequency band is
more useful for classification purposes, we perform
experiments with MLP and leave-one-out cross-
validation scheme, using only one frequency band at
each time. Numerical values are presented in table 1
and graphical results are shown in figure 6.
In all the frequency bands, cleaned data obtains
better results than raw data, with a minimum
increase of about 13%. Best case of classification
rate for cleaned data is obtained for Alpha2 band (10
to 12 Hz.), with a value of 73.08 %, the same value
obtained if we use all the frequency bands as input
features.
Table 1: Classification results obtained for each frequency
band as input feature.
Raw data Clean data
Delta 50.94 % Delta 67.31 %
Theta 50.94 % Theta 63.46 %
Alpha 1 32.07 % Alpha 1 67.31 %
Alpha 2 49.06 % Alpha 2 73.08 %
Beta 37.73 % Beta 51.92 %
5 CONCLUSIONS
In this paper we have presented a new procedure for
cleaning EEG signals based in ICA algorithm. The
main idea is to eliminate independent components
that clearly are not plausible as EEG signals
(abnormal shape; abnormal amplitude; isolated
source on the scalp). Key point is the kurtosis
ordering of the independent components that helps
in detecting these non-EEG components. A back-
projection is done in order to retrieve the cleaned
signals and mean value of Fourier power is
performed with the results obtained by two different
researchers.
Figure 6: Classification results obtained with MLP. Each
group corresponds to an experiment with only one
frequency band, labelled as 1 to 5 in the same order as
detailed in section 3.1. Black bar corresponds to raw data
and white bar to clean data.
Performance of the procedure is demonstrated by
classifying EEG signals from Alzheimer patients
versus control patients. Both LDA and MLP
classification systems are investigated and cleaned
data obtains always better results. Using all the
frequency bands as input data, we improve results
from 60.38% to 73.08%. Using only one frequency
band, a 73.08 % of classification success (best
cased) is obtained with Alpha2 band (10 to 12 Hz.),
against 50.94 % of classification success obtained
with raw data in the best case (Delta and Theta
bands).
ACKNOWLEDGEMENTS
This work has been supported by “Programa José
Castillejo 2008” from Spanish Government under
the grant JC2008-00389, and by the University of
Vic under de grant R0904.
REFERENCES
Ferri, C. P., Prince, M., Brayne, C., and et al., H. B.
(2006). Global prevalence of dementia: a delphi
consensus study. In The Lancet, vol. 366, pp. 2112-
2117.
Alexander, G. E. (2002). Longitudinal pet evaluation of
cerebral metabolic decline in dementia: A potential
outcome measure in alzheimer’s disease treatment
studies. In American Journal of Psychiatry, vol. 159,
pp. 738-745.
ICA CLEANING PROCEDURE FOR EEG SIGNALS ANALYSIS - Application to Alzheimer's Disease Detection
489

Deweer, B., Lehericy, S., Pillon, B., Baulac, M., and et al.
(1995). Memory disorders in probable alzheimer’s
disease: the role of hippocampal atrophy as shown
with mri. In British Medical Journal, vol. 58, p. 590.
Tanzi, R. E. and Bertram, L. (2001). New frontiers in
Alzheimer’s disease genetics. In Neuron, vol. 32, pp.
181-184.
Andreasen, N., Minthon, L., Davidsson, P., Vanmechelen,
E., and et al. (2001). Evaluation of csf-tau and csf-a?2
as diagnostic markers for alzheimer disease in clinical
practice. In Am Med Assoc, vol. 58, pp. 373-379.
Solé-Casals, J., Vialatte, F., and Cichocki, Z. C. A. (2008).
Investigation of ICA algorithms for feature extraction of
EEG signals in discrimination of Alzheimer disease.
In Proc. International Conference on Bio-Inspired
Systems and Signal Processing, Biosignals, pp. 232–
235.
Cichocki, A. and Amari, S. (2002). Adaptive Blind Signal
and Image Processing. Wiley, New York.
Cichocki, A., Amari, S. et al. (WWW). Icalab toolboxes.
http://www.bsp.brain.riken.jp/ICALAB.Duda, R.O.,
Hart, P.E. and Stork, D., 2000 Pattern Classification.
Wiley.
Fukunaga, K., 1990 Introduction to Statistical Pattern
Classification. Academic Press, San Diego, California,
USA.
Lippmann, D.E. (1987). “An Introduction to Computing
with Neural Networks”. IEEE ASSP Magazine, 3(4),
pp. 4-22
Freeman, J.A. and Skapura, D.M., 1991 Neural Networks:
Algorithms, Applications and Programming
Techniques. Addison-Wesley Publishing Company,
Inc. Reading, MA.
Bishop, C.M., 1995. Neural Networks for Pattern
Recognition, Oxford University Press.
Hush, D.R., Horne, B.G., 1993. Progress in supervised
neural networks”, IEEE Signal Processing Magazine,
10 (1), pp. 8-39.
Moller, M.F. (1993). A Scaled Conjugate Gradient
Algorithm for Fast Supervised Learning. Neural
Networks, Vol. 6, pp.523-533
BIOSIGNALS 2010 - International Conference on Bio-inspired Systems and Signal Processing
490
