
MEASURING THE REFRACTIVE INDEX OF OOCYTES BY
MEANS OF AN OPTICAL MICROSYSTEM
A Non Invasive Technique to Estimate the Evolution of Oocytes Maturity
Ioana R. Ivascu
Physics Department I, Applied Sciences Faculty, Bucarest “Politehnica” University
Splaiul Independentei, Bucuresti, 060042, Romania
Rabah Zeggari, Christian Pieralli, Bruno Wacogne
Institut FEMTO-ST, UMR CNRS 6174, Département d'Optique P. M. Duffieux, Faculté des Sciences et des Techniques
Route de Gray, 25030 Besançon Cedex, France
Christophe Roux
Service de Génétique Histologie Biologie du Développement et de la Reproduction
UMR645 – Interactions Hôte-Greffon et Ingénierie Cellulaire et Génique & IFR 133: IBCT, CHU St. Jacques
Université de Franche-Comté, 25030 Besançon, France
Keywords: In Vitro Fertilization, Maturation estimation, Optical microsystems, Refractive index measurement.
Abstract: In this paper, we present an optical microsystem used to measure the refractive index of oocytes. The
technique relies on oocytes refraction properties and on the optical coupling between optical fibers. A
theoretical model of the system is established by means of matrix optics. A numerical fitting allows
calculating the refractive index of the oocytes. In a first time we considered the oocytes like homogeneous
spheres. In a second time, we considered that the oocytes consist of a shell (the zona pellucida) and a core
(the cell). Experimental results showed that the refractive index of the oocytes increases during the
maturation process. In this position paper, we also discuss the temporal evolution of the oocytes maturity
and we point out that the maturation should not only be estimated visually but in a more continuous manner.
The device we propose could be a solution for such non invasive measurements.
1 INTRODUCTION
The ability of an oocyte to be fertilized and to
initiate an embryo development strongly depends on
its quality and maturity degree. Usually, the
maturation of an oocyte is estimated visually, by
direct observation with a microscope. The goal is to
observe the presence or the absence of particular
morphological features. The effectiveness of this
visual inspection is therefore highly biologist
dependent. Consequently, there is a crucial need for
more objective technique, and hopefully, more
effective methods.
Since the beginning of IVF (in vitro
fertilization), a few technological developments
have been investigated. They mainly concern the
preparation, the conditioning and the conservation of
gametes, as well as culture of the oocytes and
embryos (Suh, 2003). Some publications report
innovations in the technological domain. Some of
them concern the preparation, the conditioning and
the manipulation of the oocytes in micro-fluidic
systems (Beebe, 2002, Zeringue, 2001, Gauthier,
2002, Sadani, 2005, Zeggari, 2007, Kricka, 1997).
Other techniques are developed to estimate the
maturity of the semen (Danielli, 1952). The oocytes
maturity has also been investigated by means of
mechanical measurements. In this case they were
mainly conducted on animal oocytes (Ohtsubo,
1985, Sawai, 1974, Nakamura, 1978, Murayama,
2004). It must be noted that, to our knowledge, only
one conference (Inui, 2006) and one paper
(Wacogne, 2008) reports experiment on human
127
R. Ivascu I., Zeggari R., Pieralli C., Wacogne B. and Roux C. (2010).
MEASURING THE REFRACTIVE INDEX OF OOCYTES BY MEANS OF AN OPTICAL MICROSYSTEM - A Non Invasive Technique to Estimate the
Evolution of Oocytes Maturity.
In Proceedings of the Third International Conference on Biomedical Electronics and Devices, pages 127-132
DOI: 10.5220/0002756201270132
Copyright
c
SciTePress
oocytes. The invasive or non invasive aspect of the
techniques is probably an important issue.
Concerning non invasive techniques, optical
methods offer potential alternatives. They have been
tested on living cells (Shaked, 2009, Marquet, 2005)
or on oocytes (Zeggari, 2007, Pieralli, 2009). In this
paper, we present a simple micro-system used to
measure the refractive index of the oocytes. It is
based on work we have presented some time ago
(Zeggari, 2006). In this reference, we showed that
oocytes can optically act as microlens. Therefore, if
an oocyte is used as a coupling element between
optical fibers, it is possible to compute its refractive
index by analyzing the optical coupling. However, in
this feasibility study, refractive index measurement
was only demonstrated with one oocyte.
Furthermore, no particular attention had been paid
on the coupling modeling. Recently, we set up a
more realistic model for the optical properties of the
oocytes and we computed refractive indices of a
larger number of oocytes. This is the subject of this
paper. Refractive indices are measured for 3 oocytes
maturation stages: VG (Germinal Vesicle), MI
(Metaphase I) and MII (Metaphase II). We show that
the refractive index evolves with the maturation of
the oocyte.
The micro-system as well as the experimental
protocol is presented in the next section of this
paper. Experimental results are the subject of section
3 while section 4 deals with a discussion we would
like to propose concerning the temporal aspect of the
oocyte maturation process. Then a conclusion will
be drawn in the last section of this article.
2 OPTICAL MICROSYSTEM AND
EXPERIMENTAL PROTOCOL
2.1 Experimental Set-up
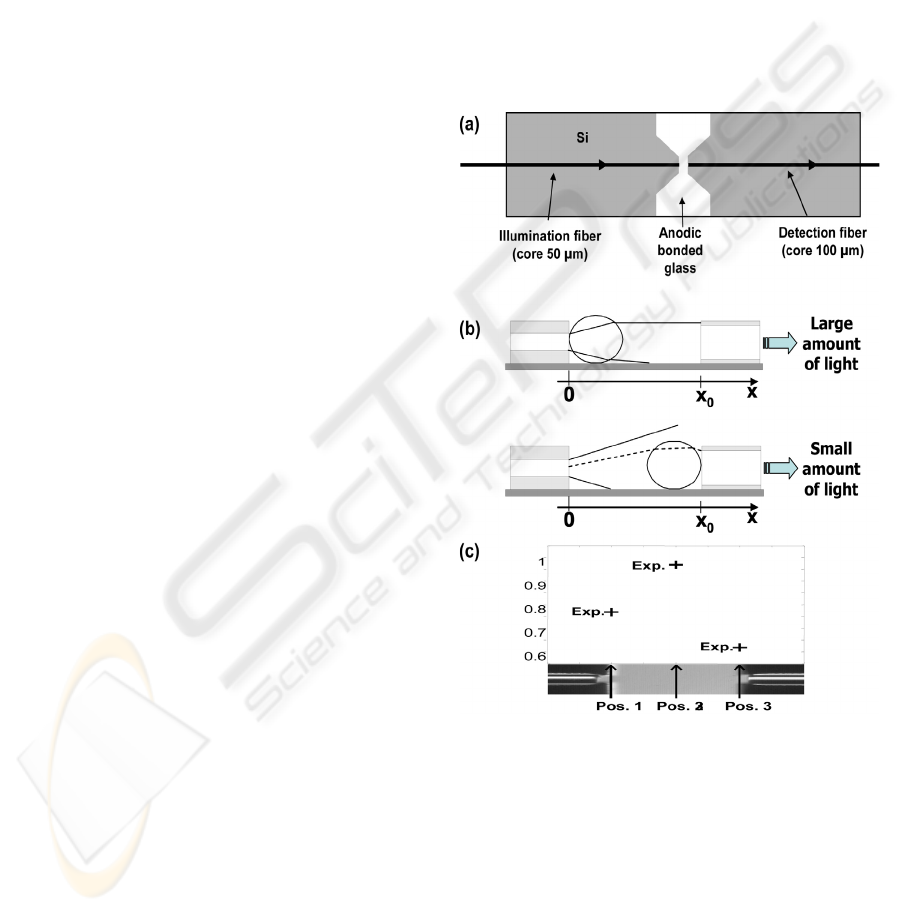
A schematic diagram of the device is shown in
figure 1(a). It consists of a Deep Reactive Ion
Etched micro-machined piece of silicon anodic
bonded onto a glass substrate. The main features are
two U-grooves into which optical fibers are glued. In
this way, optical fibers are perfectly aligned. A
specific pigtailing arrangement was designed in
order to precisely adjust the distance between the
two fibers (500 µm). Fibers were conventional 125
µm diameter fibers. The core of one fiber is 50 µm
in diameter. It is the illumination fiber. The core of
the second fiber (the collection one) is 100 µm in
diameter.
The principle is to bring the oocyte between the
two optical fibers by means of the holding micro-
pipette commonly used in the conventional IVF
micro-manipulators. The idea is to analyse the
optical intensity collected for different positions of
the oocyte between the fibers. Figure 1(b) helps
understanding the principle of measurement. When
the cell is positioned close to the illumination fiber,
a large amount of light is collected due to the
refractive index of the cell that plays the role of a
microlens. Conversely, when the cell is positioned
close to the collection fiber, the amount of collected
light is much lower. The maximum of collected light
is obtained for a position between the two fibers.
Figure 1: Experimental set-up and principle of the
technique. (a) Schematic diagram of the device. (b)
Illustration of the coupling efficiency as a function of the
oocyte position. (c) Example of measurement.
2.2 Measurement Method
The method we used consists in measuring the
intensity for 3 positions of the cell: in contact with
the illumination fiber, right in the middle of the
fibers and in contact with the collection fiber. In this
way, 3 experimental points are obtained as it is
shown in figure 1(c). A computing model is then
BIODEVICES 2010 - International Conference on Biomedical Electronics and Devices
128
employed in order to fit theoretical data with
experimental points. We first consider that the
collected intensity strongly depends on the refractive
index of the oocyte and weakly on its absorption.
Indeed, absorption of the oocytes was estimated
by means of image processing performed on pictures
usually taken in the Besançon's IVF center
(comparison of the average grey level of the oocyte
and the grey level of the background). We found that
the absorption is about 6%.
From there, a Matlab programme is used to
compute the intensity collected as a function of the
refractive index and for the 3 above mentioned
positions of the oocyte. Iteration by iteration, a value
of the refractive index "n" is found when the average
distance between the experimental points and the
computed ones is minimum (least mean square
criterion).
2.3 Oocytes Preparation
Oocytes used in this study were excluded from
Assisted Reproductive Technology (ART) programs.
Their use has been approved by the clinical ethic
committee of the Besançon University Hospital the
5
th
of May 2004.
Oocytes are collected during attempts of ART
(by means of ICSI - Intracytoplasmic Sperm
Injection) or from follicular reduction. The complex
cumulus-oocyte are individualized under a binocular
microscope and transferred into a culture medium.
After 90 to 120 min of in vitro culture at 37 °C, the
cumulus is removed. This lead to a perfect
visualization of the oocytes under a microscope and
allows determining their maturity degree. Oocytes
are individually transferred into plastic boxes with
100 µl of culture medium. Their maturity degree is
defined by visual inspection with an inverted
microscope.
200 µl of IVF culture medium is deposited
between the two fibers of the device. One oocyte is
collected in the plastic box in 20 µl of IVF medium
and positioned against the emission fiber. The
holding micro-pipette is employed in order to
precisely position the oocyte. Collected intensity is
recorded and the oocyte is moved to the middle of
the two fibers where the second measurement is
made. Then, the oocyte is positioned against the
collection fiber for the last measurement.
Once the measurements are made, the oocytes
are replaced in the IVF medium in the plastic box.
Then, they are incubated in a Sanyo CO
2
incubator
(35 °C, 5% CO
2
). Their possible evolution (in terms
of maturity) is controlled 4 and 17 hours after the
first maturity evaluation with the microscope. If the
maturation stage of the oocytes has evolved, another
refractive index is measured.
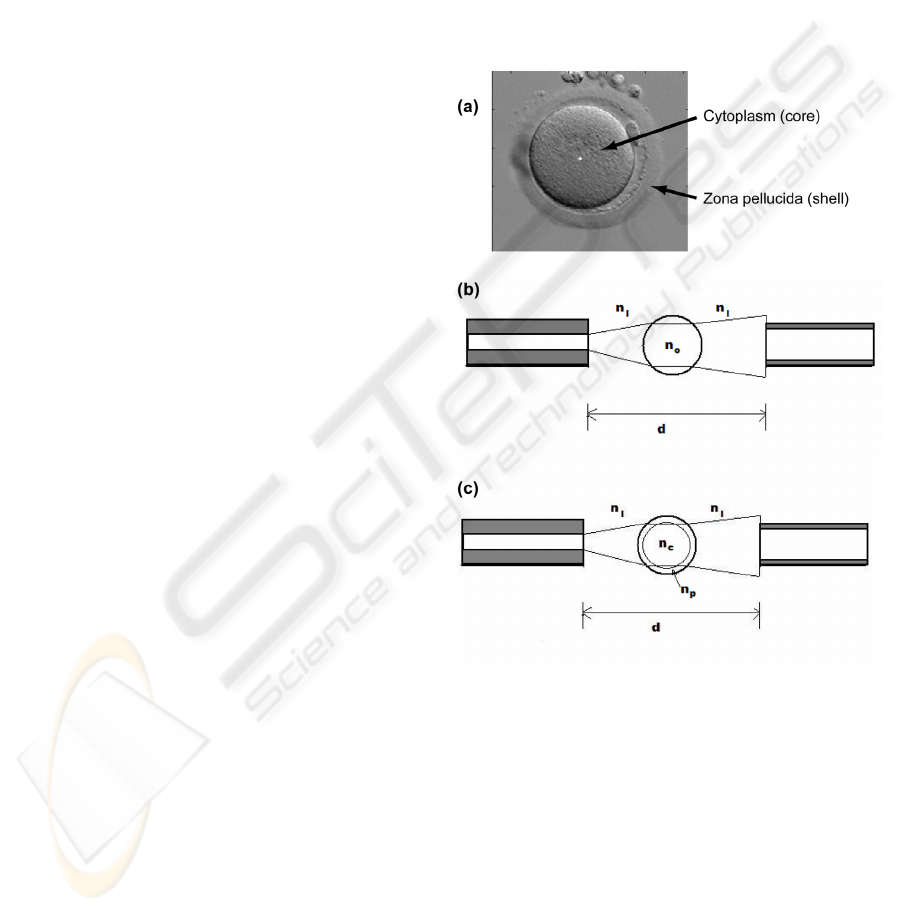
2.4 Theoretical Models
As previously mentioned, a theoretical model of the
oocytes was defined in order to simulate their optical
properties. This model relies on the use of matrix
optics. Figure 2(a) shows a picture of an oocyte.
Two main features are visible: the cytoplasm and the
zona pellucida.
Figure 2: Description of the theoretical model used in this
study. (a) The two main features of the oocyte (zona
pellucida and cytoplasm). (b) Homogeneous model. (c)
Core-shell model.
In a first time, we simply considered the oocyte
as a homogeneous sphere whose refractive index is
n
0
(figure 2(b)). The center of the oocyte coincides
with the optical axis of the fibers. The refractive
index of the culture medium is n
1
. In a second time,
we constructed a more complex model where we
accounted for the "core-shell" structure of the oocyte
(figure 2(c)). Here, the refractive indices of the
cytoplasm and the zona pellucida are n
c
and n
p
respectively.
MEASURING THE REFRACTIVE INDEX OF OOCYTES BY MEANS OF AN OPTICAL MICROSYSTEM - A Non
Invasive Technique to Estimate the Evolution of Oocytes Maturity
129
3 EXPERIMENTAL RESULTS
Experiments were conducted with 30 oocytes. They
belong to 3 maturity classes: VG (10 oocytes), MI
(10 oocytes) and MII (10 oocytes). All of them were
collected at the VG maturation stage. After about 5
hours of incubation they evolved to the MI stage.
About 15 hours later, they became MII. Refractive
index measurements were made at each maturity
degree.
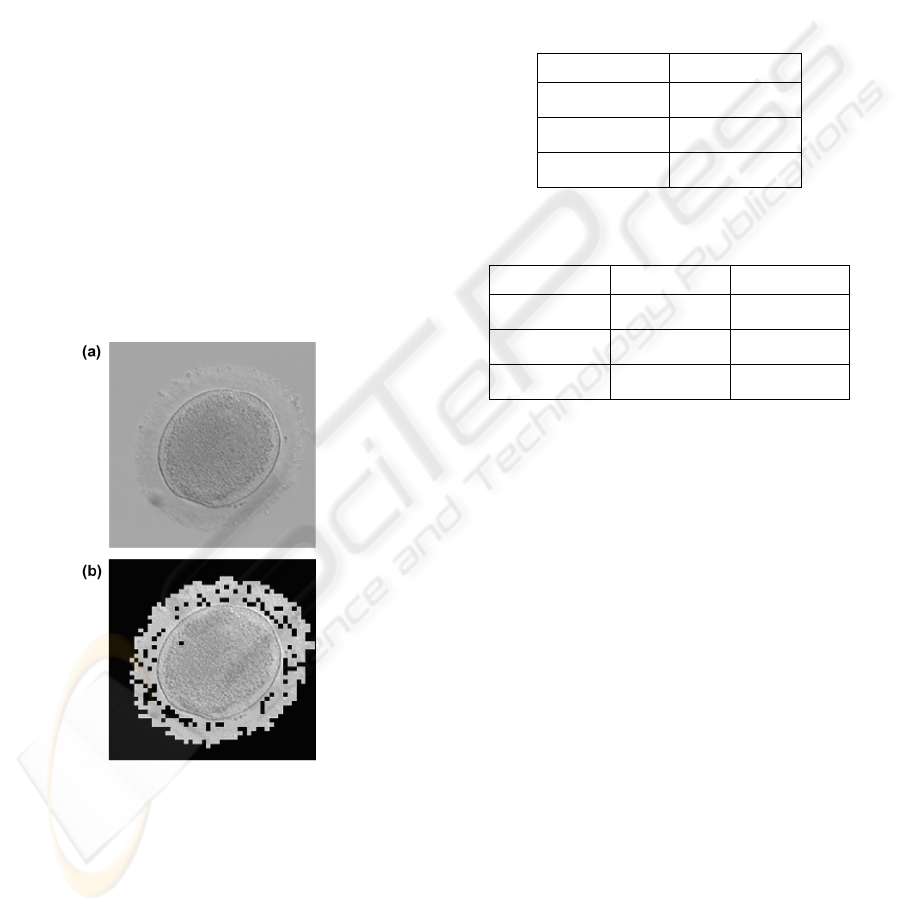
3.1 Preliminary Experiments
As previously stated, the absorption of the oocytes
was estimated by means of image processing. This is
described in figure 3. Figure 3(a) shows an oocyte.
The idea is to separate the part of the image
corresponding to the oocyte from the background.
To this end, a semi automatic thresholding is used.
The result is shown on figure 3(b). Once the oocyte
is isolated, the absorption is obtained by dividing the
average grey level of the oocyte by the average grey
level of the background. In our case, the average
absorption of the oocytes was 6%.
Figure 3: Image processing used to estimate the absorption
of the oocytes. (a) The initial image. (b) Result of the
image processing when the oocyte is isolated.
The second preliminary experiment concerned
the refractive index of the culture medium n
1
. To
measure it, we recorded the collected intensity
before and after the culture medium is deposited
between the fibers. Ray tracing is used to compute
the refractive index of the medium. In our case we
found n
1
=1.868.
3.2 Experimental Results
Two type of measurements were considered. In a
first time, we calculated the average refractive
indices in each maturity class. We did it with both
theoretical models. Results concerning the
homogeneous model are summarized in table 1
while those concerning the core-shell model are
presented in table 2.
Table 1: Average refractive index of the oocyte for the 3
maturation stages. Homogeneous model.
Stage Average n
0
VG 1.68
±0.03
M I 1.76
±0.04
M II 1.79
±0.03
Table 2: Average refractive index of the oocyte for the 3
maturation stages. Core-shell model.
Stage Average n
c
Avergae n
p
VG 1.79
±0.05
2.18
±0.02
M I 1.86
±0.06
2.10
±0.02
M II 1.88
±0.05
2.21
±0.02
In both cases, we observe that the refractive
index increases with the maturity degree of the
oocytes. In the case of the core-shell model, it seems
that the refractive index of the cytoplasm increases
while nothing can really be said about the refractive
index of the zona pellucida. Also, if we consider the
values of the standard deviations we can say that,
although the 3 maturation stages can be
individualized, it seems impossible to use this
optical technique to qualify the maturity of an
unknown oocyte.
However, is this result surprising? Indeed,
concerning the maturity degree of the oocytes, we
are analyzing cells that continuously evolve between
consecutive stages. Therefore, should we look for a
discrete separation between the optical properties of
the different stages? We would like to propose a
discussion on this aspect in part 4 of this paper.
We therefore considered the temporal evolution
of the refractive indices for each individual oocyte.
Results are presented in table 3 and 4. Table 3 shows
the results for the refractive index of the cytoplasm
while table 4 shows the result for the zona pellucida.
Here, we note that the general tendency is an
increase of the cytoplasm refractive index (except
for oocytes #6 and #9). Again, the case of the zona
BIODEVICES 2010 - International Conference on Biomedical Electronics and Devices
130

pellucida is no very clear. It should also be noted
that in some cases, the theoretical model did not
produce coherent values. This aspect is not yet
understood.
Table 3: Temporal evolution of the refractive index of the
cytoplasm.
N
c
at VG
N
c
at MI
N
c
at MII
oocyte #1 1.78 1.79 1.91
oocyte #2 1.83 1.93 -
oocyte #3 1.74 1.84 1.89
oocyte #4 1.745 1.85 1.89
oocyte #5 1.70 1.84 1.86
oocyte #6 1.84 1.79 1.79
oocyte #7 1.78 1.85 1.88
oocyte #8 1.83 1.84 1.87
oocyte #9 1.86 1.85 -
oocyte #10 1.88 1.915 1.924
Table 4: Temporal evolution of the refractive index of the
zona pellucida.
n
p
at VG n
p
at MI n
p
at MII
oocyte #1
1.95 1.81 2.26
oocyte #2
2.36 2.47 -
oocyte #3
1.99 2.03 2.4
oocyte #4
1.93 2.02 2.29
oocyte #5
1.82 2.20 2.13
oocyte #6
2.45 2.14 1.89
oocyte #7
1.94 2.07 2.24
oocyte #8
2.28 2.24 2.21
oocyte #9
2.42 2.22 -
oocyte #10
2.47 2.24 2.32
4 DISCUSSION
In this section, we would like to put to profit the fact
that this is a position paper. As it is mentioned
above, the 3 maturity classes are easily identified.
But it seems difficult to use the refractive index to
precisely define the maturation stage of an oocyte.
We think that this result is not very surprising
because the oocytes are subject to a continuous
maturation process from VG to MII. Therefore, it is
not likely that the refractive indices discretely differ
from one class to another one. In order illustrate this
let us remember that usually we see seven colors in
the rainbow. Apparently, the white light spectrum,
when visually observed, exhibits seven different
color classes. However, when a spectrogram is
recorded, the seven color classes cannot be
distinguished anymore. Probably, the qualification
of oocytes in 3 classes, visually identified by various
morphological characteristics, could be improved by
analyzing some of the oocytes optical properties on
a more continuous manner. The measurement of the
refractive indices may offer an answer to this
question.
The above mentioned remarks are obviously
opened to further discussions. But we think that the
oocytes should be chosen when they are not only
MII but also at the right moment when they are MII.
We believe that the use of new qualifying techniques
that allow taking into account the temporal evolution
of the oocytes would be profitable to IVF
techniques. At present, the device we present in this
paper should still be improved before it can be used
on a routine basis. However, an alternative technique
we presented recently (Pieralli, 2009) and based on
image processing could be envisaged.
5 CONCLUSIONS
In this paper we have presented a simple optical
micro-system used for measuring the refractive
index of oocytes. The device consists of a Deep
Reactive Ion Etched piece of silicon anodic bonded
onto a glass substrate. Two perfectly aligned
multimode optical fibers are attached to the device.
The oocyte is positioned between the two fibers by
means of the holding micro-pipette usually
employed in IVF centers. White light is launched
into one optical fiber and illuminates the oocyte
under test. Once the light has propagated through the
oocyte, it is collected by the second optical fiber and
the optical intensity is recorded. The collected light
is measured for 3 positions of the oocyte between
the fibers. In this way, and using a mathematical
fitting, refractive indices of the oocytes can be
measured.
Two theoretical models were developed. In one
case, the oocyte was considered as a homogeneous
sphere. In a second case, we took into account the
core-shell structure of the oocytes. In both cases, the
MEASURING THE REFRACTIVE INDEX OF OOCYTES BY MEANS OF AN OPTICAL MICROSYSTEM - A Non
Invasive Technique to Estimate the Evolution of Oocytes Maturity
131

refractive index of the cytoplasm tends to increase
with the degree of maturity. Although the maturity
classes can be visually distinguished, it seems
difficult to use the refractive index value to estimate
the maturity of a completely unknown oocyte. We
proposed a discussion on this issue. We think that,
and this is perhaps an interesting conclusion of this
work, oocytes should not only be qualified in terms
VG, MI and MII but also regarding their temporal
evolution over these maturation stages.
Studies on a much larger number of oocytes are
still required. Also, the investigation of other optical
characteristics should be envisaged. At the end, we
hope that these studies will help biologists in
choosing not only the right oocyte but also the right
oocyte at the right moment.
REFERENCES
Beebe, DJ., Wheeler, M., Zeringue, HC. et al., 2002,
Microfluidic technology for assisted reproduction,
Theriogenology, Vol. 57, pp. 125–135.
Danielli, JF. 1952, Division of the flattened egg, Nature,
Vol. 170, pp. 496-496.
Gauthier, G., Piat, E., 2002, An electromagnetic
micromanipulation system for single cell
manipulation, J. Micromech. Vol. 2, pp. 87–119.
Hwang, H., Lee, DH., Choi, W., et al., 2009, Enhanced
discrimination of normal oocytes using optically
induced pulling-up dielectrophoretic force,
Biomicrofluidics, Vol. 3, pp. 014103-1-014106-10
Inui, H., Nakamura, H., Mizuno, J., et al., 2006,
Development of ovum evaluation system for human
assisted reproductive technology: verification of the
effects and the safety, in 22nd Annual Meeting of the
European Society of Human Reproduction and
Embryology (ESHRE2006), Proceedings in Hum.
Reprod. 1(Suppl 1), pp. i161.
Kricka, LJ., Faro, I., Heyner, S., et al., 1997,
Micromachined analytical devices: microchips for
semen testing, J. Pharm. Biomed. Anal. Vol. 15, pp.
1443–1447.
Marquet, P., Rappaz, B., Magistretti, PJ., et al., 2005,
Digital holographic microscopy: a noninvasive
contrast imaging technique allowing quantitative
visualization of living cells with subwavelength axial
accuracy, Opt. Lett., Vol. 30, pp. 468-470.
Murayama, Y., Omata, S., Constantinou, CE., 2004,
Micro-mechanical sensing platform for the
characterization of the elastic properties of the ovum
via uniaxial measurement, J. Biomech. Vol. 37, pp.
67-72.
Nakamura, S., Hiramoto, Y., 1978, Mechanical properties
of the cell surface in starfish eggs, Dev. Growth
Differ. Vol. 20, pp. 317-327.
Ohtsubo, M., Hiramoto, Y., 1985, Regional differences in
mechanical properties of the cell surface in dividing
echinoderm eggs. Development, Growth and
Differentiation, Dev. Growth Differ. Vol. 27, pp.371-
383.
Oliviera, PL., Kawooya, JK., Ribiero, JMC., et al., 1995,
J. of Biological Chemistry, Vol. 270, pp. 10897-
10901.
Pieralli, C., Wacogne, B., André, C., et al., 2009,
Biological qualification of oocyte maturity with the
use of the Karhunen-Loeve transform: computer aided
decision for selecting best oocytes before fertilization,
in Medical Image Analysis and Description for
Diagnosis Systems, Proceedings of the First
International Workshop on Medical Image Analysis
and Description for Diagnosis Systems, INSTICC
Press, ISBN: 978-989-8111-77-7, pp. 77-84.
Sadani, Z., Wacogne, B., Pieralli, C., et al., 2005,
Microsystems and microfluidic device for single
oocyte transportation and trapping: toward the
automation of in vitro fertilising, Sens. and Act. A
Vol. 121, pp. 364–372.
Sawai, T., Yoneda, M., 1974, Wave of stiffness
propagating along the surface of the newt egg during
cleavage, J. Cell Biol. Vol. 60, pp. 1-7.
Shaked, NT., Rinehart, MT., Wax, A., 2009, Dual
interference channel quantitative phase microscopy of
live cell dynamics, Opt. Lett., Vol. 34, pp. 767-769.
Suh, RS., Phadke, N., Ohl, DA.,
et al., 2003, Rethinking
gamete/embryo isolation and culture with
microfluidics, Human Reproduction Update, Vol. 9,
pp. 451-461.
Wacogne, B., Pieralli, C., Roux, C., et al., 2008,
Measuring the mechanical behaviour of human
oocytes with a very simple SU-8 micro-tool,
Biomedical Microdevices, Vol. 10, pp. 411-419.
Zeggari, R., Wacogne, B., Pieralli, C., et al., 2007, A full
micro-fluidic system for single oocyte manipulation
including an optical sensor for cell maturity estimation
and fertilisation indication, Sens. and Act. B, Vol. 125,
pp. 664-671.
Zeggari, R., Wacogne, B., Pieralli, C., 2006, Optics and
microsystems for in vitro fertilisation, Laser Physics,
Vol. 16, pp. 294-302.
Zeringue, HC., Beebe, DJ., Wheeler, MB., 2001, Removal
of cumulus from mammalian zygotes using
microfluidic techniques, Biomed. Microdev. Vol. 3,
pp. 219–224.
BIODEVICES 2010 - International Conference on Biomedical Electronics and Devices
132
