
AN ASSESSMENT PROCEDURE INVOLVING WAVEFORM SHAPES
FOR PU
PIL LIGHT REFLEX
Minoru Nakayama
CRADLE, Tokyo Institute of Technology, Tokyo 152-8552, Japan
Wioletta Nowak
Institute of Biomedical Engineering and Instrumentation, Wroclaw University of Technology, Wroclaw, Poland
Hitoshi Ishikawa, Ken Asakawa
School of Allied Health Sciences, Kitasato University, Sagamihara 228-8555, Japan
Keywords:
Pupil light reflex, Waveforms, Fourier descriptor, Dissimilarity, Multidimensional scaling.
Abstract:
The waveforms of Pupillary Light Reflex (PLR) can be analyzed in a diagnostic test that allows for differ-
entiation between disorders affecting photoreceptors and those affecting retinal ganglion cells. This position
paper proposes quantitative comparison metrics for waveform shapes using Discrete Fourier Transform (DFT)
descriptors (FDs), and another procedure for emphasizing stimuli and subject differences using MultiDimen-
sional Scaling (MDS) and clustering, where dissimilarities between stimuli are defined using descriptors as
waveform features. To determine the efficiency of the procedures, a set of PLR data from a conventional
experiment for the determination of a melanopsin-associated photoreceptive system was analyzed. Though
the captured data was based on single trial for the stimuli, and the number of samples was small, both char-
acteristics of stimuli and subjects were quantitatively extracted using the proposed procedures. Therefore, the
possibility of applying the procedures to clinical diagnostics using PLR was examined.
1 INTRODUCTION
The Pupillary Light Reflex (PLR) is a well-known
phenomenon, and recently its behavior has been
examined in detail because of the existence of a
melanopsin-associated photoreceptive system in the
human retina, in addition to the conventionalrod-cone
system (Gamlin et al., 2007). Many studies have con-
sidered the contributions of this melanopsin to be a
subset of intrinsically photosensitive retinal ganglion
cells (Hattar et al., 2002; Dacey et al., 2005). To
reveal the sensitivity and activity of these cells, the
transient phase of PLR has often been studied using
pupillary responses for low and high stimulus inten-
sities, which were evoked using either short or long
wavelength stimuli (Young and Kimura, 2008). In
particular, the waveforms in the sustained phase of
PLR are often compared across the stimulus condi-
tions. These observations may be useful for clinical
diagnostic procedures (Kawasaki and Kardon, 2007),
though a quantitative index of PLR waveforms has
not yet been established, however. In most cases,
waveform shapes are subjectively compared in pupil-
lograms, therefore quantitative metrics and analytical
procedures for corresponding waveforms have been
desired. Because PLR observations are based on the
response to a light pulse, human subjects cannot be
subjected to repeated measurement. Also, a simpli-
fied procedure is required for clinical diagnostic tests.
Though conventional pupil research has discussed
mean pupil diameters and mean frequency spectra
(Kuhlmann and Bottcher, 1999), these metrics cannot
be applied. Simplified metrics of single waveforms
are required to reveal the melanopsin-associated pho-
toreceptive system.
In the area of signal processing and pattern
recognition the features of waveforms using Fourier
Descriptors have often been discussed (Zahn and
Roskies, 1971; Pinkowski, 1994; Zhang and Lu,
2002). These waveforms can be compared to each
other. Once the quantitative features are defined, the
metrics of similarity or dissimilarity across the wave-
forms can also be extracted.
This position paper proposes a procedure for cre-
322
Nakayama M., Nowak W., Ishikawa H. and Asakawa K. (2010).
AN ASSESSMENT PROCEDURE INVOLVINGWAVEFORM SHAPES FOR PUPIL LIGHT REFLEX.
In Proceedings of the Third International Conference on Bio-inspired Systems and Signal Processing, pages 322-326
DOI: 10.5220/0002756603220326
Copyright
c
SciTePress
ating quantitative features of PLR waveforms, and
demonstrates comparisons of these waveforms across
stimuli and individuals using the metrics. Therefore,
following topics are addressed:
1. A procedure for extracting feature vectors of PLR
waveforms is created, and the metrics to compare
these waveforms are determined.
2. The dissimilarities across the waveforms are also
defined, and the differences in stimuli condi-
tions and subjects are examined using multidi-
mensional scoring and clustering techniques.
2 METHOD
2.1 Experimental Procedure
The Pupillary Light Reflex (PLR) is the constriction
of the pupil elicited by an increase in illumination of
the retina. A conventional experiment used for the de-
termination of a melanopsin-associated photorecep-
tive system was conducted. In the experiment, a
long wavelength (635nm bandwidth) red light and a
short wavelength (470nm bandwidth) blue light were
used at 2 different light intensities (10 cd/m
2
and 100
cd/m
2
).
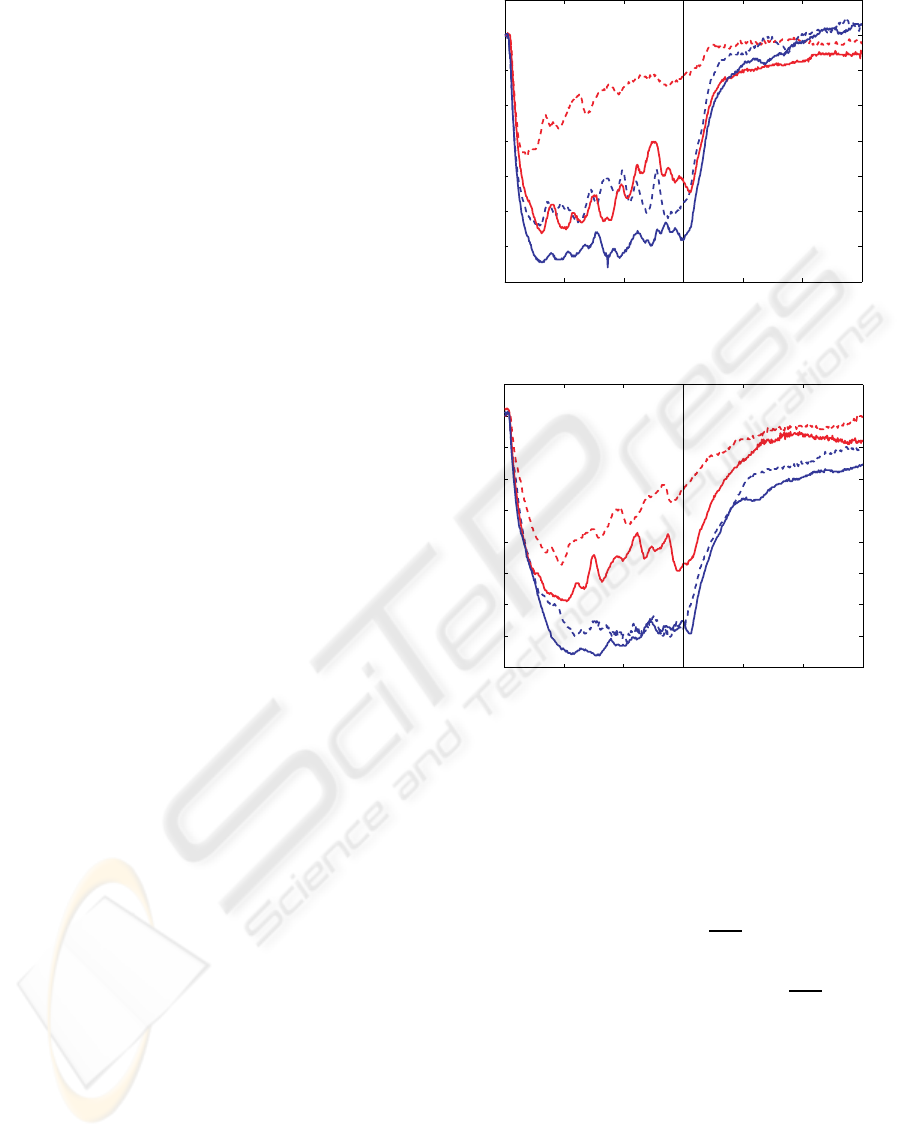
Both Figure ?? and 2 show the PLR of a 10
sec. light pulse as a constriction phase and a 10 sec.
restoration phase in two normal subjects. In these fig-
ures, red lines show PLRs for long wavelengths, and
blue lines show PLRs for short wavelengths. Also,
solid lines show PLRs for high intensity light, and
dotted lines show low intensity light. In this paper,
the four conditions are defined as follows: r10 (long
wavelength – low light intensity), r100 (long–high),
b10 (short–low), b100 (short–high).
During this experiment, PLRs for these four con-
ditions were observed for each subject.
Pupil light responses were recorded using an iris-
tracker (Hamamatsu Iriscorder Dual). Subjects were
6 healthy individuals with normal vision between the
ages of 20 and 21 years. Subjects were asked to
not blink for 20 sec. while their pupil diameter was
recorded at a sampling rate of 30 Hz. These measure-
ments were taken in a dark room with constant light-
ing conditions. A dark-adaptation period of 5 minutes
was allowed prior to taking all measurements.
2.2 Fourier Descriptors
The feature vectors for PLR waveforms were ex-
tracted using the Discrete Fourier Transform (DFT)
procedure (Pinkowski, 1994; Zhang and Lu, 2002).
0 10 20
−3.5
−3
−2.5
−2
−1.5
−1
−0.5
0
0.5
Stimulus on Stimulus off
Time (sec.)
Diameter (mm)
r10
r100
b10
b100
Figure 1: sub1.
0
−4
−3.5
−3
−2.5
−2
−1.5
−1
−0.5
0
0.5
10 20
Stimulus on Stimulus off
Time (sec.)
Diameter (mm)
r10
r100
b10
b100
Figure 2: sub2.
As mentioned above, PLRs were sampled as discrete
signals. Here, the length N of a discrete signal is de-
fined as x(n), which is sampled at time t with spacing
∆. The signal x(n) can be noted as an equation (1)
using DFT (Morishita and Kobatake, 1982).
x(n) = a
0
+
N/2
∑
k=1
(a(k)c
os(2πk
t(n)
N∆
)
+ b(k)sin(2πk
t(n)
N∆
)) (1)
a
0
= X(1)/N
a(k) = 2 real(X(k+ 1))/N
b(k) = 2 imag(X(k+ 1))/N
This suggests that PLR waveforms can be repre-
sented using coefficients a
0
, a(k) and b(k) with peri-
odical cosine and sine functions. To present the fea-
tures of the waveform, the magnitude of coefficients
is preferred, because coefficient b(k) is the imagi-
nary part of a value. The magnitudes of coefficients,
AN ASSESSMENT PROCEDURE INVOLVINGWAVEFORM SHAPES FOR PUPIL LIGHT REFLEX
323
including a
0
, FD
i
(i = 0,. .. ,N/2 − 1) are used as
Fourier descriptors (FD) as follows in vector (2):
f = [FD
0
,FD
1
,...,FD
N/2−1
] (2)
In general, the components FD
0
, a
0
in the equa-
tion (1), show the DC components of the signal.
These DC components represent the amplitude, ex-
cept the waveform shape consisting of frequency
components. Also, features are affected by individual
factors, so that a standardized feature is preferred as
follows in vector (3) as follows(Zhang and Lu, 2002):
f = [
FD
2
FD
1
,
FD
3
FD
1
,... ,
FD
N/2−1
FD
1
] (3)
Additionally, an appropriate number of compo-
nents for the feature vector represent the character-
istics of most signals only at the low-order values of
4 or 5 FDs (Pinkowski, 1994).
3 RESULTS
3.1 Feature of PLRs
According to the analytical procedure in the above
section 2.2, the features of PLRs for a subject (Sub1)
were extracted. The actual calculations were con-
ducted using MATLAB (Mathworks, Inc.). First,
FD
0
are extracted in order to compare the waveform
amplitude as follows:
FD
0,r10
= 319.4, FD
0,r100
= 832.5,
FD
0,b10
= 773.8, FD
0,b100
= 1001.6
For FD
0
values, the value for the b100 condition
is the largest, and the value for r10 condition is the
smallest. The order of these values coincides with the
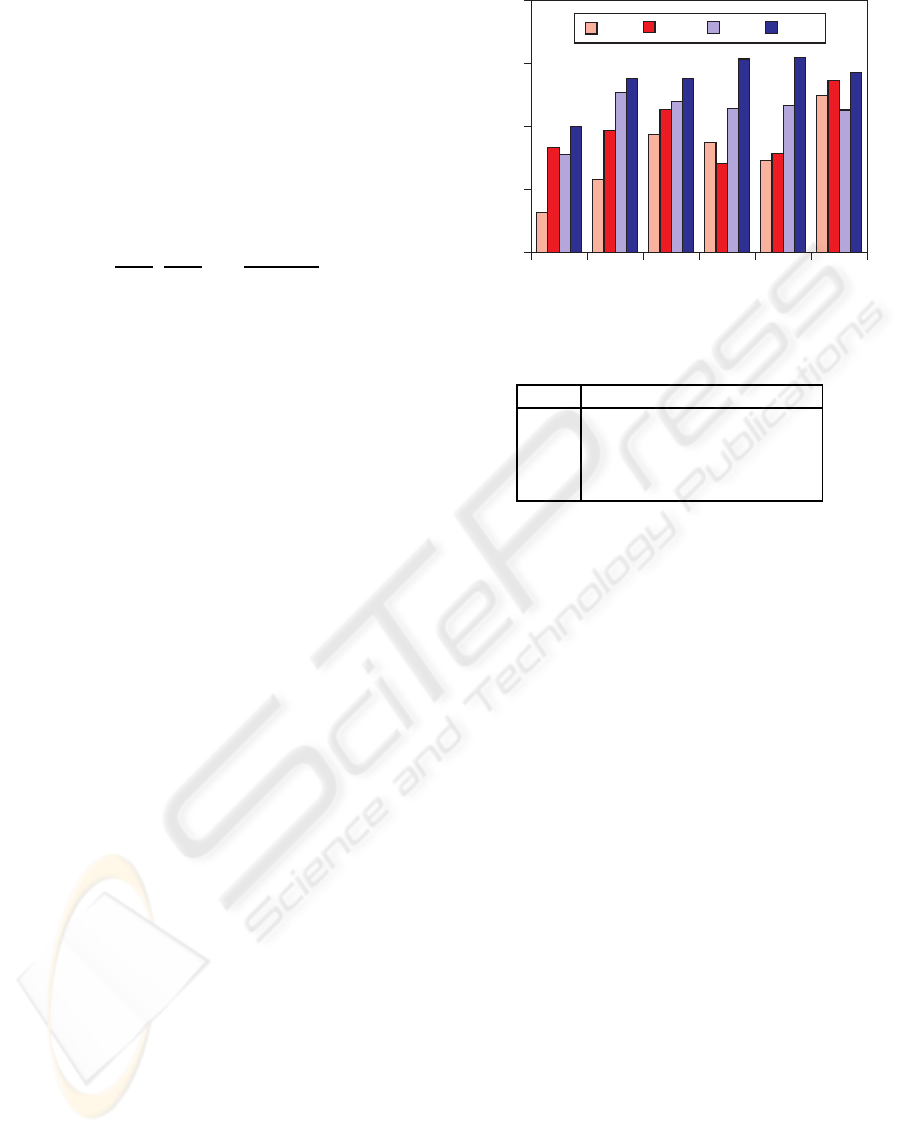
pattern in Figure ??. The FD
0
values are extracted
for all subjects and are illustrated in Figure 3. The or-
der of these values is maintained across most subjects
though individual differences are observed. In com-
paring PLRs between Sub1 and Sub2 in Figure ?? and
2, the relationships between the four conditions are
different between the two subjects, though the orders
of FD
0
are almost similar to those in Figure 3.
Feature vectors are extracted for every waveform
using the format of vector (3). For example, the set of
vectors for a subject Sub1 is shown as follows:
f
r10
= [0.408, 0.384,0.197,0.276,0.150]
f
r100
= [0.253, 0.289,0.122,0.204,0.025]
f
b10
= [0.177, 0.365,0.071,0.152,0.072]
f
b100
= [0.160, 0.289,0.104,0.141,0.051]
According to the set of features, the vectors for
b10 and b100 may be similar, but the vector for r10 is
relatively different.
sub1 sub2 sub3 sub4 sub5 sub6
0
500
1000
1500
2000
r10 r100
b10
b100
DC component
Figure 3: Comparison of DC components.
Table 1: Euclid distance between stimuli (sub1).
r10 r100 b10 b100
r10 0
r100 0.24 0
b10 0.30 0.14 0
b100 0.33 0.12 0.09 0
3.2 Similarity/Dissimilarity
To compare the shape of waveforms quantitatively,
metrics of similarity of dissimilarity should be defined
using waveform feature vectors. This is a very popu-
lar approach for pattern recognitions such as catego-
rization and discrimination (Stork et al., 2001). Here,
the Euclidean distance (or Minkowski’s power met-
ric) can be defined as the Euclidean norm between
two feature vectors. This is the dissimilarity metric.
The distances amongst stimuli conditions for Sub1 are
summarized in Table 1 as a triangular matrix. Accord-
ing to the matrix, the longest distance is between r10
and b100, and the shortest distance is between b10
and b100.
Distance matrices were created for all subjects.
3.3 Configuration of Stimuli and
Subjects
To create an overall structure of relationship be-
tween PLR waveforms, the Multi Dimensional Scal-
ing (MDS) method is applied to the distance ma-
trix. The famous application of MDS is re-creation of
the geographical map of the distance matrix amongst
cities (Takane, 2007). The Individual Difference
MDS procedure has been introduced to extend the
conventional MDS analysis to multiple distance ma-
trices using every subject’s matrix. The actual calcu-
lation was conducted using SAS (Mayekawa, 1997).
BIOSIGNALS 2010 - International Conference on Bio-inspired Systems and Signal Processing
324
-1
0
1
2
-1 0 1 2
r10
r100
b10
b100
Dimension 1
Dimension 2
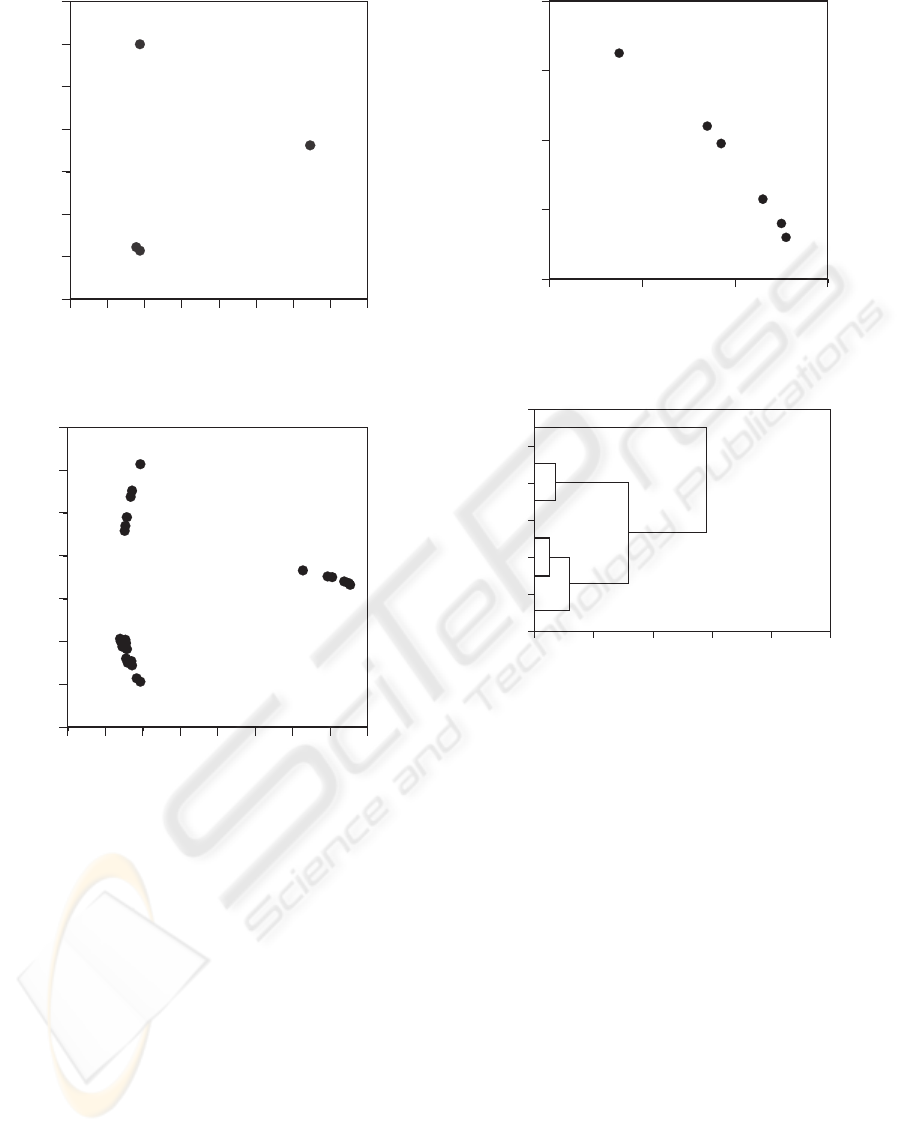
Figure 4: The stimulus configuration using two-
dimensional scales from MDS.
-1
0
1
2
-1 0 1 2
sub2
sub2
sub2
sub4
sub4
sub4
sub5
sub5
sub5
sub6
sub6
sub6
sub1
sub1
sub1
sub3
sub3
sub3
Dimension 1
Dimension 2
Figure 5: The stimulus for subjects configuration using two-
dimensional scales.
First, the stimulus are configured on a two-
dimensional space which is created by MDS analy-
sis, as shown in Figure 4. The horizontal axis shows
dimension 1, and the vertical axis shows dimension
2. Both dimensions are created as a result of MDS,
therefore they show distance between stimuli while
the dimensional interpretation is unstable. Both b10
and b100 almost overlap because the distance are the
shortest. Both r10 and r100 are separated from b10
and b100, and the value of dimension 1 for r100 is
almost the same as for b10 and b100. According to
the two-dimensional configuration shown in Figure 4,
the stimulus r10 differs from other conditions in both
dimension 1 and dimension 2. In a sense, dimension
1 extracts r10 conditions while dimension 2 extracts
r100 conditions.
All results for the four conditions and 6 subjects
0.4
0.6
0.8
1
1.2
0.8 1 1.2 1.4
sub2
sub4
sub5
sub6
sub1
sub3
Dimension 1
Dimension 2
Figure 6: The subjects configuration using two-dimensional
scales.
sub5
sub1
sub4
sub3
sub6
sub2
0 0.1 0.2 0.3 0.4 0.5
Distance
Figure 7: A dendrogram of the cluster for subjects.
are mapped in Figure 5. The stimuli conditions make
clusters in response to the configurationsof stimuli, as
shown in Figure 4 where all subject’s data is mapped
in a similar style. When subjects’ configuration inside
three clusters are carefully observed, plots of subjects
are shifted regularly in every cluster.
All subjects can be configured on the same space,
as shown in Figure 6. Subjects are distributed on a
line. Also, three clusters can be observed, configu-
ration for one subject (Sub2) is separated from the
others. To clarify the relationship between subjects,
cluster analysis was conducted using two dimensional
MDS information for each individual. A dendrogram
is summarized in Figure 7. The horizontal axis shows
averaged distance between subjects. The clustering
process responds to the distribution of subjects in Fig-
ure 6. The distance between Sub1 and Sub4 is the
shortest, and Sub2 is separated from the others.
The number of dimensions which are created by
MDS analysis were extended to three dimension. The
dimensional values are summarized in Table 2. The
contribution of both dimension 1 and dimension 2 to
AN ASSESSMENT PROCEDURE INVOLVINGWAVEFORM SHAPES FOR PUPIL LIGHT REFLEX
325

Table 2: Three dimensional information of MDS for stim-
uli.
Dim1 Dim2 Dim3
r10 1.73 0.39 1.07
r100 -.60 1.46 -.12
b10 -.60 -1.03 0.62
b100 -.55 -.82 -1.57
the discrimination has the same tendency as in the
case of a two-dimensional analysis. However, the
stimuli b10 and b100 are separated from each other
on a scale the same as in dimension 3, therefore di-
mension 3 may be related to the light strength of the
short wavelength.
In this analysis, all subjects are normal individu-
als. This procedure can be used to detect diseases or
as a diagnostic procedure if target patient data is sep-
arated from a cluster of normal subjects. This will be
a subject of our further study.
4 CONCLUSIONS
In this position paper, we propose a quantitative com-
parison metrics of Pupil Light Reflex (PLR) wave-
form shapes using the Discrete Fourier Transform
(DFT) descriptors (FDs), and another procedure for
emphasizing stimuli and subject differences using
Multi Dimensional Scaling (MDS) and clustering
when the dissimilarity between stimuli is defined us-
ing the descriptors as waveform features.
The demonstrations were conducted using a
conventional experiment for the determination of
a melanopsin-associated photoreceptive system.
Though the captured data was based on single trial
for the stimuli, and the number of samples was small,
both characteristics of stimuli and subjects were
quantitatively extracted using the proposed proce-
dures. Therefore, the possibility of its application for
clinical diagnostics using PLR was examined.
The interpretation of scales and clinical applica-
tions will be subjects of our further study.
REFERENCES
Dacey, D. M., Liao, H. W., and Peterson, B. B.
(2005). Melanopsin-expressing ganglion cells in pri-
mate retina signal color and irradiance and project to
the LGN. Nature, 433:749–754.
Gamlin, P. D., McDougal, D. H., and Pokorny, J. (2007).
Human and macaque pupil responses driven by
melanopisn-containing retinal ganglion cells. Vision
Research, 47:946–954.
Hattar, S., Liao, H. W., and Takao, M. (2002). Melanopsin-
containing retinal ganglion cells: architecture, pro-
jections, and intrinsic photosensitivity. Science,
295:1065–1070.
Kawasaki, A. and Kardon, R. H. (2007). Intrinsically pho-
tosensitive retinal ganglion cells. Journal of Neuro-
Opthalmology, 27:195–204.
Kuhlmann, J. and B¨ottcher, M., editors (1999). Pupil-
lography: Principles, Methods and Applications.
W. Zuckschwerdt Verlag, Munchen, Germany.
Mayekawa, S. (1997). Multivariate Data Analysis Using
SAS Software. University of Tokyo Press, Tokyo,
Japan.
Morishita, I. and Kobatake, H. (1982). Signal Processing
(In Japanese). The Society of Instrument and Control
Engineers, Tokyo, Japan.
Pinkowski, B. (1994). Robust fourier descriptions for char-
acterizing amplitude-modulated waveform shapes.
Journal of Acoustical Society of America, 95(6):3419–
3423.
Stork, D. G. R., Duda, O., and Hart, P. E. (2001). Pattern
Classification. John Wiley & Sons, Inc., 2nd edition.
Japanese translation by M. Onoue, New Technology
Communications Co., Ltd., Tokyo, Japan (2001).
Takane, Y. (2007). Applications of multidimensional scal-
ing in psychometrics. In Rao, C. and Sinharay, S., edi-
tors, handbook of statistics 26 – Psychometrics, pages
359–400. North-Holland, Amsterdam, Netherlands.
Young, R. and Kimura, E. (2008). Pupillary correlates of
light-evoked melanopsin activity in humans. Vision
Research, 48:862–871.
Zahn, C. T. and Roskies, R. Z. (1971). Fourier descriptors
for plane closed curves. IEEE Transaction on Com-
puters, Vol.C-21(3):269–281.
Zhang, D. and Lu, G. (2002). A comparative study on shape
retrieval using fourier descriptors with different shape
signatures. In Proceedings of the 5th Asian Confer-
ence on Computer Vision, pages 646–651. Springer.
BIOSIGNALS 2010 - International Conference on Bio-inspired Systems and Signal Processing
326
