
REAL-TIME 3D FILTERING OF ULTRASOUND DATASETS
Dong-Soo Kang, Koojoo Kwon, Eun-Seok Lee, Sang-Chul Lee and Byeong-Seok Shin
Dept. of Computer & Information Engineering, Inha Univ., 253 Yonghyun-Dong, Nam-Gu, Inchon, Korea
Keywords: Interactive visualization, GPU-based volume ray-casting, Ultrasound data rendering, 3D filtering.
Abstract: Ultrasound imaging is used in a variety of medical areas. Although its image quality is inferior to that of CT
or MR, it is widely used for its high speed and reasonable cost. However, it is difficult to visualize ultra-
sound data because the quality of the data might be degraded due to artifact and speckle noise. Therefore,
ultrasound data usually requires time-consuming filtering before rendering. We present a real-time 3D filter-
ing method for ultrasound datasets. Since we use a CUDA
TM
technology for 3D filtering, we can interac-
tively visualize a dataset. As a result, our approach enables interactive volume rendering for ultrasound
datasets on a consumer-level PC.
1 INTRODUCTION
Ultrasound imaging is a well-known diagnosis
method to visualize the distribution of ultrasonic
echo signal. Although its image quality is worse than
those of CT and MR images, it is widely used for
diagnosis for its cost-effectiveness. An ultrasound
device has several advantages compared with other
medical imaging modalities. It is regarded as being
relatively safe (Dunn, 1991), it involves no ionizing
radiation, and most examinations are noninvasive
and do not distress patients (Kuo, 2007). In addition,
the acquisition procedure is faster than those of other
medical imaging techniques. And ultrasound offers
interactive visualization of the underlying anatomy
with the ability to represent dynamic structures.
However, we have to consider two major problems
of the 3D ultrasound visualization: lower signal-to-
noise ratio and the fuzzy nature of the boundary sur-
faces in the ultrasound image.
In order to reduce the noise, lots of methods
have been proposed (Fattal and Lischinski, 2001).
During visualization of ultrasound data, the filtering
stage is very time consuming since most of filtering
methods refer to the entire voxels of volume dataset,
and they are executed on CPU using MultiMedia
eXtension (MMX) or Open Multi-Processing
(OpenMP) technology.
In this paper, we present a real-time 3D filtering
for ultrasound datasets using graphics hardware. We
use CUDA
TM
(short for Compute Unified Device
Architecture) from nVidia to program inexpensive
multi-thread GPUs. Also, we can perform coordinate
conversion between ultrasound and Cartesian coor-
dinates using fragment shader. While most of filter-
ing methods takes long time, our method performs
filtering in real-time with modern graphics hard-
ware. It helps doctors to diagnose patient with inter-
active operation.
In Section 2, we briefly review previous work,
and our method is explained in Section 3. In Section
4, the experimental results are presented, and
Section 5 gives the conclusion and future work.
2 RELATED WORK
Ultrasound data are acquired in near real-time. So,
the data manipulation and visualization have to be
processed as fast as data acquisition. In the data ma-
nipulation process, since ultrasound data typically
contains speckle noise and fuzzy boundaries, we
have to remove them. Sanches et al. described sev-
eral techniques to improve the efficiency of the sur-
face reconstruction principles in Taylor series (João
and Sanches, 2003). However it takes long process-
ing time. Kim et al. proposed filtering method using
truncated-median filter in 2D ultrasound image (Kim
and Oh, 1999), which requires pre-processing stage.
Burckhardt presented a theoretical analysis of the
noise such as an interference phenomenon (Burck-
hardt, 1978). The analysis is based on an object that
comprises many point scatterers per resolution cell,
with a random phase associated with each scattered
echo. A number of researchers (Coppini and Poli,
473
Kang D., Lee E., Kwon K., Lee S. and Shin B. (2010).
REAL-TIME 3D FILTERING OF ULTRASOUND DATASETS.
In Proceedings of the Third International Conference on Health Informatics, pages 473-476
DOI: 10.5220/0002757704730476
Copyright
c
SciTePress
1995) use Gaussian weighted averaging to smooth
images and the Laplacian-of-Gaussian (LoG) to de-
tect tissue boundaries (Torre and Poggio, 1986).
Evans and Nixon have proposed using a variation of
the median filter to estimate the local mode within
ultrasound images (Evans and Nixon, 1993). It is
difficult to determine the mode within a small popu-
lation such as 9×9 filter kernel. Consequently, they
use a truncated median filter to estimate the mode of
the local distribution. Although these methods are
good for remove noise, these are unsuitable for real-
time system.
3 REAL-TIME 3D FILTERING
USING CUDA
TM
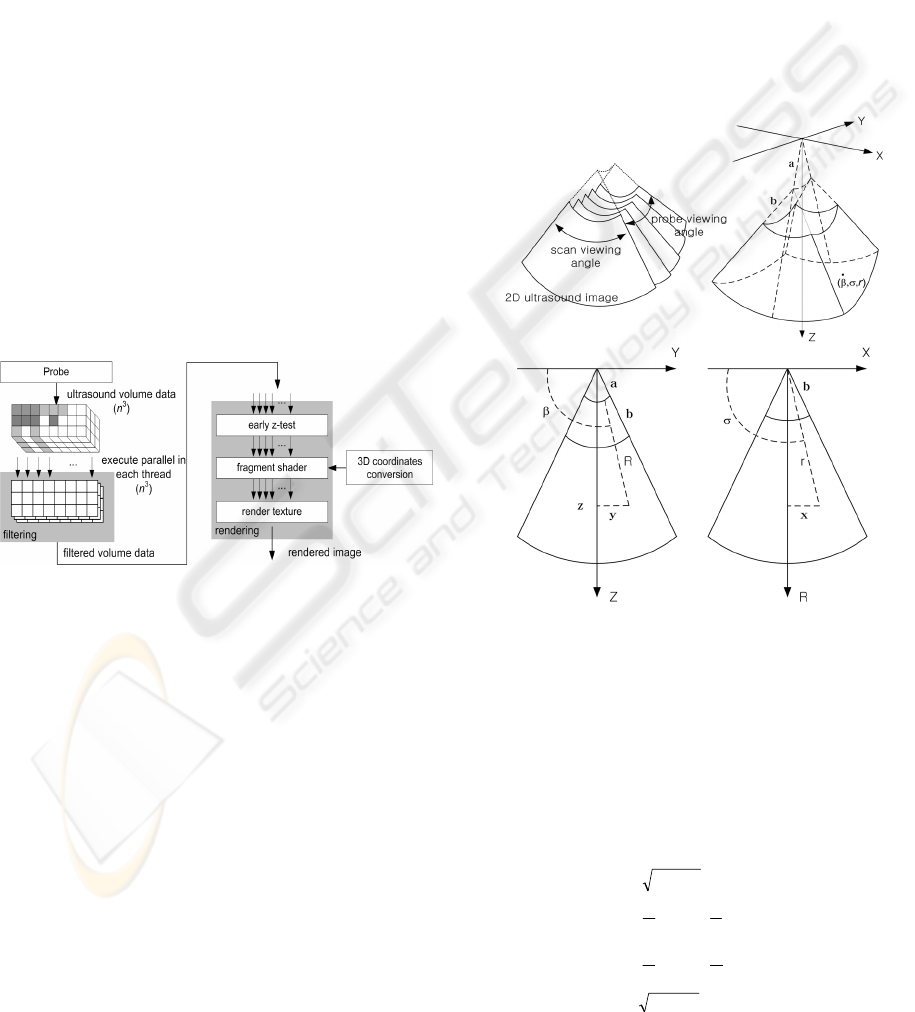
Figure 1 shows the overview of our method. Firstly,
the volume data acquired by ultrasonic probe is
transferred to the filtering module using CUDA
TM
.
Every voxel is allocated in each thread on GPU.
Then filtered data is transferred to the rendering
module. Finally, the result image is generated by
using volume ray casting on fragment shader.
Figure 1: Overall procedure of our method.
3.1 Conversion between Ultrasound
and Cartesian Coordinates
To obtain high-quality images at interactive speed,
we exploit volume ray casting (Krüger and Wester-
mann, 2003). Because this computes the volume-
rendering integral along rays, it samples scalar val-
ues in the Cartesian coordinate. Unlike CT and MR
data acquired as 3D Cartesian grid form, ultrasound
data is more complicated, because typical ultrasound
data involves non-Cartesian grids. As a result, time-
consuming coordinate conversion between the ultra-
sound and Cartesian coordinates is required.
The upper two images in figure 2 depict 3D ultra-
sound volume data, and the others are the cross-
sectional images of the 3D ultrasound volume data
on the YZ plane and the XZ plane, where the X, Y,
and Z axes are in Cartesian coordinates. We generate
a 3D ultrasound volume dataset by stacking 2D im-
ages acquired via a probe scan (see Fig. 2 (top)). We
assume that
σ
is the angle in the 2D image (scan
viewing angle) and that
β
is the angle for generating
an ultrasound 3D volume dataset (probe viewing
angle). The ranges of
σ
and
β
are 0° ≤
σ
< Ω < 180°
and 0° ≤
β
< Φ < 180°, where Ω and Φ are the full
ranges scanned by ultrasound probe for the
σ
and
β
,
respectively. The value r is the distance from the
probe to a position of interest, the a is the distance
between the origin and the maximum probe viewing
angle, and b means the distance to the start position
to collect voxel values in 2D images
Figure 2: Ultrasound coordinates (top two images) and YZ
and XZ cross-sectional plane (bottom two images).
A data from the ultrasound probe is represented in
ultrasound coordinates, having been converted to
Cartesian coordinates. This means that each position
in ultrasound coordinates has to be changed into a
position in Cartesian coordinates. Then we can ob-
tain the rendered image using these converted sam-
pling positions. We calculate this conversion be-
tween the two coordinates via equation (1).
bRxr
R
x
z
y
azyR
−+=
⎟
⎠
⎞
⎜
⎝
⎛
+=
⎟
⎠
⎞
⎜
⎝
⎛
+=
−+=
−
−
22
1
1
22
tan
2
tan
2
π
σ
π
β
(1)
HEALTHINF 2010 - International Conference on Health Informatics
474

3.2 Shape of Filters
We have to determine the size of smoothing filter
according to voxel position and voxel value. We
propose two methods, region-based 3D filtering and
OTF-based 3D filtering.
3.2.1 Region-based 3D Filtering
In the clinic applications, we can set the region of
interest (ROI) on the ultrasound dataset as shown in
figure 3. We divide a space into inside and outside
region. Then we apply different filters according to
region types : small-sized filter kernel (e.g. 2
3
or 3
3
average filter) for inside and large-sized filter kernel
(e.g. 5
3
or 9
3
average filter) for outside. It is helpful
to improve visibility since we can exclude less-
significant region. We can apply average filter n
times in outside region. The filtered region is getting
blurred image while the value of n grows up. It
means that region is reduced a noise from the final
result. Since this procedure is performed so fast, our
system can be operated interactively whether the
outside is interesting region or not.
We set the ROI manually or semi-automatically.
We consider the opacity transfer function (OTF)
when we use a semi-automatic method. The values
of the minimum and the maximum against each axis
are used to set the ROI boundary. All procedure is
executed parallel assigns one voxel by one thread.
Figure 3: Inside and outside regions of ROI. Since we
remove fuzzy structure by applying large-sized filters, we
can focus on the interested object.
3.2.2 OTF-based 3D Filtering
OTF is used to determine whether an object belongs
to interesting region or not. We apply the different
filter kernel for each voxel according to an OTF
value. We decide a filter kernel size after comparing
the density value of each voxel and its correspond-
ing OTF value. Figure 4 shows the different filter
kernel used in filtering stage. If the voxel value is in
the threshold (see interesting object in figure 4), we
apply the small-sized filter to it, otherwise (see non-
interesting object in figure 4) we set the large one
for the voxel. During filtering stage, a variety filter
types are applicable such as average filter and Gaus-
sian filter without additional cost.
Figure 4: OTF-based 3D filtering method. The different
filter kernel is applied to each voxel during the filtering
stage.
4 EXPERIMENTAL RESULTS
We tested our method on a PC equipped with an
AMD
TM
Athlon dual-core processor 4200 (2.21
GHz) with 2 GB main memory. The graphics accele-
rator is an NVIDIA 7800 GTX
TM
(with 256 MB
video memory). We used the DirectX 9.0 and the
High-Level Shading Language shader Version 3.0.
We evaluated filtering speed and the quality of
resulting images. Table 1 shows the filtering speed
of CPU-based method and CUDA
TM
-based one. Our
approach much is faster than the conventional CPU-
based method. When we compared the filtering time
of region-based method with that of OTF-based
method while applying the same filter kernel, we
found that the OTF-based method is approximately
15% faster than region-based method because there
is more filtering instruction on outside region. When
we apply both OTF- and region-based method, the
speed of filtering is a little decrease since there is
more instruction set in every thread.
Table 1: Comparisons of filtering speed (fps).
Dataset
CPU-
based
CUDA
TM
-based
OTF-
based (A)
Region-
based (B)
(A)+(B)
256×256×51 < 1 42 38 35
256×256×96 < 1 22 18 16
Figure 5 shows quality of the resulting images. Top
row images are rendered by using ray casting when
filtering on CPU and bottom row images are ren-
dered with our method. We can verify the same
quality of both images. In Figure 6, when we applied
region-based method, non-interesting objects in out-
side of volume are removed efficiently. We applied
5
3
filter kernels 8 times on the outside region. So, we
can verify that fuzzy structure and a part of placenta
are removed.
REAL-TIME 3D FILTERING OF ULTRASOUND DATASETS
475
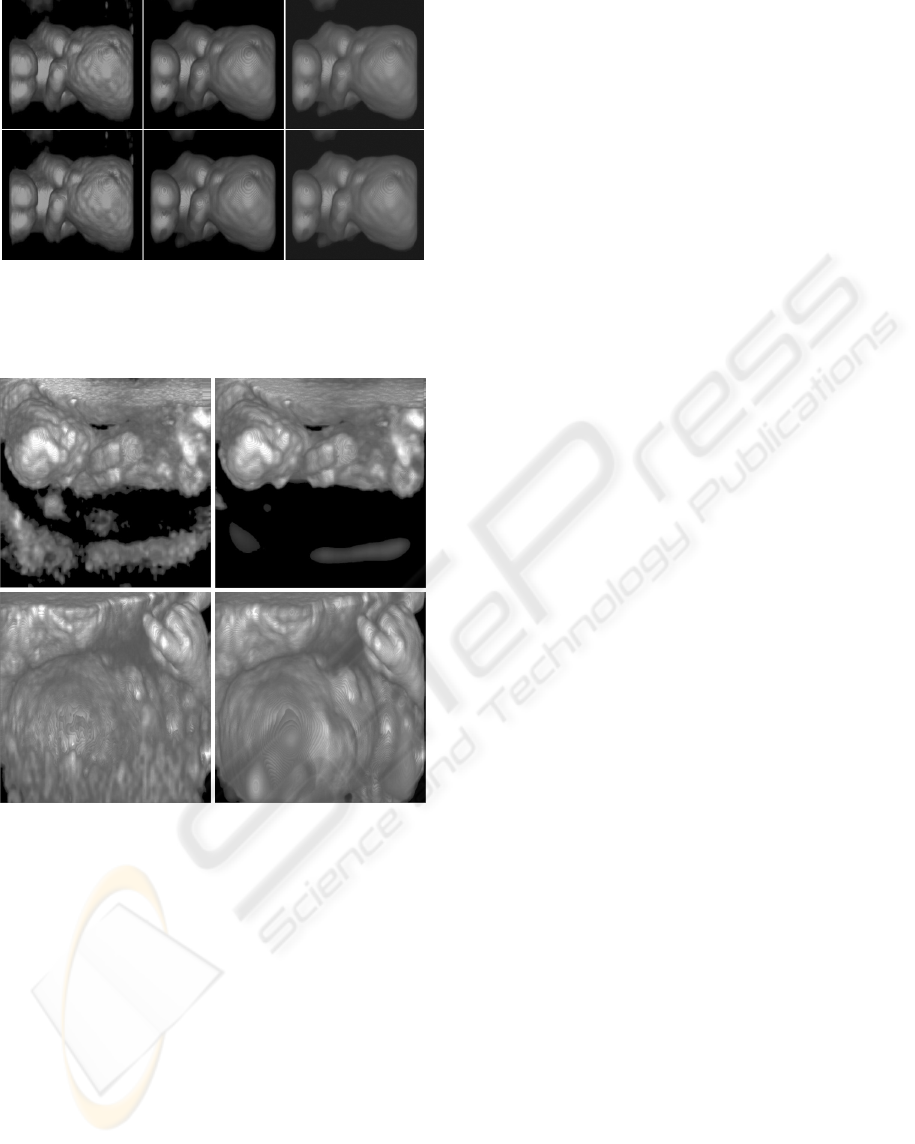
Figure 5: Result images of our method. CPU-based
method (top row) and CUDA
TM
-based method (bottom
row). Images from row data (left), Images when applying
3
3
average filter (middle) and 5
3
average filter (right).
Figure 6: Comparison of images with region-based me-
thod. Result image without region-based method (left) and
with our method (right). Some fuzzy structures are re-
moved efficiently when we use our method.
5 CONCLUSIONS AND FUTURE
WORK
3D visualization of ultrasound data is difficult be-
cause the quality of the data might be degraded by
artifact and speckle noise. We present a real-time 3D
filtering for ultrasound datasets using CUDA
TM
technology. We can interactively visualize an ultra-
sound dataset from the data gathering stage to the
rendering stage. The fast processing of ultrasound
data is good for diagnosing patient interactively. As
a result, our approach enables interactive visualiza-
tion of ultrasound datasets. It is helpful that doctor
can manipulates ultrasound system dynamically and
find optimal information interactively.
In the future we plan to build up the integrated
ultrasound system with GPU for interactive applica-
tion. This system will be included with interactively
ultrasound data acquisition module from prove, real-
time ultrasound rendering module using GPU, filter-
ing module using our method and efficient GUI
(Graphical User Interface) for medical staff. Addi-
tionally, we would like to investigate the integration
of our interactive approach with methods for auto-
mated noise detection.
REFERENCES
Burckhardt, C., 1978. Speckle in ultrasound B-mode
scans. In IEEE Transactions on Sonics and Ultra-
sonics.
Coppini, G., Poli, R., Valli, G., 1995. Recovery of the 3-D
shape of the left ventricle from echocardiographic
images. In IEEE Transactions on Medical Imaging.
Dunn, F., 1991. Ultrasound. In IEEE Transactions on
Education.
Evans, A., Nixon, M., 1993. Speckle filtering in ultra-
sound images for feature extraction. In International
Conference on Acoustic Sensing and Imaging ′93.
Fattal, R., Lischinski, D., 2001. Variational classification
for visualization of 3D ultrasound data. In Proceed-
ings of Visualization ′01.
João, M., Jorge, S., 2003. A 3D Ultrasound system for
medical diagnosis. In Pattern Recognition and Image
Analysis, First Iberian Conference IbPRIA 2003.
Springer Verlag LNCS Press.
Kim, C., Oh, J., Park, H., 1999. Efficient volume visuali-
zation of 3-D ultrasound image. In Proc. SPIE Medi-
cal Imaging.
Kuo, J., Bredthauer, G., Castellucci, J., Von Ramm, O.,
2007. Interactive volume rendering of real-time three-
dimensional ultrasound images. In IEEE Transaction
on Ultrasonics, Ferroelectrics and Frequency Control.
Krüger, J., Westermann, R., 2003. Acceleration techniques
for GPU-based volume rendering. In Proceedings of
the 14th IEEE Visualization ′03.
Levoy, M., 1988. Display of Surface from volume data. In
IEEE Computer Graphics and Applications.
Torre, V., Poggio, T., 1986. On edge detection. In IEEE
Transactions on Pattern Recognition and Machine
Intelligence.
HEALTHINF 2010 - International Conference on Health Informatics
476
