
ESTIMATION OF GROWTH OF OVARIAN FOLLICLES USING
RIGID AND ELASTIC ULTRASOUND IMAGE REGISTRATION
Sebastijan Šprager, Boris Cigale and Damjan Zazula
System Software Laboratory, Faculty of Electrical Engineering and Computer Science
Smetanova ulica 17, 2000 Maribor, Slovenia
Keywords: Medical image processing, 3D ultrasound volume, Ovarian follicle, Image registration, Ovarian follicle
growth assessment.
Abstract: In this paper, a method for assessment of the ovarian follicle growth is presented. 3D ultrasound volumes of
ovaries are processed. Ovarian follicles are shown as hypoechogenic areas in the cross-section images. In
first phase, global translations and rotations of two observed follicle constellations from two consecutive
ovary examinations are detected. In second phase, detailed local deformations are estimated using elastic
registration. The proposed method has been tested using artificial simulated models of ultrasound images of
ovaries. Preliminary results shows the proposed method is efficient and reliably detects deformations
ovarian follicles cause by their growth.
1 INTRODUCTION
Ultrasound plays a very important role in medical
diagnostics. Non-invasive observations of vital parts
of human body and their changes are feasible. Our
research was focused on observation of
deformations of ovarian follicles due to their growth
using ultrasound examinations. The growth and
decaying of ovarian follicles can be observed using
3D ultrasound images today, acquired also in several
consecutive examinations of the same woman.
Speckle noise deteriorates ultrasound images and
complicates visual observation of such growth
changes. Our goal was to build a method to compare
two 3D ultrasound volumes and estimate possible
differences between the follicles and indicate those
deformations that result from the growth or decaying
of an ovarian follicle.
Most of published researches deal with a large
number of 3D ultrasound images acquired in short
and successive time intervals. An example of such a
method is presented in (Chandrashekara et al.,
2004), where the MR images are marked with
points for alignment in a registration. After the
registration, changes in the position of those points
indicate deformations of observed tissues.
Changes in image contents can be sought for by
image registration. Image registration belongs to the
fundamental methods of medical image processing.
By definition, image registration is a process of
overlaying two or more images that show similar
scene, but they are acquired at different times,
different perspectives, or with different sensors
(Zitova and Flusser, 2003). Matching of registered
images should be optimal in the sense of finding the
best fit between two images when using geometric
transformations.
Image registration methods are divided in two
larger groups: rigid registration methods and non-
rigid or elastic registration methods (Maintz and
Viergever, 1998). Rigid registration methods allow
only affine geometric transformations, mostly only
limited to rotations and translations.
Transformations are defined global for the whole
image. Elastic registration is searching for the best
fit between two images by compensating local
deformations, so that the difference between the two
images when aligned is minimal according to a
chosen metric (Crum et al., 2004).
Our situation is more complicated than the
published solutions. If a set of images with small
deformations is available, we can determine these
deformations by observing only the differences
between chronologically successive images. But
such iterative method fails, when only few images
are available, such as ovarian examinations
333
Šprager S., Cigale B. and Zazula D. (2010).
ESTIMATION OF GROWTH OF OVARIAN FOLLICLES USING RIGID AND ELASTIC ULTRASOUND IMAGE REGISTRATION.
In Proceedings of the Third International Conference on Bio-inspired Systems and Signal Processing, pages 333-338
DOI: 10.5220/0002757803330338
Copyright
c
SciTePress

separated by a longer time interval and, thus,
differing by large changes.
This is the starting point of our research. To
better understand the boundaries, we modelled the
described large changes in simulated ovarian follicle
ultrasound volumes. The approach is described in
Section 2. In Section 3, we present the methodology
proposed for the detection of the ovarian follicle
growth. The obtained results are analyzed in Section
4. The paper is concluded in Section 5.
2 SIMULATION MODEL
FORMULATION
In Section 1, we presented the most common
concept in searching for the tissue deformation by
using a registration of successive images. When the
ultrasound recordings do not contain highly similar
consecutive images, different solutions are
necessary. In the case studied in this paper, two 3D
ultrasound images of ovaries are acquired at
different times. They are considered an initial and a
final volume. The differences between those images
can be considerable; it is possible, that some of the
follicles grow fast, some of them are slower, some of
them decay, and even new follicles can appear
sporadically.
The main task when searching the growth
changes is to verify the similarity between two
constellations of follicles by comparing, i.e.
registering them respectively. We presume that a
combination of a rigid and an elastic registration can
point out the deformations of follicle shapes due to
their growth. The rigid registration is supposed to
insert the volume of the initial follicle into the final
volume spatially centralised. The remaining
differences between the two volumes must, then,
correspond to the volume differences of the
compared follicles. We suggest to locate the
differences by using elastic registration.
The aforementioned suppositions do not hold in
general. Therefore, we have to define and took into
account some realistic constraints. The most
important says that follicles grow in all spatial
directions with the same probability. In such cases, a
rigid registration of two constellations of follicles,
which aligns the follicle centroids and axes, inserts
the initial follicle volume into the changed,
increased volume in such a way that the differences
of the volumes indicate the follicle growth. Our
experiments followed, and verified, this idea.
The simulations carried out are described in the
next subsection. A description of a two-step
detection of follicle growths follows next.
2.1 Simulation of Ultrasound Volumes
For statistical evaluation of proposed method we
would have to accomplish statistical relevant amount
of trials, for example Monte Carlo methodology
with included set of all possible changes between
two 3D ultrasound images of ovarian follicles. This
would lead in an increased time complexity of
simulation – creation one of the simulated 3D
images lasts few hours, as long as elastic
registration.
To achieve the most efficient validation of
method for growth assessment, the models of
ultrasound volumes of ovarian were built with use of
simulation. One model represents a set of five
simulated ultrasound volumes with different
constraints. Those volumes represent volumes
acquired in successive time intervals. The presented
models were built with purpose to determine what
are the maximum deviations of the follicles from the
follicles in the initial volume for efficient estimation
of their deformation.
In each model an initial volume represents the
source for other four volumes. The second volume is
deformed version of first one, the third volume is
deformed version of second one, etc. This kind of
deformations represents growth of ovarian follicles
that appear in the real world. Different deformation
types are used for each model. The properties of
model deformation are described in the next
subsections.
2.1.1 Model Construction
Ovarian follicles are in initial volume represented as
ellipsoids in 3D space, corresponding to basic shape
of ovarian follicles. Generated ellipsoids were then
deformed with local transformation; each reference
point of the mesh, which describe an ellipsoid, was
translated for a small vector, where each component
was generated from normal random distribution
within interval ±10% according to the size of the
ellipsoid. The deformed ellipsoids are very similar to
the real ovarian follicles. After generating volumes
of ellipsoids, the ultrasound noise was applied to
each volume with use of program simulator called
Field II (Jensen, 1996). The size of each volume was
100 × 100 × 100 voxels.
In the same manner we created other four
volumes that stand for final volumes of follicle
growths. Every final volume is a version of the
initial volume, deformed with global and local
BIOSIGNALS 2010 - International Conference on Bio-inspired Systems and Signal Processing
334

deformations. These deformations are a global
rotation, additional rotations of individual follicles,
local deformations as a consequence of growth or
decaying of follicles, and additional local
deformations with random translation of the
reference points of the ellipsoids, as described in
previous paragraph. Constraints are described in the
next subsection.
2.1.2 Constraints
For each volume in the model we applied global
rotation according to its previous state. Each angle
of rotation was selected randomly from normal
distribution within interval ±10°. Global translation
was not applied. Each of ovarian follicles were
rotated individually with angles selected randomly
from normal distribution within interval ±10°. Also
in this case translation was not applied.
Local deformations caused by the growth or
decaying of ovarian follicles are represented by the
variations of the size and shape of each follicle. The
size of each follicle varies uniformly in all
directions, which illustrates the real growth of
ovarian follicles. The amount of variation is selected
randomly within the interval from 1% to 20% of the
follicle size for increases, and within the interval
from -1% to -20% of the follicle size for decreases.
2.1.3 Model Description
For our experiment, two models of ovarian follicles
were created. Model 1 contains three round-shaped
ovarian follicles. Follicles f1 and f2 have similar
size, follicle f3 has a size of one third of the size of
f1 or f2. The changes applied to the follicles cause f1
increase, f2 and f3 decrease, while f3 eventually
almost disappears. Model 2 also contains 3 follicles
that are in this case oblong-shaped. Follicles f1 and
f2 have similar size, whereas the follicle f3 has size
of 80% of f1 or f2. Follicle f1 grows, follicles f2 and
f3 decay. Also in this model f3 almost disappears
eventually.
3 METHODOLOGY
As mentioned, the proposed method for detecting
discrepancies between two ultrasound volumes is
based on a two-step registration. In the first step, we
apply the rigid registration between the initial and
final volume. The aim of this registration step is to
compensate global differences (rotation and
translation of the whole volumes of ovarian
follicles). Different probe directions, i.e. angles of
acquisition can cause such differences. Furthermore,
we have to recognise local differences that
correspond to the growth or decaying of ovarian
follicles. In an ideal case, the rigid registration
locates the basic position of the initial volume within
the final volume, because the final volume grow
from the initial volume in all spatial directions with
the same probability.
Our experiments deploy simulations local
follicle deformations. For detecting these, we
applied elastic registration of initial and final
volumes right after rigid registration. It has to be
emphasised that local follicle deformations may
significantly influence the error of rigid registration
(from a global point of view). The error appears as
an additional contribution to the actual local
differences. Again, our purpose was to discover the
amount of local deformations, i.e. the follicle
growth.
The proposed two-step detection method can be
described by the following equation:
,
,
(1)
where
represents the initial volume,
represents
the i-th final volume (
2,3,4,5
),
represents
the initial volume registered using the rigid
registration on the i-th volume, and
stands for
the same volume after the elastic registration
applied. Each performance of the proposed method
is named a trial. The same labeling and naming
convention will be used in the section with results.
3.1 Rigid Volume Registration
We used a new method for rigid registration which
registers two different constellations of ovarian
follicles (Cigale, 2007). Rotation and translation are
handled separate in 3D frequency space. We search
the rotation first and only then the translation.
Rotation is being sought in the amplitude part of
frequency spectrum by applying spherical
correlation. The rotation angle is found where the
two frequency amplitude spheres have best fit.
Reliability of the method increases through
consecutive iterations at different distances of the
observed frequency spheres from the coordinate
system origin. The translation between the compared
volumes is calculated by generalized cross-
correlation. The obtained transformation matrix is
improved by the progressive approach algorithm
(Cigale, 2007).
Cross-correlation based on spheres in 3D
frequency space becomes unreliable when large
differences appear between the compared volumes
ESTIMATION OF GROWTH OF OVARIAN FOLLICLES USING RIGID AND ELASTIC ULTRASOUND IMAGE
REGISTRATION
335

(for example, when new follicles appear). The
problem is solved by comparing the two chosen
frequency spheres of initial and final volume in a
multiresolution scheme. The volumes are processed
by wavelet transform, using the Mexican hat mother
wavelet. Volume registered is based on wavelet
coefficients, descending from higher to lower scales.
The method details are revealed in (Cigale, 2007)
and (Cigale and Zazula, 2004).
Rotation in 3D is described with 3 angles. We
implemented a special transformation to transform
the 3 angles into one single spatial angle denoted by
. This angle between two rotations is defined by
quaternions:
Θ 2arccos
|
|
,
(2)
where
|
|
represents dot product of quaternions
for two observed rotations. Quaternion we
describes a rotation around unit vector for angle
as cos
α
/2,sin
α
/2 (Cigale, 2007).
Vector is taken as space diagonal, so that all the
applied rotations are limited to this diagonal.
3.2 Elastic Volume Registration
Rigidly registered initial and final volumes enter an
elastic registration in the next algorithm step. We
used an approach based on locally invariant speckle-
noise mean in compared ultrasound volumes (Yue et
al., 2009), (Šprager and Zazula, 2008). The
difference between compared volumes can be
described with the following deformation model:
β
,
(3)
where designates a voxel,
deformation
parameters, and h the distance, in voxels, between
two B-spline knots, denoted by β
(Kybic and
Unser, 2003).
Optimal elastic registration is being sought by
modifying the deformation parameters that affect the
surroundings of voxel . The appropriate
deformation parameter values are being sought by
the L-BFGS-B optimization algorithm (Zhu et al.,
1997). Objective function is represented in the
following equation:
E
1
N
lnexp2
1
,
(4)
where
represents a difference between initial
and final volume (Yue et al., 2009). The registration
procedure is iterative; the initial volume is fitted the
to final volume. The procedure terminates when
differences between the volumes decrease below a
predefined threshold.
Elastic registration computes a deformation field
, which contains displacement vectors for each
voxel. We used those displacement vectors as the
estimate of deformations, that probably result from
the ovarian follicle growth.
3.3 Efficiency Estimation
For estimation of efficiency of ultrasound image
registration, a ρ
(1)
ρ
(2)
metric is suggested in (Cigale,
2007), (Cigale and Zazula, 2004). The ratio ρ
(1)
compares the intersection volume of the two
registered volumes to the final volume. The ratio ρ
(2)
compares the intersection volume of the two
registered volumes and the initial volume. The ratio
values lie between 0 and 1. Value 1 represents fully
covered volumes. ρ
(1)
also corresponds to sensitivity
and ρ
(2)
to specificity. The larger their product, the
better is the resulting registration matching.
We used this efficiency measure to evaluate the
performed registrations, both the rigid and elastic
ones.
4 RESULTS AND DISCUSSION
As explained in section 2, for evaluation of our
method we have built 2 models. Each model
contains 5 volumes acquired in successive time
intervals – first volume is called as initial, other 4
volumes represent final volumes. The deformation
of the follicles is growing with increasing of time
interval. For each model 4 trials were performed.
The trial was performed between initial volume and
each of the final volumes. The main purpose was to
find out the maximum deviation of the size and
shape of the follicles for accurate estimation of the
deformations.
As explained in Section 2, an efficient rigid
registration is the main precondition for an accurate
detection of volume changes. It has to result reliably
aligned centroids of initial and final volumes, and
their axes as well. Therefore, two metrics are
presented as a result which shows the efficiency of
rigid registration.
In Table 1, the difference between the detected
rotations of the compared volumes are presented.
Rotation angles estimated from rigid registration
must coincide with the actual rotation angles
generated for the simulated ultrasound volumes. The
difference between those two rotation is expressed
with angle Θ, as described in Subsection 3.1. The
BIOSIGNALS 2010 - International Conference on Bio-inspired Systems and Signal Processing
336
smaller the angle, the better the result of rigid
registration. The angles in the trial 2, 3, 4 and 5
deploying model 1 are acceptable, only the 5-th
experiment with model 2 differs significantly.
Table 1: Angle Θ between two rotations retrieved from
transformation matrix
of simulated volumes and
transformation matrix of rigid registration
for each
trial. The smaller the angle, the better the result of rigid
registration.
Model 1 Model 2
Θ
,
10.76209 6.35026
Θ
,
22.54942 38.26064
Θ
,
22.05884 16.46824
Θ
,
177.90060 31.03795
Table 2: Distances, in voxels, between the follicle
centroids, , of the final volume and rotated initial volume
after rigid registration for each trial.
Model 1 Model 2
,
follicle 1 11 4
follicle 2 5 4
follicle 3 6 3
,
follicle 1 5 3
follicle 2 3 5
follicle 3 3 2
,
follicle 1 66 3
follicle 2 1 3
follicle 3 2 7
,
follicle 1 73 7
follicle 2 2 11
follicle 3 3 4
The second and the most important metric is
difference between centroids of final volume and
rotated initial volume after rigid registration. From
Table 2, we can see that the distance between
centroids grows with the increased time distance
between the recordings of the compared volumes. In
both models, the only problematic follicle is f1 in
the 4-th and 5-th trial with the first model, the
follicle that is disappearing. These results cannot be
taken as properly recognised positions. If an error
threshold is set at 5%, at least the results of the first
3 trials can be considered correct.
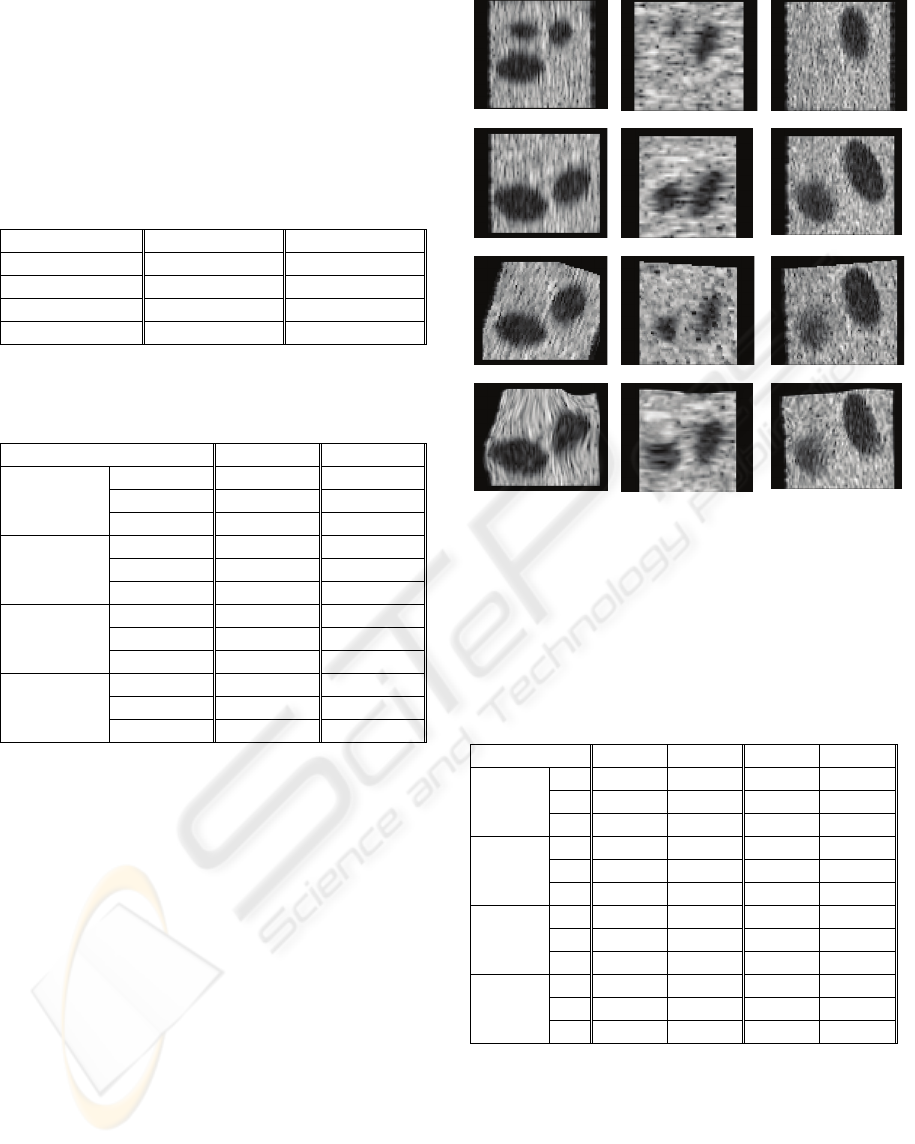
The elastic registration which followed the rigid
one revealed local differences between initial and
final volume. In Figure 1, all steps of the proposed
method is shown on the example. The slices of
model 2 are presented. Slices are positioned in the
centroids of all three follicles. Differences as they
develop through the phases are clearly visible.
a)
b)
c)
d)
Figure 1: Slices of ultrasound volume as examples through
the steps of deformation estimation method. Row (a)
shows initial volume, b) shows final volume, c) shows
final volume after rigid registration and d) shows final
volume after elastic registration. Triples of slices
correspond to the intersections through the ultrasound
volumes at the positions of the centroid of three generated
follicles.
Table 3: ρ
(1)
ρ
(2)
metric for both models.
M1
r
M1
e
M2
r
M2
e
ρ
(1)
ρ
(2)
f1 0.0692 0.0861 0.6426 0.7826
f2 0.5019 0.5478 0.6552 0.7673
f3 0.3801 0.5129 0.5421 0.6376
ρ
(1)
ρ
(2)
f1 0.0385 0.0504 0.5855 0.5890
f2 0.4956 0.5636 0.5230 0.5307
f3 0.2869 0.4554 0.5765 0.5829
ρ
(1)
ρ
(2)
f1 0.0000 0.0000 0.4641 0.4658
f2 0.4697 0.6282 0.4676 0.4700
f3 0.7037 0.6996 0.3626 0.4020
ρ
(1)
ρ
(2)
f1 0.0000 0.0000 0.3701 0.7313
f2 0.5596 0.5274 0.3194 0.4320
f3 0.5830 0.7258 0.3372 0.4013
The efficiency of elastic registration is also
estimated by two metrics. Metric
ρ
(1)
ρ
(2)
is described
in Subsection 3.3. Results are shown in Table 3. It is
clear that the value of
ρ
(1)
ρ
(2)
ratios worsen when the
time distance between the volumes increases, what
under the assumption, that the centroids and axes of
the follicles are aligned, represents the difference
between two observed follicles.
ESTIMATION OF GROWTH OF OVARIAN FOLLICLES USING RIGID AND ELASTIC ULTRASOUND IMAGE
REGISTRATION
337

Table 4: Differences, in voxels, in the follicle axes lengths,
comparing the calculated follicle positions after both
registrations with their initial volumes. The smaller the
difference, the smaller the error of the estimation of the
follicle local difference.
Model 1 Model 2
,
f1(x,y,z) 14 1 4 1 2 3
f2(x,y,z) 12 2 5 0 0 1
f3(x,y,z) 3 1 2 0 0 0
,
f1(x,y,z) 17 3 6 1 0 2
f2(x,y,z) 14 1 5 1 1 0
f3(x,y,z) 4 1 2 2 2 0
,
f1(x,y,z) 20 6 9 2 2 5
f2(x,y,z) 16 3 9 1 2 1
f3(x,y,z) 5 2 4 1 0 2
,
f1(x,y,z) 24 6 11 8 8 9
f2(x,y,z) 23 7 14 0 0 2
f3(x,y,z) 6 3 6 0 2 1
Table 4 shows a metric which represents the
error of the local difference estimation. The error is
expressed as the difference in voxels between
lengths of overlapping axes of the follicles after the
simulation and after the performance of the proposed
methods. Follicles were are aligned in the centroids
and in all 3 coordinate directions. As expected,
errors grow when the time interval between the
compared volumes increase. As we already seen in
the Table 2, follicle f1 in model 1 is problematic due
to its shape, but the estimation for other two follicle
is quite accurate (errors between 5% and 12%). The
results for model 2 are entirely better. In the second
trial, the error is practically negligible, and also by
the last one reaches an error as low as only about
3%. This situation shows that the estimation
accuracy strongly depends on the shape and
deformation intensity of the ovarian follicles. If an
error threshold is set at 5% and centroids and axes
are correctly aligned, the results of the first 3 trials
can be considered correct, what means that in our
case the difference between follicles does not exceed
20% of their size.
5 CONCLUSIONS
The proposed method for ovarian follicles
deformation detection is implemented by using a
rigid and an elastic registration of 3D ultrasound
images. Firstly, we detect rigid deformations of
ovarian follicles represented with rotation angles.
Finally, a detection of local differences between
follicles is presented.
We have discovered that the performance of the
proposed method depends on the shape and the
deformation intensity of the compared volumes. As
could have been expected, the results are better
when the follicle changes are smaller. Our
experiments confirm the proposed method can detect
the growth changes of follicles if the differences
between follicles in the two observed constellations
do not exceed for about 20% of their size.
REFERENCES
Cigale, B., 2007. A Multiscale Approach to Detection and
Growth Assessment of Structures in 3D Ultrasound
Volumes, Ph. D. thesis, University of Maribor, Faculty
of Electrical Engineering and Computer Science.
Cigale, B., Zazula, D., 2004. Segmentation of Ovarian
Ultrasound Images Using Cellular Neural Networks,
International Journal of Pattern Recognition and
Artificial Intelligence, 18, 4, 563-581.
Šprager, S., Zazula, D., 2008. Registration of Ultrasound
Images Based on Locally Invariant Speckle-Noise
Mean, ERK 2008, B, 261-264.
Zitova, B., Flusser, J., 2003. Image registration methods: a
survey. Image and Vision computing, 21, 977-1000.
Kybic, J., Unser, M., 2003. Fast Parametric Elastic Image
Registration. IEEE Transactions on Image Processing,
12, 11, 1427-1442.
Yue, Y., Clark, J. W., Khoury, D. W., 2009. Speckle
Tracing in Intracardiac Echocardiography for the
Assessment of Myocardial Deformation. IEEE
Transactions on Biomedical Engineering, 56, 2, 416-
425.
Zhu, C., Byrd, R. H., Nocedal, J., 1997. L-BFGS-B –
FORTRAN routines for large scale bound constrained
optimization. ACM Transactions on Mathematical
Software, 23, 4, 550-560.
Chandrashekara, R., Mohiaddin, R. H., Rueckert, D.,
2004. Analysis of 3-D Myocardial Motion in Tagged
MR Images Using Nonrigid Image Registration. IEEE
Transactions on Medical Imaging, 23, 10, 1245-1250.
Maintz, J. B. A., Viergever, M. A., 1998. A Survey of
Medical Image Registration. Medical Image Analysis,
2, 1, str. 1-37.
Crum, W. R., Hartkens, T., Hill, D. L. G., 2004. Non-rigid
Image Registration: Theory and Practice, 77, 140-153.
Jensen, J. A., 1996. Field: A Program For Simulation
Ultrasound Systems, 10th Nordic-Baltic Conference
on Biomedical Imaging, 351-353.
BIOSIGNALS 2010 - International Conference on Bio-inspired Systems and Signal Processing
338
