
INTERFACE USABILITY OF A VISUAL QUERY LANGUAGE
FOR MOBILE GIS
Haifa Elsidani Elariss and Souheil Khaddaj
Faculty of Computing, Information Systems and Mathematics, Kingston University London, Kingston upon Thames, U.K.
Keywords: International Visual User Interface, Spatio-temporal Databases and Mobile Phone Applications.
Abstract: In recent years, many non-expert mobile applications have been deployed to query Geographic Information
Systems (GIS) in particular Proximity Analysis that are concerned with the user who asks questions related
to his current position by using a mobile phone. Thus, the new Iconic Visual Query Language (IVQL) has
been developed and evaluated using a tourist application based on the map of Paris. The evaluation has been
carried out to test the various usability aspects such as the expressive power of the language, the query
formulation, and the user interface (GUI). The evaluation of the user interface that is hereby presented has
been implemented through the user satisfaction of two subject groups, programmers and non-programmers.
The results show that subjects found that the IVQL GUI has an excellent software, a good organization if
icons, and is satisfying, with no significant difference between the two groups. The subjects also reported
that they found the learning to operate the system easy, exploring new features easy, remembering the use of
the icons easy, and performing tasks straightforward.
1 INTRODUCTION
Geographic Information Systems (GIS) are
computer-based tools used to handle the geo-
features. In Field Worker Services, they are used by
fire fighters, emergency workers, inspectors, and
utility crews (Fidel, 2007). In road networks, they
provide the ability to organize public transportation
(Repenning, 2006), and query moving objects
(Guting, 2006). Mobile GIS are typically used in
tourist and navigation systems for Proximity
Analysis which includes querying the k Nearest
Neighbour (kNN) and finding the facilities that are
located within a buffer area. The existing Mobile
GIS applications have textual or menu-driven input
but do not provide a user friendly environment and
are aimed at expert users only. Thus, with the urgent
need to develop a visual query language that
provides the mobile user with the facility to
formulate a visual query using expressive icons, an
Iconic Visual Query Language (IVQL) has been
developed using a tourist GIS system. The
evaluation implementation, results, and conclusions
are hereby presented.
2 RELATED WORK
In this section we briefly describe some of the state
of the art visual query languages showing some of
their advantages as well as limitations.
LVIS (Bonhomme, 1999) is a visual query
language for spatio-temporal databases. Metaphors
are used for Querying Visually Spatio-Temporal
Databases (Bonhomme, 2000). The user builds a
visual query by selecting a combination of the icons
(Bonhomme, 2002). Psycho-cognitive tests have
been developed to measure the comprehension of the
metaphors. Two subject groups were chosen:
persons working with GIS and persons who are non-
experts. The results of the experimentation have
shown that the recognition of metaphors is effective
to users without prior experience with GIS. The
results showed that the subjects were able to
recognize the relationship between spatial objects
easily and that the metaphors are well accepted by
both populations.
The Filter-flow (Morris, 2004) and (Morris,
2002) is a visual query language and interface for
large spatial databases. The results of the evaluation
showed that the Filter-flow simplified the learning
process and made the query expression easier.
339
Elsidani Elariss H. and Khaddaj S. (2010).
INTERFACE USABILITY OF A VISUAL QUERY LANGUAGE FOR MOBILE GIS.
In Proceedings of the 12th International Conference on Enterprise Information Systems - Databases and Information Systems Integration, pages
339-342
DOI: 10.5220/0002763903390342
Copyright
c
SciTePress
The above visual query languages have
demonstrated a considerable improvement in the
field. However, none of the above is able to provide
the user with the ability to formulate dynamic
complex queries and none takes into account mobile
users. Hence, the evaluation of IVQL has taken into
consideration the various aspects of usability and has
applied both the user testing as well as the user
satisfaction in order to test them. One of the aspects
that have been evaluated in the work is the user
interface (GUI). The evaluation has been done using
the user satisfaction. Its evaluation, results, analysis,
and conclusions are hereby presented. The other
aspects that have been evaluated are the expressive
power as described in (Khaddaj, 2010) and the query
formulation as described in (Elsidani Elariss, 2010).
3 DESCRIPTION OF IVQL
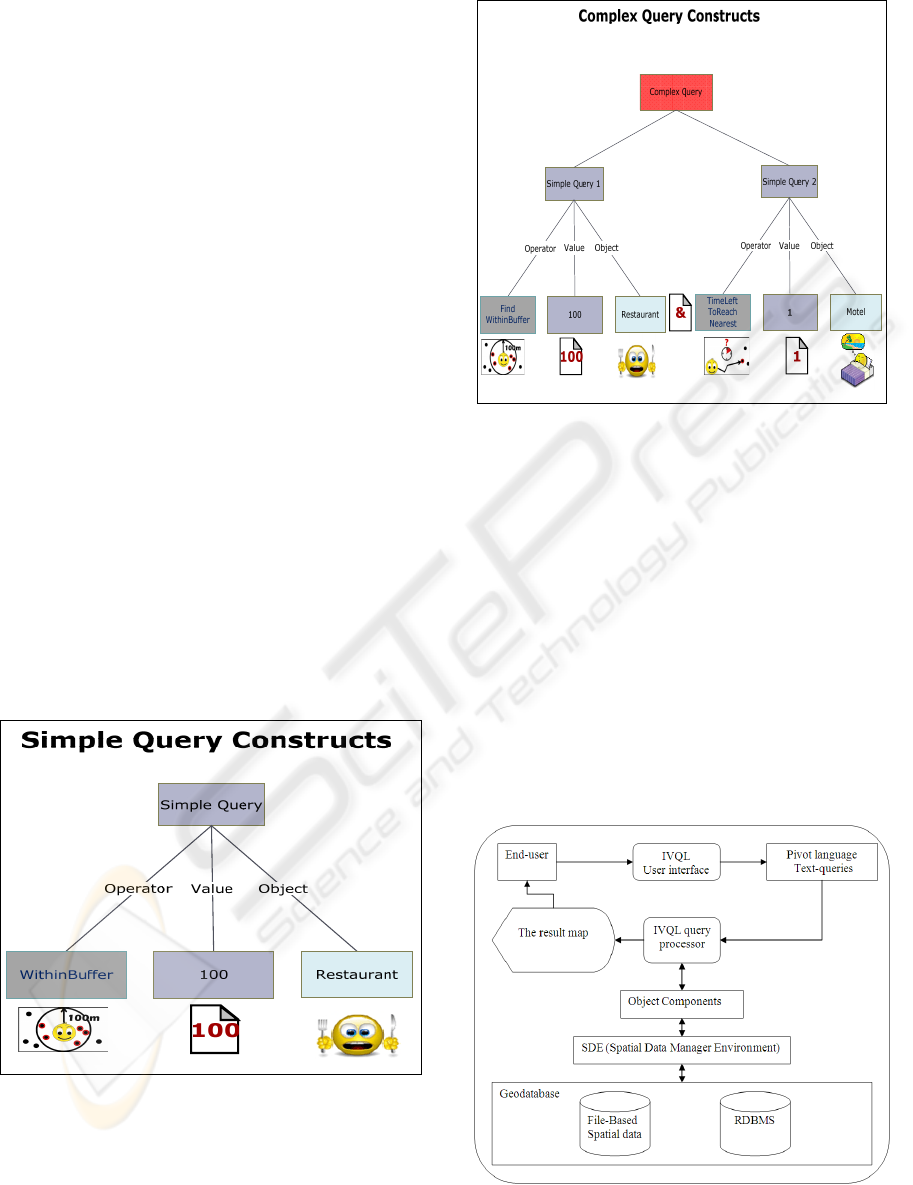
3.1 Query Constructs
The constructs of IVQL are an operator, a value, and
an object. IVQL is based on smiley icons that are
used to visualize operators, values, and objects. A
complex query consists of multiple simple queries
separated by the ‘and’ operator. The new visual
query language is described in (Elsidani, 2006a) and
(Elsidani, 2006b). Figures 1 and 2 show the
constructs of a simple query and a complex one.
Figure 1: Simple query constructs.
Figure 2: Complex query constructs.
3.2 IVQL Architecture
The system consists of a number of components to
process the visual queries. The IVQL user interface
forms the front end of the software. It is installed on
the target mobile device where the user can
formulate the visual query that is translated into a
text query called the Pivot Language where each
icon is replaced by its name, sent to the GIS server
and saved in a file for later processing. The query
processor, which is implemented as a middleware
between the text query and the Geodatabase,
processes each visual query separately as described
in (Elsidani, 2009). The software architecture is
shown in Figure 3.
Figure 3: Software architecture.
ICEIS 2010 - 12th International Conference on Enterprise Information Systems
340
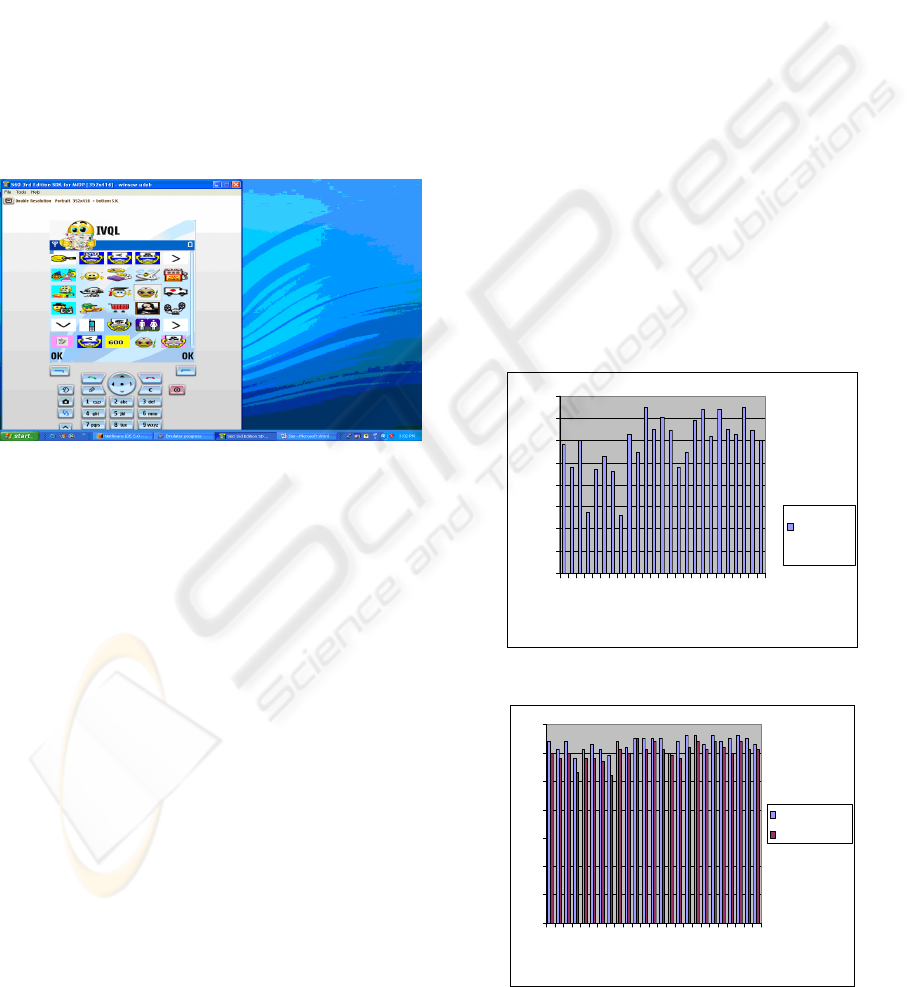
3.3 IVQL User Interface
IVQL provides the user with two major toolbars and
a middle area where objects are displayed and a
query formulation area at the bottom of the interface.
The horizontal toolbar contains the smiley icons that
represent operations. The vertical toolbar displays
icons that represent themes. The middle area
displays the objects of the selected theme. The query
formulation is done first by selecting a smiley icon
from the horizontal toolbar. The icon is
automatically moved to the query formulation area
which appears at the bottom of the interface.
Second, the user selects the object needed. The
selected object is then moved to the query
formulation area. Figure 4 shows the user interface
after formulation.
Figure 4: The GUI after query formulation.
4 IVQL EVALUATION
A questionnaire consisting of twenty five 7-point
Likert scale questions is used to measure the level of
difficulty, user interface, expressive power of the
visual query language, and the query building. The
subjects are 56 undergraduate university students
divided into two 28-subject groups classified as
programmers and non-programmers. The
programmers are familiar with computers and the
non-programmers are not. Their age varies between
18 years and 21 years. The testing session was
conducted in a classroom equipped with 30 desktop
computers, a teacher’s desktop, and an LCD
projector. The NetBeans version 5.0 Software was
installed on all computers with the J2ME Mobility
Pack and the Wireless Toolkit. The emulator
DefaultColorPhone was used to emulate the
prototype of the IVQL user interface. Each session
started with a presentation of the user interface then
each subject was provided with the questionnaire.
Each session lasted around 2 hours.
5 RESULTS AND DISCUSSION
The collected data is represented visually using a
graphical chart namely the histogram bar chart. The
histogram in Figure 5 shows for each question the
mean of the answers and its respective value as
converted to a score over 100. The score 7 means
that the subject had the best and highest preference
and satisfaction whereas the score 1 means that the
subject had the worst and lowest preference and
satisfaction. The mean scores of the two subject
group are compared to check if the is a significant
mean difference. Figure 6 shows the mean scores of
each question of the questionnaire for the
programmers sample group in blue and the non-
programmers in red. The results also reported that
the mean of the questions scores for each of the
programmers group, non-programmers group, and
both groups are respectively 90.4, 85.9, and 88.1 out
of 100. Finally, the t-test statistic is used to compare
the mean scores of each question then of all queries.
Mean of Questionnaire
5
5.2
5.4
5.6
5.8
6
6.2
6.4
6.6
1 3 5 7 9 1113151719212325
Question Number
Lickert Scale out of 7
Mean of
Questionnaire
Figure 5: The average of questionnaire scores.
0
1
2
3
4
5
6
7
1 3 5 7 9 11 13 15 17 19 21 23 25
Question Number
Lickert Scale out of 7
Programmers
Non-Programmers
Figure 6: Averages of each group.
INTERFACE USABILITY OF A VISUAL QUERY LANGUAGE FOR MOBILE GIS
341

The subjects reported that they found the
software 88% excellent, 85% easy, and 89%
satisfying. They found that reading icons on the
screen was 79% easy, that the organization of
information was 85% clear, and that the sequence of
screens was 86% clear. The t-test analysis of each
aspect can report that at the 5% level of significance,
there is no significant difference between the means
of programmers and the non-programmers groups.
Hence, it can be concluded that both groups have the
same level of satisfaction about the user interface.
The subjects reported that they found the selection
of the operators 91% easy, the selection of
categories 93% easy, the selection of objects 89%
easy, building simple queries 93% easy, the queries
90% clear, the queries 89% legible, remembering the
language queries 93% easy, the sequence used to
build the queries 90% easy, and using the ‘and’
operator to formulate complex queries 89% easy.
The t-test analysis of each aspect can report that
there is no significant difference between the means
of programmers and the non-programmers groups.
Hence, it can be concluded that both groups have the
same level of satisfaction about the query building
and formulation. The subjects also reported that they
found the learning to operate the system 93% easy,
exploring new features by trial and error 90% easy,
remembering the names and the use of icons 92%
easy, and performing tasks is 90% straightforward.
The t-test analysis of each aspect can report that
there is no significant difference between the means
of programmers and the non-programmers groups.
Hence, it can be concluded that both groups have the
same level of satisfaction about the expressive
power of the IVQL language.
6 CONCLUSIONS
In this paper the graphical user interface (GUI) of an
Iconic Visual Query Language (IVQL) has been
evaluated. Its constructs, architecture, and user
interface have been illustrated using a tourist
example. An experimental evaluation has been
carried out on two subjects groups to test their user
satisfaction with the various aspects of the GUI. The
results showed that the subjects reported a very good
overall reaction with the system and an excellent
user satisfaction with IVQL’s GUI clarity,
consistency, ease-of-use, and query formulation
process. Finally, the analysis reported that subjects
with different background had the same level of
satisfaction with the user interface, the query
formulation, and the expressive power of IVQL.
REFERENCES
Bonhomme C. and Aufaure M. A., 2002, Mixing Icons,
Geometric Shapes and Temporal Axis to Propose a
Visual Tool for Querying Spatio-Temporal Databases,
In Advanced Visual Interfaces, Trento, Italy.
Bonhomme C., Trepied C. and Aufaure M. A., 2000,
Metaphors for Visual Querying Spatio-Temporal
Databases, In Proceedings of the 4
th
International
Conference on Visual Information Systems. Springer
Verlag, Lecture Notes in Computer Sc., pp. 140-153.
Bonhomme C., Trepied C., Aufaure M. A. and Laurini R.,
1999, A Visual Language for Querying Spatio-
Temporal Databases, In Proceedings of ACM GIS’99,
7
th
ACM Symposium on Advances in Geographic
Information Systems. November 1999. Kansas, USA.
Elsidani Elariss H., and Khaddaj S., Query Formulation of
a Visual Query Language for GIS Applications.
IASTED Software Engineering, Austria 2010.
Elsidani Elariss H., Khaddaj S., and Greenhill D., Query
Melting: A New Paradigm for GIS Multiple Query
Optimization, ICEIS 2009, Italy 2009.
Elsidani Elariss H., Khaddaj S., and Haraty R., Towards a
New Visual Query Language for GIS. IASTED
Databases and Applications, 195-202, Austria 2006.
Elsidani Elariss H., Khaddaj S., and Haraty R., An
Evaluation of a Visual Query Language for
Information Systems, ICEIS (5), 51-58, Paphos 2006.
Fidel R., Scholl H., Liu S., and Unsworth K., Mobile
Government Fieldwork: A Preliminary Study of
Technological, Organizational, and Social Challenges,
Proceedings of the 8
th
annual International
Conference on Digital Government Research
Conference: Bridging Disciplines and Domains,
DGO’07, May 2007.
Guting H., De Almeida T., and Ding Z., Modelling and
Querying Moving Objects in Networks, VLDB
Journal – The International Journal on Very Large
Databases, Vol. (15) 2
Khaddaj S., and Elsidani Elariss H., Expressive Power of a
New Iconic Visual Query Language for Mobile GIS.
IASTED Software Engineering, Austria 2010.
Morris A. J., Abdelmoty A. I., Tudhope D. S., and
ElGeresy B. A., 2004. A Filter-flow Visual Query
Language and Interface for Spatial Databases.
GeoInformatica, 8(2), 107-141.
Morris A. J., Abdelmoty A. I., Tudhope D. S., and
ElGeresy B. A., 2002, Design and Implementation of a
Visual Query Language for Large Spatial Databases,
In Proceedings of the Sixth International Conference
on Information Visualisation (IV’02).
Repenning A., and Ioannidou A., Mobility Agents:
Guiding and Tracking Public Transportation Users,
Proceedings of the Working Conference on Advanced
Visual Interfaces, AVI’06.
Roth J., Detecting Identifiable Areas in Mobile
Environments, Proceedings of the 2006 ACM
Symposium on Applied Computing, SAC’06.
ICEIS 2010 - 12th International Conference on Enterprise Information Systems
342
