
USING OPEN SOURCE TO CREATE A GEOGRAPHICAL
INFORMATION SYSTEM FOR BLOOD DONATIONS
Juliano de Souza Gaspar, João Rolando Azevedo, Jorge Leal, Fábio Hedayioglu
University of Porto, Porto, Portugal
Ricardo João Cruz Correia
CINTESIS – Centre for Research in Health Technologies and Information Systems
Biostatistics and Medical Informatics Department, Faculty of Medicine University of Porto, Porto, Portugal
Keywords: Open source, Geographic information systems, Blood donors, Database management systems.
Abstract: The increasing development of Free/Libre Open Source Software (FLOSS) paradigm has brought a
reduction in the cost of software development and increased its speed, resulting in quality improvement and
constant evolution. Examples of applications that greatly enhance this area are geographic information
systems (GIS). They permit the allocation of raw data or processed information in a map, allowing
contextualization of the information itself and knowledge extrapolation. The transfusion medicine is an
excellent area of health in which one can use a GIS to display the geographic distribution of blood donors
on the map. A FLOSS GIS is feasible in this context thus reducing the high governmental costs in Health
Care Area. The information can be easily displayed without copyrights and other complications. For these
reasons, we decided to develop a platform that allows the display of information relative to the blood
donations. Our goals focused on: researching the state of the art off current status; data manipulation and
processing of the donor’s database; and modelling and developing a program that could show a varied
option of queries that can be done to the database. We used some statistic approach to the data as well as
software implementation. After its completion, it was possible to calculate the distribution of blood donors
and cross reference this with the places of collect. The distribution of the donors by group or area was made
visible for interpretation purposes. Ultimately, the feasibility of such systems is proved and the changes in
blood donation management can represent an important improvement towards good care.
1 INTRODUCTION
1.1 FLOSS in Health Care
The development paradigm using FLOSS has a
significant role in several areas of the market,
however, his use in health care is still limited
(Karopka, 2009). Some of the reasons for this
scenario in the health field are (Karopka, 2009; Rua,
2009; Baj, 2009): a lack of involvement of infield
specialists (doctors, nurses, laboratory technicians,
physiotherapists, etc.), a lack of appropriate training
and knowledge of health professionals about the
importance and benefits of these projects. Also, in
health area, the requirements of security and
reliability are extremely high. With FLOSS, not
always these requirements have clear and defined
rules that ensure health managers they can be
fulfilled.
Despite having to face and overcome these
challenges, FLOSS development has certain features
that allow its viability within the health area. For
example, a FLOSS that is designed and maintained
by the Internet for virtual communities, in which
continuous tests are made, leads to greater reliability
and availability of updates. This allows the health
authority to have access to technologies faster than
in the case of proprietary software (Baj, 2009).
Another advantage is that FLOSS provides more
opportunities for customization and enhancements.
They were able to manipulate the code and
customize it, for example, adapting it to a specific
unit within the entity. These manipulations were not
499
de Souza Gaspar J., Leal J., Rolando Azevedo J., Hedayioglu F. and João Cruz-Correia R. (2010).
USING OPEN SOURCE TO CREATE A GEOGRAPHICAL INFORMATION SYSTEM FOR BLOOD DONATIONS.
In Proceedings of the Third International Conference on Health Informatics, pages 499-504
DOI: 10.5220/0002765904990504
Copyright
c
SciTePress

possible through proprietary technologies (Baj,
2009).
Some of the motivations that drive government
initiatives in this regard are (Fernandes, 2004): ( a )
reduction with initial software and updates; ( b )
increased control and access to intellectual property;
( c ) reduction of trust in organizations of proprietary
software development; ( d ) use of software in the
public sector as public property; ( e ) adaptability
and modularity allowed by open source software to
the needs of each government area or sector of the
same institution.
1.2 Transfusion Medicine
Transfusion Medicine practice has as fundamental
purpose the attainment, availability and accessibility
of blood and its components. They must attain a
desired level of quality, safety and effectiveness.
Still actually, worldwide blood donation is
insufficient to the existing needs (Nilsson Sojka,
2007). The medical investigation and the
technological breakthrough in this sector had a big
boom thus allowing an improvement in this area. In
other hand, the development of a health care
structure, and the differentiation and sophistication
of medical techniques led to an increase on blood
demands. Simultaneously, people are ageing and as
a consequence there is a reduction of people elective
to be donors (from 18 to 65 years) and an increase of
number of people who actually needs blood
components as they grow older.
Other problem, specify from IPS (Instituto
Português do Sangue), is the elevated costs inherent
the definition of places for mobile blood collect
places that present a low rate of donations. These
costs vary from human resources (physicians,
technicians, nurses, drivers, etc.) to equipment,
among others.
1.3 Geographic Information Systems
Geography takes a fundamental role in almost all
decision we made. The choice of places, the
appointing of market segments, the planning of
distribution networks, response to emergencies
scenarios, the redrawing of countries frontiers, all
those problems address geographic issues.
Geographic characteristics such as topography and
geographic dispersion of population are fundamental
factors in fair resources distribution (Leitner, 2002).
GIS crosses regular data and their geographic
position with the purpose of building maps. This
technology allows us to visualize data with different
degrees of complexity in a map. This gives us a
useful way of reveling spatial and temporal relations
between data.
Combining data and applying some analytical
rules, it is possible to create a pattern in order to help
answer the question previously made. The GIS
primary goals in healthcare are (Maged, 2004)
inform and educate health professionals and
population, support decision making in many levels,
prevent results before making any compromises,
select priorities in lower resources environments,
change bad practices and routines and continuously
monitor and watch changes implementations.
Investigators, Public Health professionals, policy
makers and others can use GIS to better understand
geographic relation that affect health results, risks,
disease transmission, health care access and other
public health concerns. They’re being used more and
more often to deal with problems in a local, regional,
national or international overlay (CDC, 2009).
Despite the evident benefits of GIS use, its
dissemination and utilization it’s not yet a
generalized reality. Some possible explanation for
this to happen can be (Rob, 2003): the lack of
consideration towards user needs, elevated cost of
existing applications and the need to learn the way
they function and operate.
At requirement level, we verify an almost total
need of community involvement since the very
beginning. Meaning, users and developers must
work directly together in the project. Only in this
way can projects be realistic, reasonable and
sustainable (Weiner, 2002).
The use of Geographic Information Systems in
the field of Transfusion Medicine can use the data
from donors, more precisely place of residence and
blood type, presenting them in a situation so that
there is an important tool for analysis and support
for resource management more efficient and
facilitates the accomplishment of its objectives are to
operationalize the collection and distribution of
donations. Contextualizing geographically frequency
of donations, facilitates the planning of campaigning
and the collection of blood donation to the needs of
reserves replacement of components at the moment.
1.4 Motivation
The initial motivation to the realization of this
project departed from the fact that the participants
were involved in the health Care area, specifically in
the collect and distribution processes and also being
currently in the Master in Health Informatics study
cycles of the Medicine faculty of Porto University.
HEALTHINF 2010 - International Conference on Health Informatics
500
One of the IPS necessities is to improve the
planning and management of blood collect places
utilizing donors’ geographic analysis without
increasing costs.
2 OBJECTIVES
2.1 General Objective
To create an open source Geographic Information
System that would allow the graphic representation
of the information concerning blood donations.
The Specific Objectives are (a) to facilitate the
analysis, in a geographic context, of the blood
campaign coordination process, (b) to support the
professionals in planning and distributing resources
for mobile collect posts, (c) to help the professionals
define places and dates of mobile collect posts,
according to the need to refill blood components
stoking by blood type, (d) check that can develop
open source software for health and their respective
advantages and (e) to describe the systems creation
process, exploring the motivation, difficulties and
potentialities founded.
3 METHODS
This work can be classified as an applied and
technological (Jung, 2009) research, because its goal
is the development of an application allowing the
graphic representation of blood donations.
Although this work has a statistical approach, it
incorporates qualitative standards. The two
methodologies are used to help carrying the whole
process.
This work followed the following methodology:
Research of Servers of the Maps for a GIS,
functionalities and resources;
Initial data analysis, treatment and statistical
analysis of the data given by the Portuguese,
Blood Institute;
Building a prototype, design and create the
database, design and implement the prototype;
Evaluation meetings with the project team in
order to improve the system;
3.1 Architecture
3.1.1 Requisites Analysis
Taking in account the overall characteristic of this
proposal, the requisites where analyzed and defined
by a multidisciplinary team composed of: a clinical
analysis technician, a nurse and a computing
engineer. For the application, the following
requisites where defined are (a) to show the blood
donation in the map, (b) allow that donation to be
filtered by: Date, District, Council, Lab results,
Collect places, Blood group, Rh factor, Gender,
Age, (c) show the mobile collect posts and (d)
develop the application using open source
technology.
3.1.2 Languages and Development Tools
The development tool uses the programming
language PHP 5.0 and MySQL database. The server
maps to present the results defined by the software
was the Google Maps version 2.0. However
JavaScript and HTML functions will also be used;
In order to fulfill a good usability CSS and
JavaScript JQuery v.1.3.2 framework styles will also
be used. Another resource used is AJAX, which
allows greater interaction with the User.
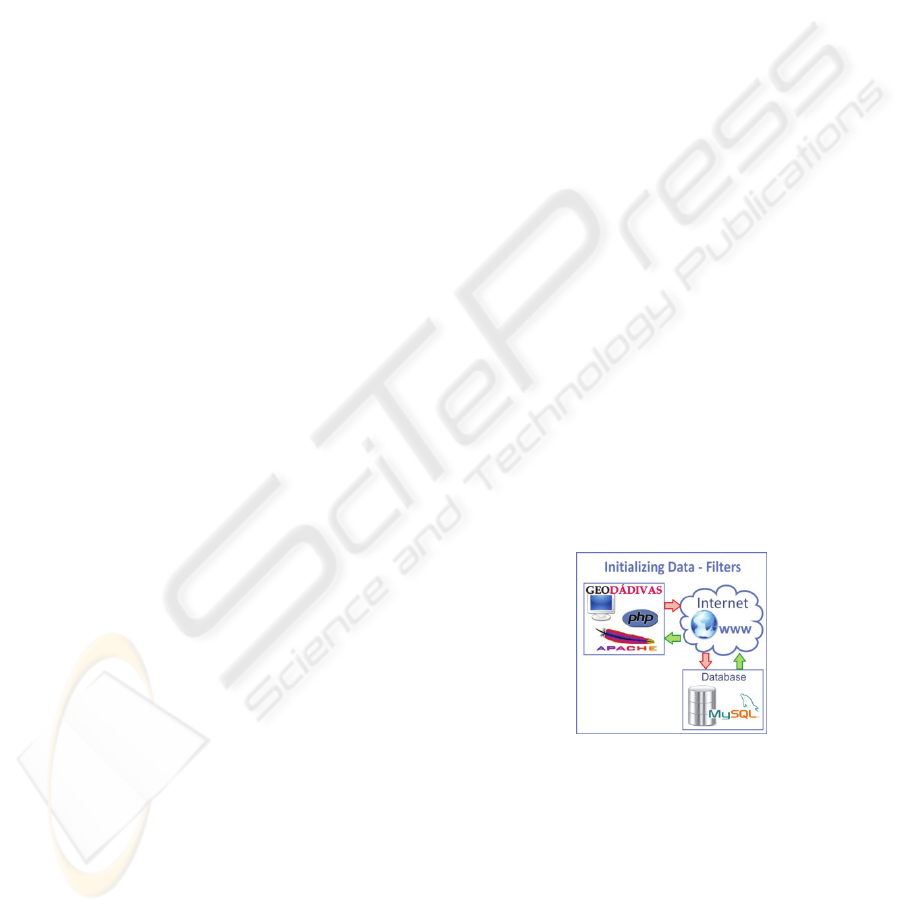
3.1.3 Diagrams
When open, the software executes a query to the
database, to fill the respective fields of the filters, as
showed in figure 1.
Figure 1: Diagram Initializing Data Filters.
Consultation of blood donations, according to the
selected filter, is displayed in the software by
following iterations showed in figure 2.
USING OPEN SOURCE TO CREATE A GEOGRAPHICAL INFORMATION SYSTEM FOR BLOOD DONATIONS
501
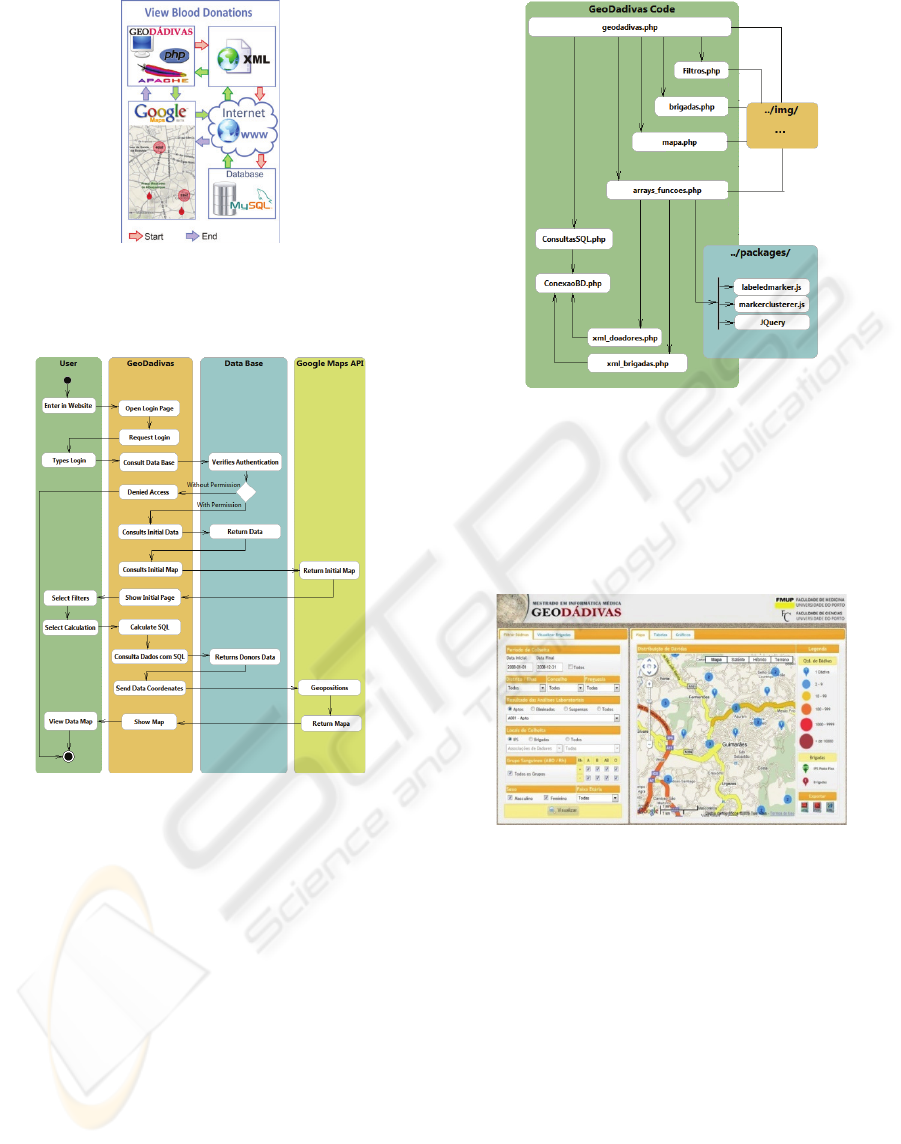
Figure 2: Diagram: View Blood Donations.
The main activities diagram was elaborated
grouping activities by actors, as showed in figure 3.
Figure 3: Activities diagram.
3.2 Implementation
In the diagram in figure 4, one can see the list of
GeoDádivas system files and also the interaction
between them.
The map server chosen for this software was
Google Maps (map visualization free service
utilizing satellite images). Besides maps and satellite
images, it provides routes between pre-determinate
spots, zoom, dragging the map, among others
(Davis, 2006). The simplicity and open source
methodology are its biggest assets. The grabbing and
dragging possibility, increase or decrease zoom
without big delays in the web page are a few of the
simple tasks that favor it.
The functions javascripts labeledmarker.js and
markerclusterer.js and the Jquery library are also
used. All distributed by GNU licenses.
Figure 4: Diagram: Files Interaction.
3.3 Application Interface
The primary interface of the application has three
distinct parts, a header in the top of the page and two
columns, one of filters on the left and another of
results on the right as we can see in figure 5.
Figure 5: Main Application Window.
4 RESULTS
4.1 Data Analysis
The database used for the prototypes refers the blood
donations occurred in the northern region of
Portugal between the years 2000-2008. The initial
analysis revealed that the database possessed
approximately 634000 entries, and were used the
respective variables: date, donor, gender, birth date,
zip code, blood type, Rh factor, triage results, collect
results and lab results. After statistical analysis, we
can verify that the frequencies distribution is similar
to the Portuguese study of blood types (Duran, 2007)
HEALTHINF 2010 - International Conference on Health Informatics
502
in which 46.6% of the population has type A, 3.4%
AB, 7.7% B and 42.3% O.
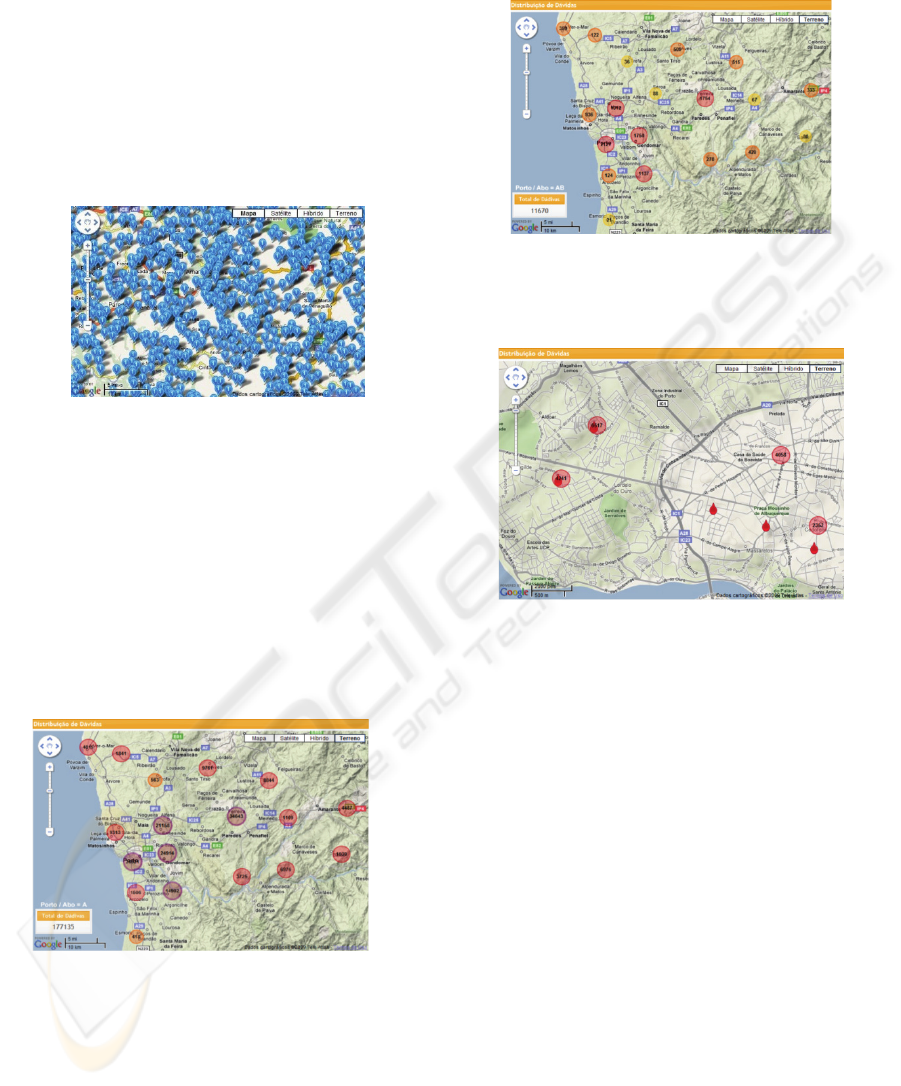
4.2 Clusters
Analyzing the first results, it was noted that no
conclusion can be drawn from first images showed.
Because there were many blood donors, a marker on
the map for each donor had a result as or more
confusing to interpret than looking directly at a table
data, figure 6.
Figure 6: View Blood Donations without Cluster.
From these results, it was defined the need for
developing clusters (aggregating relatively close
donors together, geographically).
4.3 View Blood Donations
In figures 7 and 8 we can see the difference in
existing donors with type A and AB on North
Portugal region. Being AB a more difficult type to
obtain, collect posts positioning can be easily
managed.
Figure 7: Blood group A donation.
4.4 Sapo Summerbits 2009
Software GeoDádivas was one of 10 winners of the
“Projecto Sapo Summerbits 2009” (Software Livre,
2009). This project is inspired by the Google
Summer of Code. In this initiative, scholarships are
awarded to students of Portuguese universities to
develop code to free software projects, existing or
new, that use GNU Licence (Sapo, 2009).
Figure 8: Blood group AB donation.
In figure 9, a most detailed visualization can be
made after a zoom in action.
Figure 9: Detail of Blood collect places in Porto city and
donors distribution.
4.5 Repositories
Repositories where GeoDádivas codes can be found,
as well as their licenses are:
Software Livre:
http://softwarelivre.sapo.pt/geodadivas
Source Force:
http://sourceforge.net/projects/geodadivas
The software is currently hosted in the
CINTESIS and can be used on an experimental basis
as it uses a database of tests:
http://geodadivas.gim.med.up.pt
5 DISCUSSION
After the completion of this work we can realize that
the GIS development is a complex system that needs
much research.
The fact that it was developed by a multi-
disciplinary team was essential towards its
realization. The view of (a) the professional that is
integrated in the entity where the system will be
implemented (Clinical analysis technician),
USING OPEN SOURCE TO CREATE A GEOGRAPHICAL INFORMATION SYSTEM FOR BLOOD DONATIONS
503

combined with (b) the scientific analysis view from
other health care area and (c) the technologic
knowledge of the Informatics professional
constituted an important point in its execution.
As the treatment and data manipulation revealed
itself a difficult task, the software development
became more complex.
We can conclude that all the initial project of
data treatment (analysis, integrity verification,
validation, and comparison with other scientific
studies already done), although having consumed the
majority of time spent, was crucial to final work
quality.
The frequencies of the variables in our system
are consistent with national published studies. This
gives us an additional prove of data integrity quality.
Initial tests revealed that a GIS Open Source
system is feasible in this context. Also we could
realize that Google Maps API can support big
volume of data in each query and Web 2.0
technology and JQuery UI Framework were a good
choice in this experimental project phase, especially
in relation with the user-system interaction.
The cluster method partially solves the graphic
visualization problem, reducing the markers’
quantity relatively close between themselves.
However, after system conclusion, we could verify
that clusters could easily create an optic illusion of
blood donation, when less zoom was utilized.
For future work we suggest that other functions
can be added and existing ones can be improved,
namely:
possible use of colorized polygons that
delimitate cities can be used in replacement of
the cluster solution because they can facilitate
the visual interpretation;
more complex functions to establish relations
between different variables such as calculation
the distance between donor’s houses and
blood collection places;
determine with higher precision the location
of blood collect places with lowest
frequencies that represent high resources
consumption;
relate the population density with blood
donations in certain areas.
ACKNOWLEDGEMENTS
To Dr. Jorge Condeço, Head Chief of the
Informatics/Hemovigilance department of the
CRSP-IPS, IP (PBI, 2009), for all the help and
collaboration in obtaining the data and its treatment,
analysis and comprehension.
REFERENCES
Baj, E., Locatelli, P., Gatti, S., Restifo, N., Origgi, G.,
Bragaia, S., 2009. Open Source: A Lever for
Enhancing Opportunities of Healthcare Information
Systems – An Italian Case Study.
CDC, 2009. Centers for Disease Control and Prevention.
Access in: http://www.cdc.gov/gis/ August 2009.
Davis, S., 2006. Google Map API V2: Adding Where To
Your Applications. The Pragmatic Programmers LLc.
Duran. J. A., Chabert, T., Rodrigues, F., Pestana, D., 2007.
ABO: Distribuição dos Grupos Sanguíneos na
População Portuguesa. Revista de Medicina
Transfusional. Nº 29 - 2007.
Fernandes, A. M. R., 2004. Inteligência Artificial:
Aplicada à Saúde. Visual Books, 2004.
Jung, C. F., 2009. Metodologia Científica: ênfase em
pesquisa tecnológica. 4
th
edition. Access in:
http://www.jung.pro.br/,. August 2009.
Karopka, T., 2009. Building the Free/Libre Open Source
Health Care (FLOSS-HC) Community: A Strategy for
Pushing Free/Libre Open Source in European Health
Care.
Leitner H., McMaster R.B., Elwood S., McMaster S.,
Sheppard E., 2002. Models for making GIS available
to community organizations: dimensions of difference
and appropriateness. In Community Participation and
Geographic Information Systems.
Maged, N., Kamel, B., 2004. Towards evidence-based,
GIS-driven national spatial health information
infrastructure and surveillance services in the United
Kingdom, Bath.
IPS, 2009. Instituto Português de Sangue. Regional Porto
Blood Center Data.
Rob, M. A., 2003. Some challenges of integrating spatial
and non-spatialdatasets using geographical
information system. Information Technology for
Development.
Rua, N., 2009. Free and Open Source in Healthcare:
Enough Waste.
Sapo, Summerbits, 2009. 2ª Edição do SAPO Summerbits.
Acess in: http://labs.sapo.pt/summerbits/blog/2009/07/
08/2ª-edicao-do-sapo-summerbits/ September 2009.
Software Livre, 2009. Projectos seleccionados para o
programa SAPO Summerbits, 2ª Edição, 2009. Access
in: http://softwarelivre.sapo.pt/projects/geral/wiki/
FinalistasSummerbits2009. September 2009.
Sojka BN, Sojka P. The blood donation experience: self-
reported motives and obstacles for donating
blood.Vox Sang. 2008 Jan;94(1):56-63. PMID:
18171329
Weiner, D., Harris, T. M., Craig, W. J., 2002. Community
participation and geographic information systems. In
Community Participation and Geographic Information
Systems. London.
HEALTHINF 2010 - International Conference on Health Informatics
504
