MODELLING STABILOMETRIC TIME SERIES
*
Juan A. Lara, Aurora Pérez, Juan P. Valente
Facultad de Informática, Universidad Politécnica de Madrid, Campus de Montegancedo, 28660, Boadilla del Monte, Spain
África López-Illescas
Centro Nacional de Medicina del Deporte, Consejo Superior de Deportes, C/ El Greco s/n, 28040, Madrid, Spain
Keywords: Data Mining, Time Series, Event Detection, Stabilometry.
Abstract: Stabilometry is a branch of medicine that studies balance-related human functions. Stabilometric systems
generate time series. The analysis of these time series using data mining techniques can be very useful for
domain experts. In the field of stabilometry, as in many other domains, the key nuggets of information in a
time series are concentrated within definite time periods known as events. In this paper, we propose a
technique for creating reference models for stabilometric time series based on event analysis. After testing
the technique on time series recorded by top-competition sportspeople, we conclude that stabilometric
models can be used to classify individuals by their balance-related abilities.
1 INTRODUCTION
Stabilometry is responsible for examining balance in
human beings. For this purpose, a device, called
posturograph, is used to measure the balance-related
functionalities. The patient stands on a platform and
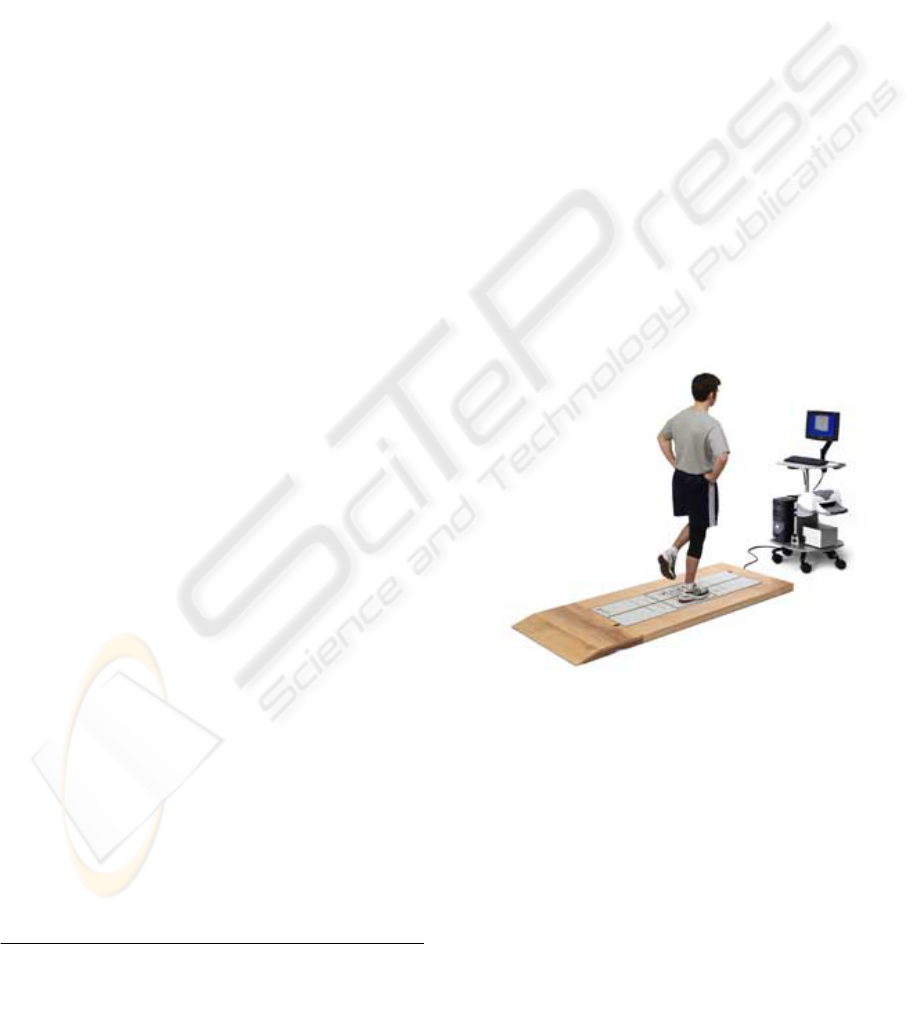
completes a series of tests (Figure 1). We have used
a static Balance Master posturograph. In a static
posturograph, the platform on which the patient
stands does not move. The platform has four
sensors, one at each of the four corners: right-front
(RF), left-front (LF), right-rear (RR) and left-rear
(LR). Each sensor records a datum every 10
milliseconds during the test. This datum is the
intensity of the pressure that the patient is exerting
on that sensor. At the end of the test, we have a
multidimensional time series.
In the time series generated by the posturograph,
the key information happens to be confined to
definite regions of the time series, known as events.
This is not unique to stabilometry, and applies to
many other domains.
Figure 1: Patient completing a test on a posturograph.
Regarding the analysis of time series there are
proposals based on the identification of events
(Povinelli, 2000) (Chen et al., 2008), but they do not
address the creation of models. Other techniques
build models from a set of time series
(Papadimitriou et al., 2005) (Chan and Mahoney,
2005), but they do not identify events that contain
the key information of interest to the expert in each
domain. In this article we propose a method for
modelling time series based on event analysis,
taking into account the expert knowledge by means
of criteria for defining such events.
*
This work was funded by the Spanish Ministry of Education
and Science as part of the 2004-2007 National R&D&I Plan
through the VIIP Project (DEP2005-00232-C03).
485
Lara J., Pérez A., Valente J. and López-Illescas Á. (2010).
MODELLING STABILOMETRIC TIME SERIES.
In Proceedings of the Third International Conference on Health Informatics, pages 485-488
DOI: 10.5220/0002768904850488
Copyright
c
SciTePress

We will explain the stabilometric domain in
more detail in Section 2, whereas Section 3 will
describe the generation of models from stabilometric
time series. The results and conclusions of applying
this technique to the stabilometric domain will be
discussed in Section 4.
2 STABILOMETRIC DOMAIN
In this research, we worked on time series generated
by a stabilometric device known as a posturograph.
This device can be used to run a wide range of tests
according to a predefined protocol. We have worked
with the three tests that output most information for
domain experts. These are called Limits of Stability,
Unilateral Stance and Rhythmic Weight Shift tests.
In the following sections we will describe the
possible events appearing in the time series of each
test and the attributes used to describe these events.
Both the events and their attributes were determined
by the domain experts.
2.1 Limits of Stability (LOS)
This test is composed of eight parts. Each part lasts
10 seconds during which patients have to try to
move his or her centre of gravity to a particular
position in space (called target) and keep it there.
The different targets are: front, rear, left, right, front-
left, front-right, rear-left, rear-right. Patients do not
do one part of the test immediately after another, but
are given time to recover in-between the different
parts of the test. Figure 2 is an example of the paths
of a patient moving his or her centre of gravity
towards the different targets.
The point of the test, then, is to measure patients’
ability to voluntarily move, with both feet on the
platform, their centre of gravity towards a specific
position in space and hold this position for a while
without losing balance.
In this case, preferably, there should only be
movements towards the target (positive movements)
and, once the target has been reached, the subject’s
centre of gravity should not move. In actual fact,
though, the patient wobbles and makes movements
away from the target (negative movements). These
positive and negative movements are the events in
which the expert is interested.
The attributes characterizing the events for this
test are as follows: a) duration, b) timestamp at
which the events occur, and c) movement of the
subject’s centre of gravity in space.
Figure 2: Example of the patient paths towards the
different points in space.
2.2 Unilateral Stance (UNI)
This test aims to measure the patient’s ability to
keep his or her balance when standing on one leg
with both eyes either open or closed (see Figure 1).
The ideal thing for this test would be for the
patient not to wobble at all but to keep a steady
stance throughout the test. The interesting events of
this test occur when the patient loses balance and
puts the lifted foot down on the platform. This type
of event is known in the domain as a fall. The
attributes characterizing the falls are as follows: a)
duration, b) intensity, c) timestamp at which the
events occur, and d) region towards which the
patient is moving when he or she loses balance and
falls.
2.3 Rhythmic Weight Shift (RWS)
The aim of this test is to measure patients’ ability to
rhythmically move their centre of gravity
horizontally (from left to right and from right to left)
and vertically (from front to back and back to front)
at different speeds.
Because the patient continually moves from left
to right and right to left in the case of horizontal
movement, the four time series (LF, LR, RR and
RF) are grouped by pairs (the two left leg and the
two right leg time series pair up, respectively). Also,
as the movement is repetitive, the resulting time
series has a sinusoidal appearance. Figure 3 clearly
illustrates these two issues.
In this case, the events that are of interest to the
expert are each of the transitions the patient makes
from one side to the other. Preferably these
transitions should be as smooth as possible and the
time series plots should closely resemble a
sinusoidal curve. The attributes characterizing each
HEALTHINF 2010 - International Conference on Health Informatics
486

Figure 3: RWS time series with one highlighted event.
event are as follows: a) duration, b) amplitude, c)
smoothness, and d) sinusoidal curve fit.
3 EVENT- BASED MODEL
GENERATION METHOD
The model generation method proposed in this
article receives a set of stabilometric time series A =
{A
1
, A
2
, …, A
n
}, each containing a particular number
of events, and generates a model M that represents
this set of time series. The model M is build on the
basis of the most characteristic events.
To find out whether a particular event in a time
series A
i
also appears in the other time series, the
event has to be characterized by means of an
attribute vector and compared with the other events
of the other series. To speed up this process, all the
events present in the time series are clustered, so
similar events belong to the same cluster. The
objective is to find those clusters containing events
from as many time series as possible. Having located
those groups with similar events, we extract the
representatives of each of these groups. These
extracted representatives will be part of the final
model.
Let A = {A
1
, A
2
,…, A
n
} be a set of n stabilometric
time series such that m is the mode of the number of
events that appear in the time series of A. In this
case, the algorithm for generating a model M
representing the set A is as detailed below:
1. Initialize the Model (M = ∅).
2. Identify Events. Extract all the events E
v
from
the series of A and use an attribute vector to
characterize each event.
3. Determine m, the mode of the number of
events in time series of A.
4. Cluster Events extracted in step 2. We have
used bottom-up hierarchical clustering
techniques.
Repeat steps 5 to 9 m times
5. Get the Most Significant Cluster. Determine
which cluster C
k
of all the clusters output in step
4 is the most significant. Cluster significance is
measured using Equation (1).
#()
()
k
k
TS C
SIGNF C
n
=
(1)
That is, cluster significance is given by the
number of time series that have events in that
cluster over the total number of time series n.
Events that have already been examined (step 8)
are not taken into account to calculate the
numerator.
6. Extract the Event that Best Represents the
Cluster. Extract the event that is most
representative of the cluster C
k
, that is, the event
E
c
that minimizes the distance to the other
events in the cluster. Let A
j
be the time series in
which the event E
c
was found.
7. Add Event E
c
to the Model. M = M ∪ {E
c
}.
8. Mark Event E
c
as Examined.
9. Mark Similar events as Examined. From the
cluster C
k
obtain for each time series A
i
≠ A
j
the event E
p
from A
i
that is the most similar
to the representative event (E
c
) output in step
6. Mark event E
p
as examined. The overall
conception of the method is based on searching
for events that are very similar to others that
appear in as many time series as possible.
Consequently, if we include event E
c
in the
model and discard it for later iterations, we
should also discard similar events in other time
series present in that cluster.
10. Return M as a model of the set A.
4 RESULTS AND CONCLUSIONS
We have developed a method to generate a model
from a set of stabilometric time series by matching
up the events that they contain. Apart from
stabilometry, the method described here can be
applied to other domains where the key information
is concentrated in specific regions of the series,
called events, and where the remaining regions are
irrelevant. The proposed method enables the expert
in each domain to define the regions of interest,
which is a plus compared with other methods
addressing the time series as a whole without taking
into account that certain regions can be irrelevant in
the domain in question.
To evaluate the proposed method we used
stabilometric time series taken from a total of 30
top-competition sportspeople, divided into two
groups. The first group was composed of 15
professional basketball players, whereas the second
MODELLING STABILOMETRIC TIME SERIES
487

was made up of 15 young elite skaters. Thirty is a
reasonable number of patients, taking into account
that the tests are quite complex (a single patient
check-up, including the above three tests, occupies
2-3 Mb).
The ultimate aim of the evaluation is to measure
how good the model generation method is. To do
this, we have created two models from each of the
above groups of sportspeople. These two models are
actually composed of three submodels, one for each
individual test (UNI, RWS and LOS). The first
model (M
basketball
) was created from a training set
composed of 10 of the 15 basketball players. The
other 5 players constituted the test set. The second
model (M
skating
) was generated from a training set
composed of 10 of the 15 skaters. The other 5
skaters were used as test set. The sportspeople in the
test set were chosen at random from all the
sportspeople in each group. Table 1 summarizes the
above.
Table 1: Model data distribution.
Model #Training Set #Test Set
M
basketbal
l
10 5
M
skatin
g
10 5
To evaluate both models, they were used to
classify patients in the test sets. The aim is to check
whether the M
basketball
model properly represents the
group of professional basketball players and whether
the M
skating
model is representative of the group of
elite skaters. Note that the method proposed here is a
modelling not a classification method. To test how
good the method is at creating models, we are going
to evaluate whether the created models are useful for
classification. However, time series modelling has
many other applications like, for example, feature
identification across a group of time series or model
comparison measuring the likeness among groups of
time series or the evolution of one and the same
group over time. In actual fact, in many domains,
like medicine, the mere observation of the model by
the expert can turn out to be very useful in the
decision-making process.
To enact the classification process, we have
compared each of the ten individuals in the test
group against each of the two created models,
making use of the stabilometric time series
comparison method described in (Lara et al., 2008).
All sportspeople have been classified taking into
account how similar they are to the two created
models, selecting the model most like the patient in
question as the class. As regards the five skaters in
the test set, four were correctly classified as skaters.
The fifth could not be successfully classified
because it was very similar to both models. On the
other hand, the five basketball players were correctly
classified as basketball players.
Table 2 summarizes the results. It shows that, of
the ten elite sportspeople that were used to test the
created models, nine were classified correctly within
the respective model of their sports speciality.
Table 2: Sportspeople classification results.
Sport
#Successfully
Classified
#Wrongly
Classified
Basketball 5 0
Skatin
g
41
Considering the results, we conclude that the models
generated by our method represent reliably
population groups according to their balance-related
abilities. These results were considered very
satisfactory by both the research team and the expert
physicians. This has encouraged the physicians to
continue cooperating in this field.
REFERENCES
Chan, P. K., Mahoney, M. V., 2005. Modeling Multiple
Time Series for Anomaly Detection, Fifth IEEE
International Conference on Data Mining, ICDM.
Chen, Z., Yang, B. R., Zhou, F. G., Li, L. N., Zhao, Y. F.,
2008. A New Model for Multiple Time Series Based
on Data Mining, International Symposium on
Knowledge Acquisition and Modeling, KAM.
Lara, J. A., Moreno, G., Pérez, A., Valente, J. P., López-
Illescas, A., 2008. Comparing Posturographic Time
Series through Event Detection, 21st IEEE
International Symposium on Computer-Based Medical
Systems, CBMS.
Papadimitriou, S., Sun, J., Faloutsos, C., 2005. Streaming
Pattern Discovery in Multiple Time-Series, 31st VLDB
Conference, Trondheim, Norway.
Povinelli, R., 2000. Using Genetic Algorithms to find
Temporal Patterns indicative of Time Series Events,
GECCO Workshop: Data Mining with Evolutionary
Algorithms.
HEALTHINF 2010 - International Conference on Health Informatics
488
