
AN INTERACTIVE TOOL FOR DATA STRUCTURE
VISUALIZATION AND ALGORITHM ANIMATION
Experiences and Results
Rafael del Vado V
´
ırseda
Departamento de Sistemas Inform
´
aticos y Computaci
´
on
Universidad Complutense de Madrid, Spain
Keywords:
Virtual learning environments, Virtual labs, Virtual universities and classrooms, Learning and teaching
methodologies, Computer supported education, Interactive learning, Data structures, Algorithmic schemes.
Abstract:
We present a visualization tool for the interactive learning of data structures and algorithmic schemes which
can be used as a useful educational environment in Computer Science. The different parts of this tool in-
tend to transmit to the students the importance of separating the specification and the implementation of data
structures, facilitating the intuitive comprehension of the most typical implementations by using algorithmic
schemes, and providing examples where such structures are used. The tool has been designed to allow teachers
to monitor the whole educational process of the students, providing a personal training assistant and a range
of tutoring techniques according to the student’s response. Along the academic course 2008/09 we have eva-
luated the part of the tool concerning data structures. The tool evaluation is carried by means of tests, some
of them managed from a Virtual Campus, with open access to all the students, and another one managed in a
computer laboratory with a controlled group. In this paper, we show the results of this educational experience
about the benefits that the students get from the tool in the current teaching of Computer Science.
1 INTRODUCTION
The study of data structures and algorithmic schemes
is both essential and complex for Computer Science
students. In this paper we present a tool which in-
tends to facilitate the understanding of all these top-
ics by means of the visualization and the interac-
tion with the user, allowing teachers to monitor the
educational process. Additionally, it tries to pro-
mote a continuous and personal work of the student
along the academic course in a context where the
convergence with the Bologna process and the new
guidelines of the European Higher Education Area
(http://www.ond.vlaanderen.be/hogeronderwijs/bo logna/)
imply innovative education methods centered in the
student.
The tool has been made available through a Vir-
tual Campus for the students of a Data Structures
course, taught in the second year of the Computer
Science studies at the Faculty of Computer Science
of the Complutense University of Madrid (UCM). In
particular, it may be used by the students of three
groups of the Computer Science degree and by an-
other group of the Computer Science technical degree
in Management. Consequently, along this academic
year we only evaluate that part of the tool concerning
Data Structures.
These students have been provided with a guide
for learning with the tool some of the data types in-
cluded in the course programme. Additionally they
have received some flash animations illustrating par-
ticular applications of the data types. Afterwards the
students may check their level of knowledge by ans-
wering some tests. The development of the abstrac-
tion ability and the capacity of solving new problems
requires practising individually the reasoning and also
solving a big amount of exercises. These tests pro-
mote the individual work fundamental for assimi-
lating the concepts. Their accomplishment is com-
pletely volunteer and its main aim is to help the stu-
dents to learn. Additionally they may answer some
questions about the usefulness of the tool, also avai-
lable through the Virtual Campus.
In this paper we present the tool’s development and its
educational capacities in Computer Science Educa-
tion, and also present some results obtained from the
experience along the academic course 2008/09. The
tool, the animations, and the tests are given in Spanish
13
del Vado Vírseda R. (2010).
AN INTERACTIVE TOOL FOR DATA STRUCTURE VISUALIZATION AND ALGORITHM ANIMATION - Experiences and Results.
In Proceedings of the 2nd International Conference on Computer Supported Education, pages 13-20
DOI: 10.5220/0002769000130020
Copyright
c
SciTePress
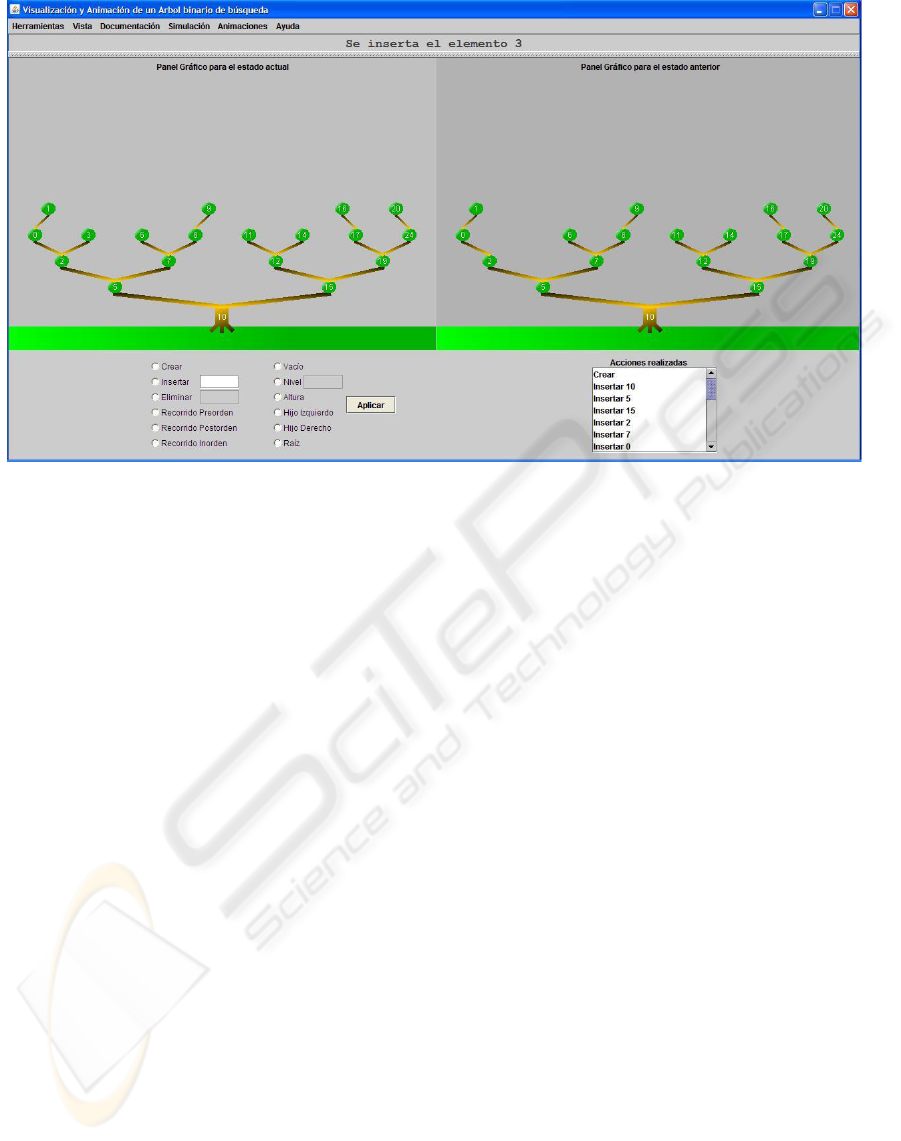
Figure 1: User view of the tool for binary search trees.
so that the students do not consider the language as an
added obstacle in the learning process. In Section 2
we show both the usage and the implementation of
the tool. In Section 3 the flash animations are descri-
bed. Section 4 describes a tutoring system for the tool
to address the whole self-learning process. Section 5
describes in detail the experiences with the students.
Finally, in Section 6, we conclude and present plans
for future work.
2 THE VISUALIZATION TOOL
2.1 Tool Usage
The students and professors may download the vi-
sualization tool from the UCM Virtual Campus
(http://www.fdi.ucm.es/profesor/rdelvado/CSEDU 2010/).
Currently it may be executed in Windows environ-
ments with Java Virtual Machine JDK1.5 (o higher)
but we have also generated a multi-platform version.
When the application is started the user selects one
area: data structures or algorithmic schemes. We con-
centrate in this section on data structures. The student
must choose the particular data structure, being now
available: stacks, queues, binary search trees, AVL
trees, priority queues, ordered tables and hash tables.
When a data type has been selected, for example the
binary search tree data type, we may view in a draw-
ing panel the behavior of the structure, see Figure 1.
It is divided in four parts:
• The Graphical Panel for the current state, after
the execution of the last action.
• The Graphical Panel for the previous state, be-
fore executing the last action.
• A text box where the executed actions are shown,
and a checkbox where the methods of the data
structure may be chosen.
• On the upper part, a label showing the result of
the actions execution.
The user may choose the Simulation option, and then
a sequence of operations provided in a text file are
executed without interruption. Such file may be mod-
ified by the user. On the contrary, if the user wants
to execute the operations one by one, she/he must
start by creating an empty structure. The student may
choose one of several simple types for the elements
of the structure (e.g. integers, strings) and then he/she
can execute the different methods over the structure
and introduce the elements interactively.
At the same time the structure is being created, the
user can select the View of the data type: either an
abstract view of the data type at the level of its alge-
braic specification (User View) or the structure’s state
used in its implementation (Implementation View). In
the user view the behavior of the structure is shown
independently from the implementation. For exam-
ple, Figure 1 shows the user view for binary search
trees. In the implementation view the tool shows how
the data are kept in a particular implementation. For
example, two implementations for the binary search
CSEDU 2010 - 2nd International Conference on Computer Supported Education
14
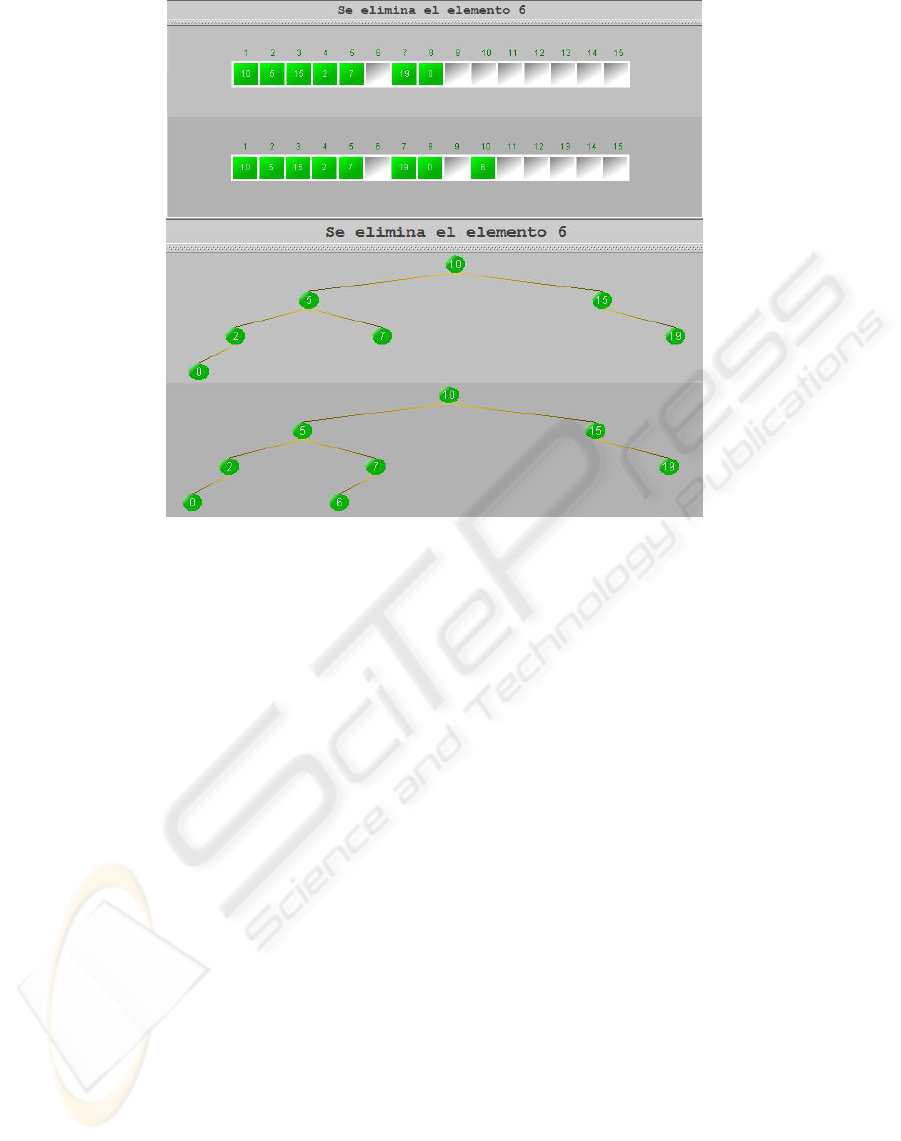
Figure 2: Static and dynamic implementations of binary search trees in the tool.
trees are given: a static implementation by means of
an array, and a dynamic implementation by means of
pointers. They are shown in Figure 2.
The main difference with respect to other related
tools (Chen and Sobh, 2001) is that we intend that
the students assimilate a key concept of the course:
the difference between the behavior description of
a data structure given by the algebraic specification,
and its implementation in a particular programming
language. Additionally, the flash animations, which
we will describe in detail later, provide among other
things, examples of the use of data structures to solve
problems. In this way, the three fundamental aspects
of the course are covered: behavior, implementation,
and usage of data types. The tool has documentation
about the data structures including algebraic specifi-
cations, implementations using Java and cost of the
algorithmic methods in a given implementation.
We have shown in this section binary search trees
as a representative example, but the tool also shows:
stacks, queues, AVL trees (including visualization of
the rotations), priority queues and its implementation
using binary heaps on an array (including visuali-
zations of the up and down movements), ordered and
hash (open and closed) tables.
2.2 Tool Implementation
The tool was originally implemented in the context of
the course Software Engineering in the last year of the
Computer Science degree. It has been implemented
in Java and designed in a modular way, so that adding
new data structures (and algorithms) is as easier as
possible for the programmer. Its main components
are: the interface package, the graphical package,
and the implementation package.
The user communicates with the tool through the
interface package, which consists of an interactive
module and a panel where the animations are shown.
The interactive part (depending on the operations ap-
plied by the user) calls the corresponding function of
the implementation module and also the panel func-
tions responsible for painting the action. The panel
communicates with the graphical package, where the
graphics for each different data structure have been
implemented as well as the animations controlled by
Java threads. This modular design allows to easily in-
corporate new knowledge to the tool.
3 ALGORITHM ANIMATIONS
The algorithm animations have been developed in
flash to allow us to show graphically the use of data
AN INTERACTIVE TOOL FOR DATA STRUCTURE VISUALIZATION AND ALGORITHM ANIMATION -
Experiences and Results
15
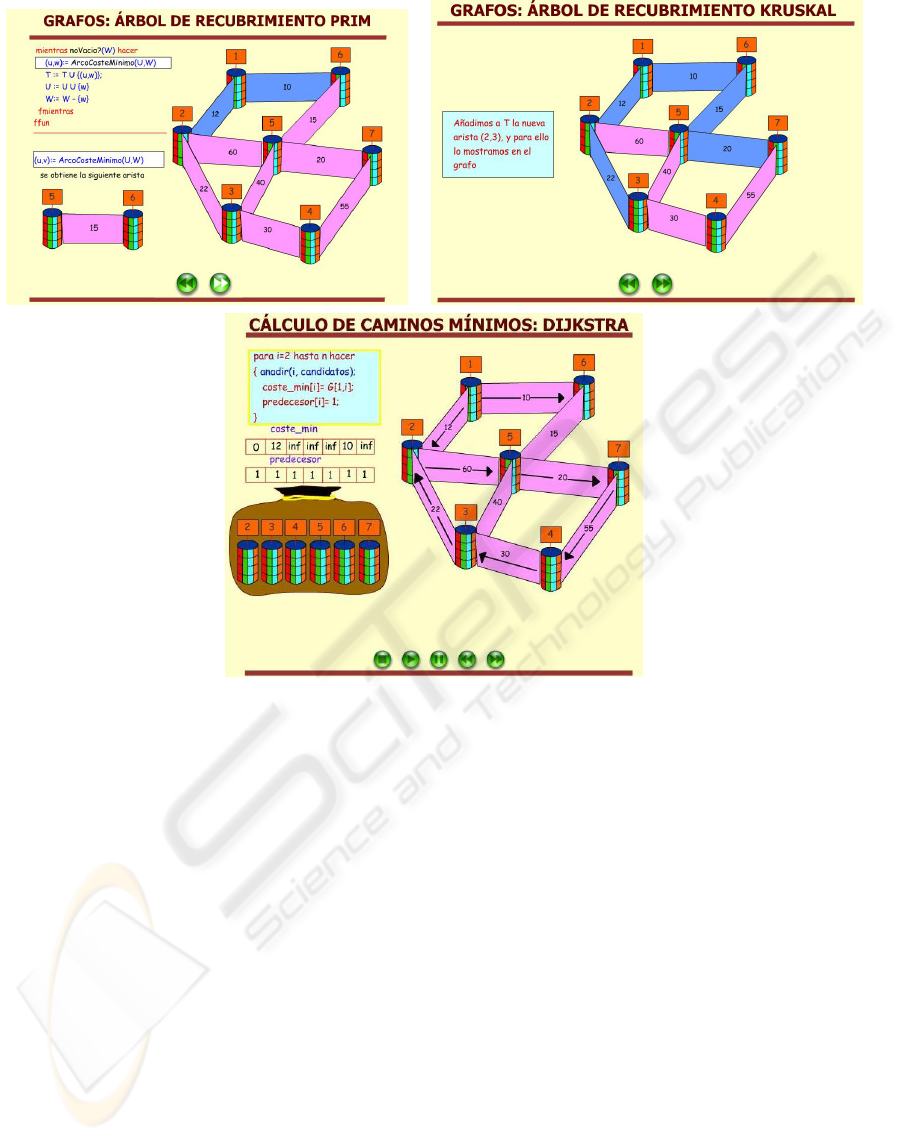
Figure 3: Prim’s and Kruskal’s algorithm animations integrated into the tool.
structures in solving problems (Brown and Hersh-
berger, 1992; Chen and Sobh, 2001; Fleischer and
Kucera, 2002; Kehoe et al., 2001). They can be clas-
sified in three groups:
(1) Animations of algorithms that use data structures;
e.g., the algorithm that transforms an infix expres-
sion to a postfix expression.
(2) Animations about the operations of a data struc-
ture; e.g., Kruskal and Prim algorithms for com-
puting the minimum cost spanning tree of a graph.
(3) Tutorials about the behavior of a data structure
and animations of some of its operations: stacks,
queues, binary search trees, red-black trees, and
priority queues.
Animations complement the tool and are offered
to the students with it. Whenever possible, due to the
screen size limitations, the algorithm code is written
in the left-hand side of the screen while the animation
occurs in the right-hand side to facilitate the students
following the algorithm. Most of the algorithms have
been written in a high level pseudocode description,
independent of any particular programming language.
The input data for the animation have been chosen
such that the algorithm executes as many cases as pos-
sible. Besides, the animations execute the algorithm
in detail, instruction by instruction, showing the result
of the boolean expressions that control the execution
flow.
In Figure 3 we show pictures of the Prim’s and
Kruskal’s Algorithms. These animations were given
to a group of students to obtain the minimum span-
ning tree. The results of this experience are shown in
Section 5.2. Other algorithms and data types anima-
tions can be accessed independently from the tool in
http://www.fdi.ucm.es/profesor/rdelvado/CSEDU 2010/.
4 TUTORING SYSTEM
The integration of an intelligent tutoring system turns
our visualization tool into an innovative instrument
of high pedagogical interest in Computer Science
CSEDU 2010 - 2nd International Conference on Computer Supported Education
16
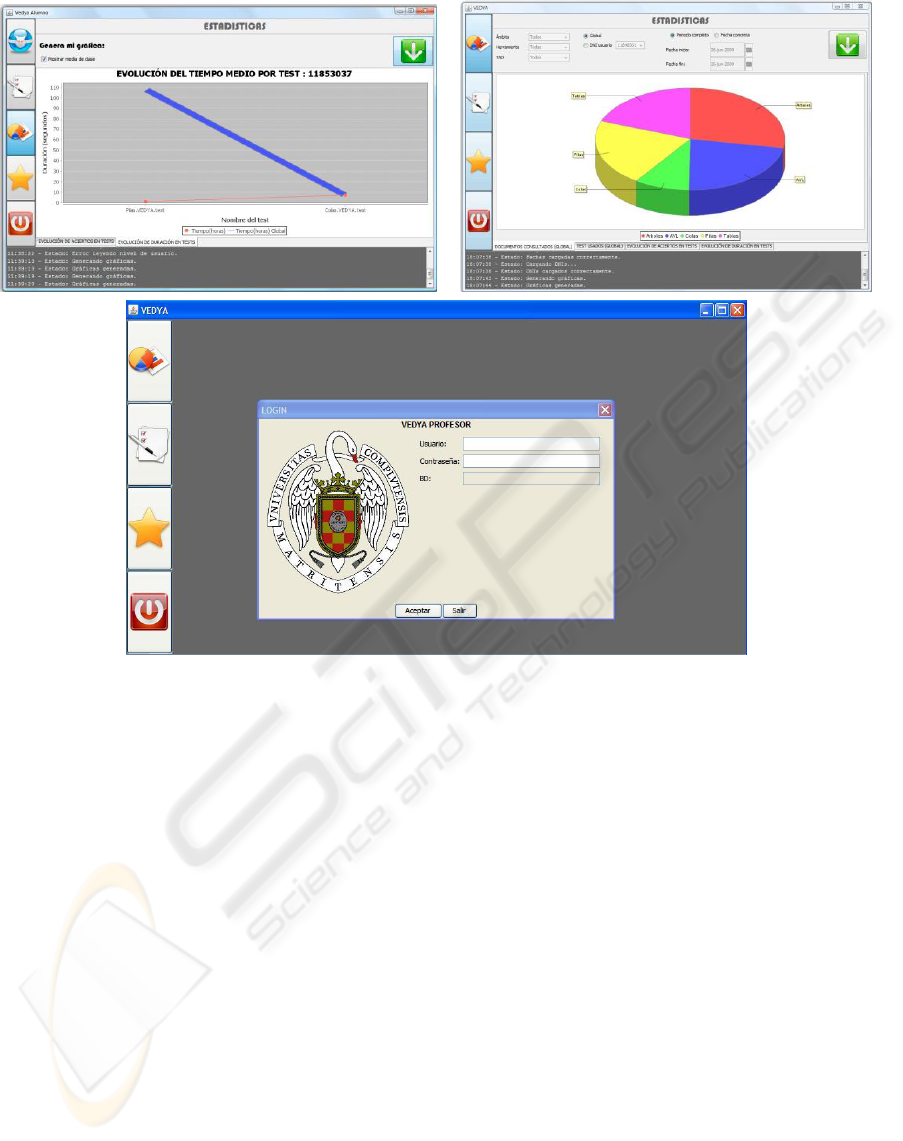
Figure 4: Tutoring system for the visualization tool.
Education in comparison to other related approaches
(Chen and Sobh, 2001; Fleischer and Kucera, 2002;
Kehoe et al., 2001). This tutoring system attempts to
address the whole self-learning process of the main
data structures and algorithmic schemes, from the al-
gebraic specification until the real implementation.
The students have their first contact with the
data structures and algorithms that they are go-
ing to study by means of the usage of this tutor-
ing system for the tool. In order to control the
student’s self-learning process correctly, an online
database has been built on the tool. For this pur-
pose, an additional module (which can be obtained
from http://gpd.sip.ucm.es/rafav/), has been designed
to allow teachers to monitoring the progress of their
students (see Figure 4), according to the information
stored in the database (time spent on each animation,
or most consulted documents on the help on the tool).
Moreover, the tutoring system also allows seeing de-
tailed information of each specific student, by select-
ing their identification number.
5 EXPERIENCES AND RESULTS
As we have mentioned before, the tool is avail-
able for the students of the topic Data Structures in
the Computer Science Faculty of the Complutense
University of Madrid through the Virtual Campus
(http://campusvirtual.ucm.es/prof/EDI0809.html). In total
they are 486 students.
5.1 Design of the Experiences
We have done two different experiences:
• One non-controlled experience: all the stu-
dents may access the Virtual Campus and par-
ticipate freely in the experience: download and
use the tool, and answer different kinds of
tests.
• One controlled experience: two groups of stu-
dents must answer a test in a controlled ambient
from the point of view of the time and the access
to the material.
AN INTERACTIVE TOOL FOR DATA STRUCTURE VISUALIZATION AND ALGORITHM ANIMATION -
Experiences and Results
17

With respect to the non-controlled experience, the
students may freely access the Virtual Campus with-
out any restriction of time (but the last delivery time
at the end of the course) or material (slides, tool, bib-
liography) and answer the questions of several tests.
For each of the following data structures
we have provided a suitable test (which can
be obtained from http://www.fdi.ucm.es/profesor/ rdel-
vado/CSEDU2010/) that evaluates the knowledge of
students about the structure: stacks, queues, binary
search trees, balanced trees (AVL and red-black), and
priority queues. Tables have been not included in the
experience as they have been added to the tool very re-
cently. The students may use these tests to verify their
advances in the understanding of the different con-
cepts. The questions are structured in three blocks:
behavior of the structure, implementation of the struc-
ture, and use of the data type by an algorithm.
The resolution of the tests by the students is con-
trolled by the Virtual Campus and our tutoring sys-
tem. The students are recommended to use the tool
and the animations to complement the study of the
data structures and then to answer the test to check
their knowledge. However, if needed, they can con-
sult the educational material: course slides, bibliog-
raphy (Cormen et al., 2001; Weiss, 2005), the tool.
Each test consists approximately of 24 questions dis-
tributed between the three blocks, except the test
about AVL and red-black trees which only pays atten-
tion to implementation, as they are taught as efficient
implementations of binary search trees. Some of the
questions have two possible answers: true or false,
while other has several alternatives. After each ques-
tion, the student tells us whether she/he has needed to
consult some material to answer the question and in
that case which one. When the delivery time is over
the students may know their marks and to the correct
answers also through the Virtual Campus and the tu-
toring system.
Additionally, we have elaborated tests about the
usefulness of the tool for each of the data structures,
where the students manifest the time dedicated to
study the structure, the time dedicated to answer the
test, and also which material is more interesting for
them. The aim of these other tests is to obtain the sub-
jective opinion of the students about the help given by
the tool to learn about the data structures and to know
their study preferences.
In the controlled experience we try to evaluate
more objectively the usefulness of the animations.
In particular we have chosen the animations of the
Kruskal and Prim algorithms for obtaining a mini-
mum spanning tree of a graph. We choose two groups
of students: approximately half of the students are
only given the slides of the course and the data struc-
ture books at class; and the other half are given only
the animations at a computer laboratory. Then, all
the students answered the same questions in one hour
about these algorithms.
5.2 Obtained Results
5.2.1 Non-controlled Experience
We outline here the main conclusions from the re-
sults of the non-controlled experience. With respect
to the material the students used to study, as long as
the structure is more complicated the use of the tool
(simulation, case execution, and tool help) increases
considerably. The better results are obtained in the
AVLs and the red-black trees. The tool helps to visu-
alize the rotations in these balanced trees. In the rest
of the structures they used class material or bibliogra-
phy (Cormen et al., 2001; Weiss, 2005).
When answering the tests questions, the students
were also asked whether they needed additional help
to answer them. In the case of binary search trees and
AVLs they use the tool as much as the class material,
which means that visualization of the operations, such
as eliminations and rotations, are useful for them. In
the case of red-black trees, they used ”other” material
a bit more than the tutorial animation, which presum-
ably consists of a colleague advice.
We can say that although only a small percentage
of students have followed the experience, those who
have done it, both consider the tool as an interesting
material and have used it to complement the rest of the
available material, including the class explanations.
The tool is specially useful for visualizing the most
“complex” operations.
5.2.2 Controlled Experience
This experience was carried out with 59 students. We
gave 32 of them the slides of the course and the data
structure books (Cormen et al., 2001; Weiss, 2005).
The rest were taken to a laboratory, where they could
execute the animations. We gave the same test to both
groups, consisting of 18 questions, 12 of them about
execution aspects of the algorithms, and the rest about
their cost.
In Figure 5 (left) we provide the media and the
standard deviation of the number of correct answers,
the errors, and the number of don’t knows. First, we
observe that students using the animations, answer in
media less questions than the other ones. Besides,
they make more errors than the others. This is due
CSEDU 2010 - 2nd International Conference on Computer Supported Education
18

All the questions Excluding cost questions
Correct answers errors don’t knows Correct answers errors don’t knows
media σ media σ media σ media σ media σ media σ
Animations 9.63 2.37 6.18 2.2 3.3 2.9 9.18 2.1 4.26 1.7 0.55 1.57
Slides 11.9 3 4.9 2.2 1.1 1.9 9.25 2.6 4.1 2 0.65 1.53
Figure 5: Medias and standard deviations (σ).
to the fact that most of the animations students do
not answer the questions about the cost of the algo-
rithms, while in the other group they give correct an-
swers to these questions. The reason is that students
of the slides/books group obtained the costs of the al-
gorithms directly from the material, while the anima-
tions students had to deduce it from the code.
Figure 5 (right) gives the results excluding ques-
tions about costs. Now both groups present a similar
behavior. The standard deviation of the students be-
longing to the animations group is slightly lower than
that of the other group. The explanation for this re-
sults may be that students who use animations assimi-
lated the concepts in a more homogeneous way, while
the use of more conventional learning material, such
as books or slides, leads to greater differences among
the students. Finally, we observe that most of students
of the animations group have failed the same ques-
tions about the algorithm. This may be attributed to
the fact that the example displayed in the Kruskal an-
imation does not exhibit some cases of the algorithm.
We can conclude that although there are not big dif-
ferences between both groups, animations constitute
an optimum complement to facilitate the comprehen-
sion of the different algorithms. Besides, it has helped
us to detect in the students difficulties to derive the al-
gorithms costs.
The most positive aspect of this experience is that
all the students who used the animations indicated the
benefits of using them to understand the implementa-
tion of the algorithms. They also mentioned that con-
sulting written material would also be helpful to ans-
wer the questions about the algorithms costs. Some
of them also complained about the example of the
Kruskal algorithm, as it was not as representative of
all cases of the algorithm as it was desirable. The
examples must exhibit the complete behavior of the
algorithm, avoiding possible misunderstandings of it.
Otherwise, students may be guided by the animation
to make wrong assumptions about the algorithms.
6 CONCLUSIONS AND FUTURE
WORK
In this paper, we have presented an interactive tool
for the visualization of data structures and algorith-
mic schemes which can be used for tutoring students
in the first years of Computer Science Education. The
main benefit of this kind of software is to facilitate the
student’s grasp of the target procedures in Computer
Science, and to facilitate teamwork and communica-
tion between teachers and students.
We have made two different kind of educational
experiences. In a non-controlled experience we have
priorized that all the students may access the tool and
so get benefit of it and of the tests. This is the rea-
son why they do not have restrictions of time or ma-
terial. However they are also given questions in order
to evaluate the usefulness of the tool. In a controlled
experience however the time and the material are re-
stricted in order to evaluate directly the usefulness of
the tool and/or the animations.
In our opinion the experiences have been very pos-
itive for those students who decided to participate, al-
though we would have liked the number of volunteer
participants was higher. We confirm that the tool is
complementary to both the class explanations and ma-
terial, making easier the visualization of some opera-
tions over data structures and algorithmic schemes.
In the next academic year we will continue using
the tool, not only in the Data Structures course but
also in the Algorithms course, in which the part of
the tool dedicated to algorithmic schemes (dynamic
programming, divide and conquer, greedy methods,
branch and bound) will be as well evaluated. We will
also intend to generate a multi-platform version of the
tutoring system and improve those aspects signaled
by the students in the test.
REFERENCES
Brown, M. and Hershberger, J. (1992). Color and sound
in algorithmic animation. In j-COMPUTER 25(12),
pages 52–63.
AN INTERACTIVE TOOL FOR DATA STRUCTURE VISUALIZATION AND ALGORITHM ANIMATION -
Experiences and Results
19

Chen, T. and Sobh, T. (2001). A tool for data structure
visualization and user-defined algorithm animation. In
Frontiers in Education Conference.
Cormen, T., Leiserson, C., Rivest, R., and Stein, C. (2001).
Introduction to Algorithms. The MIT Press/The MIT
Press/McGraw-Hill.
Fleischer, R. and Kucera, L. (2002). Algorithm animation
for teaching. In Software Visualization, International
Seminar Dagstuhl Castle, Springer LNCS 2269, pages
113–128.
Kehoe, C., Stasko, J., and Taylor, A. (2001). Rethinking the
evaluation of algorithm animations as learning aids:
an observational study. In International Journal of
Human-Computer Studies 54(2), pages 265–284.
Weiss, M. (2005). Data Structures and Problem Solving
Using Java. Addison-Wesley, 3rd Edition.
CSEDU 2010 - 2nd International Conference on Computer Supported Education
20
