
AN APPROACH TO MEASURE STUDENT ACTIVITY IN
LEARNING MANAGEMENT SYSTEMS
Marta Zorrilla, Diego García
Department of Mathematics, Statistics and Computation, University of Cantabria, Avda. Los Castros s/n, Santander, Spain
Elena Álvarez
Department of Applied Mathematics and Computer Science, University of Cantabria, Santander, Spain
Keywords: Student activity indicator, Student participation index, Progress feedback, Monitoring tools, Learning
management system, Educational technology.
Abstract: Nowadays most universities and educational centres use LCMSs to support the learning and teaching
process. In the new framework of the European Higher Education Space, in which the student learns to learn
and where the assessment must consider the whole activity carried out by the learner, it is necessary to have
some indicator which measures the attendance and participation of each student in virtual courses. This
work proposes several student activity indicators which are flexible, extendible and independent from the
LMCS. They are based on a parameter which gathers the instructor’s criteria in order to measure the activity
of his course (time spent, hits or a combination of both). These indicators are obtained for each learner in
each resource (content pages, forums, etc.) with relation to the activity carried out by his or her classmates.
These indicators will be shown periodically both to the learners and to the instructors so that each student
can observe the effort/dedication levels he or she has made compared with the rest of the group and the
instructor can assess the grade of activity and participation of each student in the course and furthermore,
detect students at risk of drop-out, gaining insights about the learning style of each student and also check if
the effort level carried out by students is adequate or higher than the instructor estimated for the course.
1 INTRODUCTION
In recent years, more and more, universities offer the
possibility of enrolling in their degrees and masters
in a semi presential or completely virtual (online)
way in order to facilitate the learning along the life
and to make compatible this with other activities.
In general, these organizations use Learning
Content Management Systems (LCMS) –such as
Moodle, Sakai or WebCT/Blackboard– to give
technical support needed to develop the virtual
teaching and learning process, since these systems
support most of the activities that occur in the
classroom and allow the use of different multimedia
resources, generally, interactive ones. Furthermore,
they facilitate the interaction among students and
tutors and make the participation and collaboration
among them possible in order to build their own
knowledge.
Despite the advantages they provide, these
systems present some shortcomings for both
students and instructors. There is a list of problems
encountered by students studying on-line courses,
including the students’ feeling of isolation due to
lack of contact with the instructor, disorientation in
the course hyperspace, and so on (Conrad, 2002;
Mazza et al., 2007). On the other hand, instructors
lack the appropriate tools in order to supervise the
students’ work in the current LCMSs (Hijon et al.,
2006). As a consequence of this, getting a clear
vision of each student or group academic
progression during the course is difficult and time
consuming for instructors. Furthermore, they
generally face a higher number of drop-outs (Xenos
et a., 2002; Jusung, 2005; Levy, 2007) and a
panorama where student performance is lower (Zinn
et al., 2006).
In our opinion, this mainly happens for two
reasons: LCMSs do not suitably report to instructors
the activity that each learner develops, in such a way
21
Zorrilla M., Garcia D. and Alvarez E. (2010).
AN APPROACH TO MEASURE STUDENT ACTIVITY IN LEARNING MANAGEMENT SYSTEMS.
In Proceedings of the 2nd International Conference on Computer Supported Education, pages 21-28
DOI: 10.5220/0002777800210028
Copyright
c
SciTePress

that they can know how he or she is progressing in
the course and take actions as soon as a lack of
activity or under performance is detected; and
LCMSs only report to instructors when giving
learners some indication of their relative effort
compared with their peers may motivate them to
higher participation rates and success.
Most of the LCMSs have simple modules of
reporting with which instructors can extract a limited
knowledge about how often their students access the
virtual course and what resources they use (Zorrilla
et al., 2009), but they do not provide indicators that
show a clear idea of the activity of each learner with
regard to the rest of the group.
For this reason, the aim of this paper is to
propose some student activity indicators which
gathers the dedication of every learner in the
different resources that the virtual course provides
(forums, contents, wiki…). These indicators will be
shown periodically both to the learners and to the
instructors so that each student can observe the
effort/dedication levels he or she has made
compared with the rest of the group and the
instructor can detect students at risk of drop-out,
discover the learning style of each student, and also
check if the effort level carried out by students is
adequate or higher than he or she estimated for the
course.
It must be said that these activity indicators does
not try to measure performance, but to evaluate the
assistance and participation in the course. The same
way as traditional education instructors do when
they write down who is in the classroom, who
answers his/her questions, who takes part in debates,
who suggests topics of discussion, etc. The
definition of indicators of this style is justified even
more inside the European Higher Education Space
where the whole activity carried out by the learner
must be assessed, attendance and participation being
simply other aspects of the evaluation.
The paper is organized as follows. In Section 2
we review the existing research work related to
monitoring and measuring students’ learning activity
in e-learning environments. Section 3 defines the
proposed student activity indicators and explains and
justifies the selection of each parameter. Section 4
discusses the utility of these indicators using as a
case study a virtual course offered in the University
of Cantabria. Finally, section 5 summarizes and
draws the most important conclusions of our
proposal.
2 RELATED WORK
In this section we provide an overview of the related
literature, focusing our attention on monitoring and
measuring students’ learning activity in e-learning
environments.
As has been mentioned previously, the LCMSs
offer reports with which instructors can extract
certain information about the behaviour of their
students in the virtual course, although according to
Douglas (2008), few teachers use them due to the
difficulty of interpreting the information that they
give. In general, these reports show, in table format,
quantitative information relative to the different
actions that students carry out in the virtual course
such as the number of accesses, the number of
visited pages, the number of read and sent messages
or the total spent time browsing the course. But
these numbers do not say very much if they are not
elaborated measurements that allow instructors to
compare the activity of a student with regard to the
rest of the group.
For this reason, some research groups are
developing software tools that allow this information
to be shown in a more elaborated, graphical and
intuitive way, such as CourseVis (Mazza et al.,
2007), Gismo (Milani et al., 2007), Moodog (Zhang
et al., 2007) and Matep (Zorrilla et al., 2008), at the
same time answering questions that the instructors
are more interested in knowing such as the
participation of students in the forums, the frequency
of use of each resource, the time spent per student
and group in each resource, what resources they
prefer or when and how often they access the virtual
course, etc. But none of them provides an activity
indicator in a strict sense.
We have found few papers directly related to
measuring student activity in LCMS, among these
are:
Pendergast (2006) describes a tool independent
from the LCMS that allows instructors to assess the
activity of the students exclusively in the use of
forums. The formula is quantitative with weight
assigned to the number of sent messages, the number
of received and the length of the messages though it
also includes a qualitative part that the instructor
establishes once he or she has read the messages.
Chan (2004) defines a student participation index
using 5 parameters corresponding to 5 student
actions: number of pages viewed, number of forum
questions read, number of forum questions posted,
number of chat sessions participated in and number
of chat message submitted. The computation of the
index is based on the weight of each pre-defined
student action and the median of the students’ index
CSEDU 2010 - 2nd International Conference on Computer Supported Education
22

scores. Weights are assigned by the instructor.
In our opinion this indicator presents two
shortcomings. On the one hand, it is focused on
assessing and not measuring the participation in the
course since instructors determine, by means of
weights, what actions are more important for them.
And on the other hand, the indicator is based on the
number of events instead of time spent or in a
combination of both, actions and time. What
measures better the activity in the mail use: reading
or writing two messages or the time spent in doing
it? In our opinion, it depends on how the instructor
wants to assess the activity, considering the time
spent in each resource, the number of clicks carried
out or using a combination of both. Even more it
could happen that the instructor would choose a
different criterion to evaluate the activity in each
resource, since this depends on how the course is
designed and organized.
Finally, Juan et al. (2008) propose a system to
monitor online students’ academic activity and
performance. This, as in the rest of the papers, is
independent from the LCMS and it is based on
sending periodical reports by e-mail to online
instructors and students. It offers three activity
indicators which are calculated based on the number
of events (post or read notes in forums, send or read
e-mails, complete online tests, upload or download
documents, etc).
Students classification indicator defined as
number of events per student during this week
vs. number of events per student during an
average week.
Individual student monitoring which monitors
activity levels of each student throughout the
course (weekly)
Monitoring participation level which monitors
the percentage of students that complete each
test.
The authors show some interesting graphical
reports although, as with the previous reference, they
only use the number of events. Furthermore, as the
index is computed globally, it is not possible to
compare the activity carried out by each learner in
each resource in relation to the group. This would
allow instructors to discover the student learning
style.
3 STUDENT ACTIVITY
INDICATORS
Class attendance and contribution may be
considered as student actions which can be used to
evaluate student participation in the traditional
classroom. However, in online courses, instructors
lack face-to-face contact, so that they only can carry
out this assessment using data about the students’
actions registered in LCMS: accessing course
materials, posting and reading discussion forums,
taking online quizzes, writing in wiki, etc.
The student activity indicators (SAI) which we
propose are generated independently of LCMS but
use the information which e-learning platforms
register in their tracking tables. LCMSs, in general,
write down the initial and final time of each action
carried out by a user (instructor, student, and
administrator) in each resource. The action is
considered finished when other action happens in the
same or in another resource. We initially consider
the following resources: content page, forums, mail,
test and quizzes, wiki and chat because they are
offered by the most known and used LCMSs
(Álvarez, 2008).
3.1 Mathematical Function Selection
A measurement of activity could be modelled by
means of a function v=v(t), where t is the value of
the parameter about which the valuation is to be
done, for example, time, and v is the activity
indicator of a student that has dedicated a value t in
the range of dates under study. The function v will
return a value between 0 and 1.
We consider suitable a crescent function (more
time implies more activity) which fulfils the
following conditions:
1. For t=0, v must be 0.
2. In order to measure the activity in relation to
the average and maximum activity of the
group, we establish that
• For a value t=α, v is considered the
average activity, that is 0.5
• For a value t=β, v is considered the
maximum activity, that is 1.
The simplest function with three free parameters
which gathers these characteristics is t=av
2
+bv+c,
isolating v, we will have
a
tcabb
tv
2
)(4
)(
2
−−+−
=
where
1. For t=0, v must be 0, so that c must be 0.
2. For v(α)=0.5 and v(β)=1, then b=4α-β and
a=2β-4α.
Next, we explain how to calculate the SAI for
each resource.
AN APPROACH TO MEASURE STUDENT ACTIVITY IN LEARNING MANAGEMENT SYSTEMS
23
3.2 SAI in Content Pages
A
1
,…,A
n
are the students enrolled in the virtual
course whose activity must be calculated for a range
of dates divided into 1, …, k periods (for example,
weeks). This value is denoted v
k
(A
j
).
For each period k, a set with the time spent for
each student A
j
in each page viewed is defined.
Next, t
kj
is calculated as the sum of the time spent
for the student j in the period k. Then, an interval
[m
k
, M
k
] with the values comprised between 10 and
90 percentile of the t
kj
is defined with the aim that
the average is not affected by extreme values.
Next, α
k
and β
k
are defined as:
],[)(α
k kkkjkj
Mmtwheretavg ∈=
(1)
],[)max(
kkkjkjk
Mmtwheret ∈=
β
(2)
In order to calculate the activity of the student A
j
in the period k, denoted v
k
(A
j
), the number y
k
(t
kj
) is
considered, where y
k
(t) is the following crescent
function which returns a value between 0 and 1.
⎪
⎪
⎩
⎪
⎪
⎨
⎧
≥
≤≤
++−
≥
=
k
kk
k
kkk
k
k
Mt
Mtm
a
tabb
tm
ty
1
2
4
0
)(
2
(3)
This function fulfils that y
k
(0)=0, y
k
(α
k
)=0.5,
y
k
(β
k
)=1 so that it can be considered as a
measurement that assesses the activity of a student
compared to the rest of the group. A value higher 0.5
is obtained when the student spends more time than
the average. Alpha and beta parameters can be
modified in order to adjust the measurement to other
criteria. For example, α
k
could be the average time
that students spend in browsing a content page in the
period k multiplied by the number of pages that
students browse on average in this period; and β
k
,
the average of the maximum time that students
spend in browsing a content page in the period k
multiplied by the average of the maximum number
of pages that students browse in this period.
3.3 SAI in other Resources
We use the same formula and method of calculation
in the different resources. For each resource, we
choose those actions which better allow us to value
the activity carried out in it. For example, for mail
and forum, the messages read and sent; for wiki, the
web pages edited, etc. Next, we choose the
parameters we are going to use to measure. For
example, the number of accesses, the time, a
combination of both, etc. And finally, we calculate
the indicator following the same steps described in
section 3.2. It is possible to define different criteria
according to how alpha and beta are chosen (see
Table 1).
Table 1: Possible alpha and beta parameters for the
different resources, t
kj
being the time spent by student j in
the period k in the resource and n
kj
is the number of times
that student j carried out the action.
Alpha Beta
)(α
k kj
tavg
=
)max(
kjk
t=
β
)(α
k kj
navg=
)max(
kjk
n=
β
()
kj
kkj
kj
t
avg x avg n
n
α
⎛⎞
=
⎜⎟
⎜⎟
⎝⎠
()
k
max
kj
kj
kj
t
avg x n
n
β
⎛⎞
=
⎜⎟
⎜⎟
⎝⎠
()
kj
kkj
kj
t
avg x avg n
n
α
⎛⎞
=
⎜⎟
⎜⎟
⎝⎠
()
k
max
kj
kj
kj
t
x
avg n
n
β
⎛⎞
=
⎜⎟
⎜⎟
⎝⎠
3.4 Global SAI for Resource and for
Period
The student activity indicators defined until now are
for a resource and a period. But the possibility of
joining them in order to obtain a global indicator for
resource and another for period also exists.
The global SAI for resource could be calculated
as the average of the SAI for resource obtained in
each period. This would allow instructors to
compare each student with respect to the average
activity and gain insights about his or her learning
style.
The global SAI for period could be calculated as
the sum of weighted SAI obtained by the student in
each resource (m) available in the course (see eq. 4).
These weights, with the aim at being independent of
instructor’s criteria, could be calculated, for
example, as a percentage of time invested by all
students in each resource. That means, the time
spent by all students in the course would be summed
up and the weight for each resource would be
proportional to its contribution with respect to the
total. This indicator would offer the instructors a
global valuation of attendance and participation of
each student in a period.
∑
=
=
m
i
ii
SAISAI
1
ϖ
(4)
CSEDU 2010 - 2nd International Conference on Computer Supported Education
24
4 CASE STUDY
The virtual course entitled “Introduction to
multimedia methods” is a subject of 6 ECTS which
was taught in the first semester of 2009 at the largest
virtual campus in Spain, called G9 (this group is
composed by 9 Spanish universities; one of them is
the University of Cantabria). It is a practical subject
in which a multimedia tool is taught. The course is
designed by means of web pages conformed to
SCORM and include some video tutorials, flash
animations and interactive elements. It is registered
in Blackboard LMS.
Although the number of students enrolled in the
course was 80, only 45 made the first assignment,
whose submission was 15 days after the beginning
of the course, and finally, 37 students followed the
course until the end.
For this case study, we calculated the indicators
considering only the time variable. The alpha and
beta parameters were obtained at the end of the
course using a weekly period.
In order to analyze the validity of the proposed
indicators, the instructor selected three students
(mlm90, euh10, rce56), that she suspected had a
very different behaviour in their involvement in the
course. Their way of working, their participation in
the forum and their communication with the teacher
by e-mail was making her suspect an uneven
utilization of the different tools available in the
course. Another additional reason for their selection
was their final mark: mlm90 had a high
qualification, euh10 average and rce56 low.
Next, the instructor discusses the results obtained
in content pages, forum and mail due to the fact that
the course had neither quizzes nor wiki.
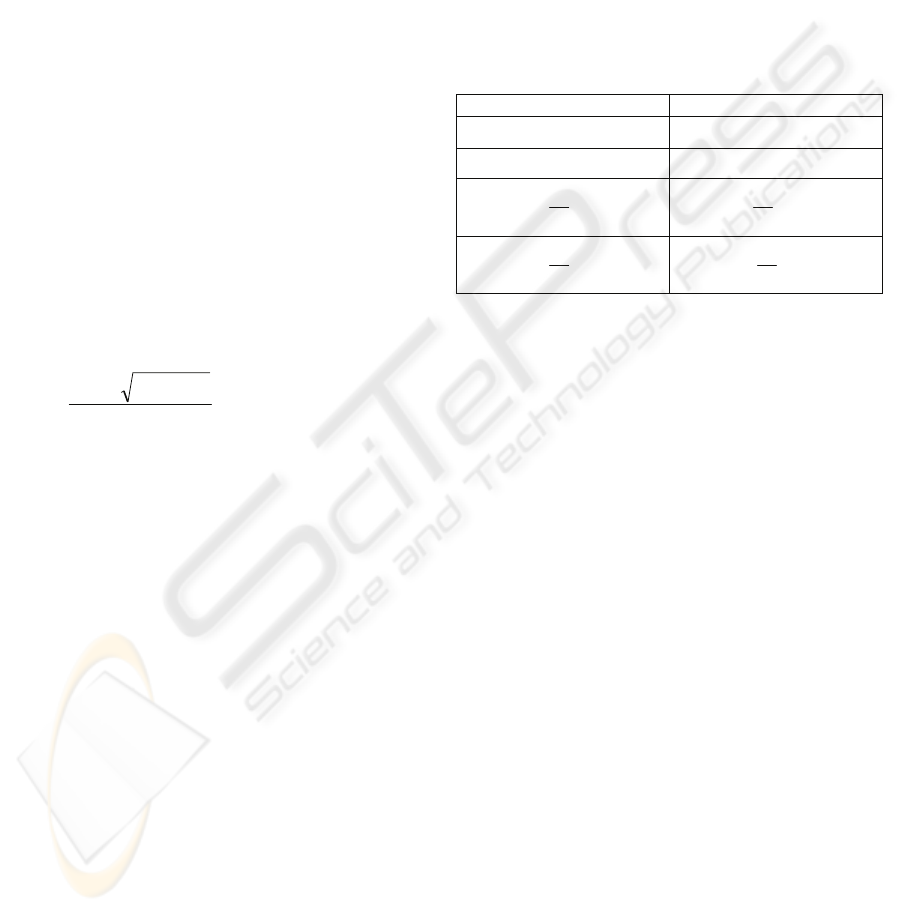
As can be observed in Figure 1, the alpha and
beta parameters associated with the content pages
reveal two important facts: the time spent in content
pages is regular enough throughout the course with a
decrease in periods after a submission of an
assignment. The average time spent per week in
content pages is 5000 seconds (approximately 1 hour
20 minutes per week). It is important to highlight
that, because of the practical nature of the course,
most of the proposed tasks do not require students to
be connected. This dedication is considered suitable
by the instructor.
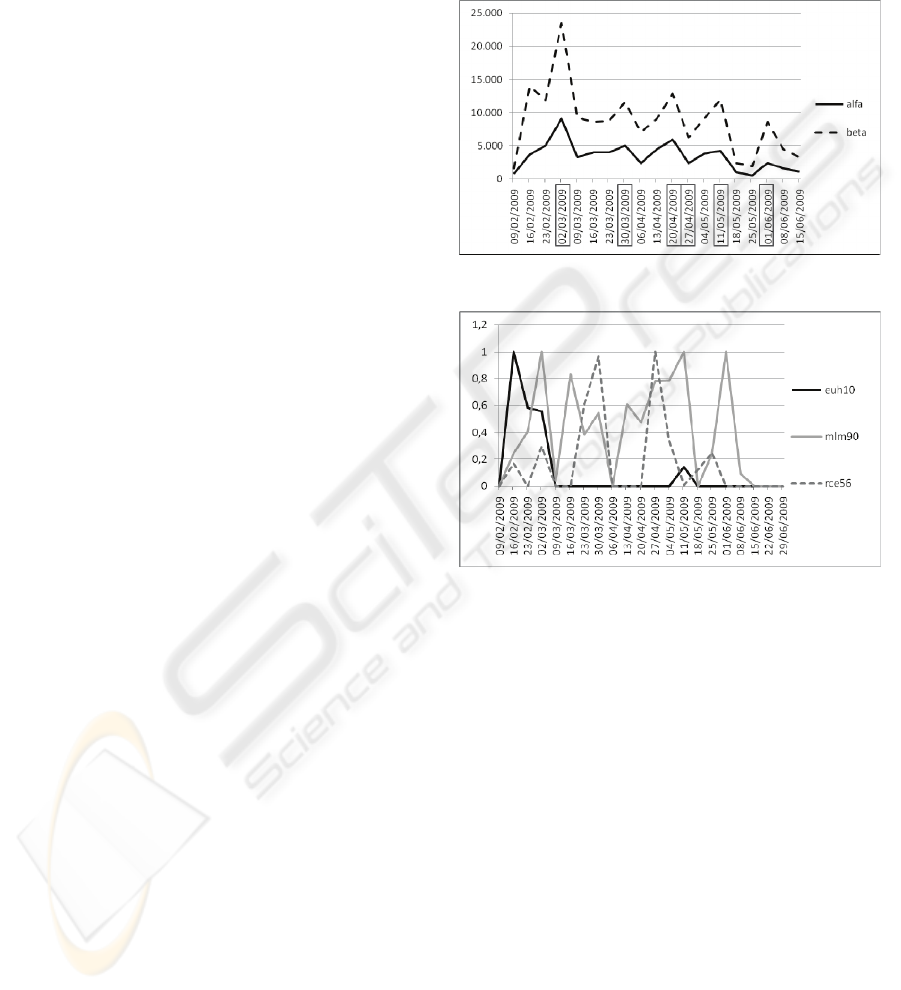
In Figure 2, it can be observed that the activity
carried out by the three learners in content pages
show that they behave differently. Euh10 scarcely
visits the content pages (practically the first two
weeks of course); nevertheless, mlm90 and rce56
have different degrees of activity. The first carries
out an activity superior to the average practically
every week whereas the activity of the second is
lower than the average and concentrated in the dates
before a submission was due (the weeks in which a
submission had to be done are marked in rectangles
in Figure 1).
Figure 1: Alpha and beta for SAI in content pages.
Figure 2: SAI in content pages for the three chosen
students.
Forum and mail were the tools used to establish
the communication among the students and the
instructor mainly. The instructor confirmed by
means of the comments written in the required
assignments that students considered the forum very
useful.
In Figure 3, it can be seen that the time spent on
average per student in a week is nearly 2500 seconds
(practically half of time dedicated to content pages).
A higher activity in the period in which students had
to carry out one of the more difficult and longer
(April – March) practical exercises is also observed.
Finally, a decrease in activity when the course is
ending is also appreciated.
In relation to the students’ behaviour it can be
said that euh10, mlm90 and rce56 behave
differently. Euh10 is one of the students who has
been connected most to the forum (for several weeks
his/her valuation is maximum). On the contrary,
AN APPROACH TO MEASURE STUDENT ACTIVITY IN LEARNING MANAGEMENT SYSTEMS
25

mlm90 and rce56 have less activity and, once again,
rce56 concentrates this in dates near a submission.
Figure 3: Alpha and beta for SAI in forum.
Figure 4: SAI in forum for the three chosen students.
The use of the mail was more specific, generally
to answer doubts in an individualized way. The
value of alpha associated with the indicator (see
Figure 5) confirms the suspicion of the instructor
that the forum was the tool most used for the
communication (the instructor does not have
knowledge of the messages sent among students).
The behaviour of mlm90 in the mail tool might
be considered the most usual. The student hardly
communicates with the instructor in an
individualized way since he/she has other tools to
consult and solve his/her doubts (content pages and
forums). Nevertheless, rce56 and euh10 behave very
differently. The instructor, after analyzing the three
indicators together, confirms her impression with
regard to how they had carried out the activity in the
course. In case of rce56, his/her activity was centred
on periods near the submissions and since he/she did
not visit the forum regularly, he/she asked the
instructor for help. However, euh10 is a student who
tried to do the tasks without reading the content
pages, looking for the solution in the forum. If the
student did not find the answer, then he or she sent
the instructor an email.
Figure 5: Alpha and beta for SAI in mail.
Figure 6: SAI in mail for the three chosen students.
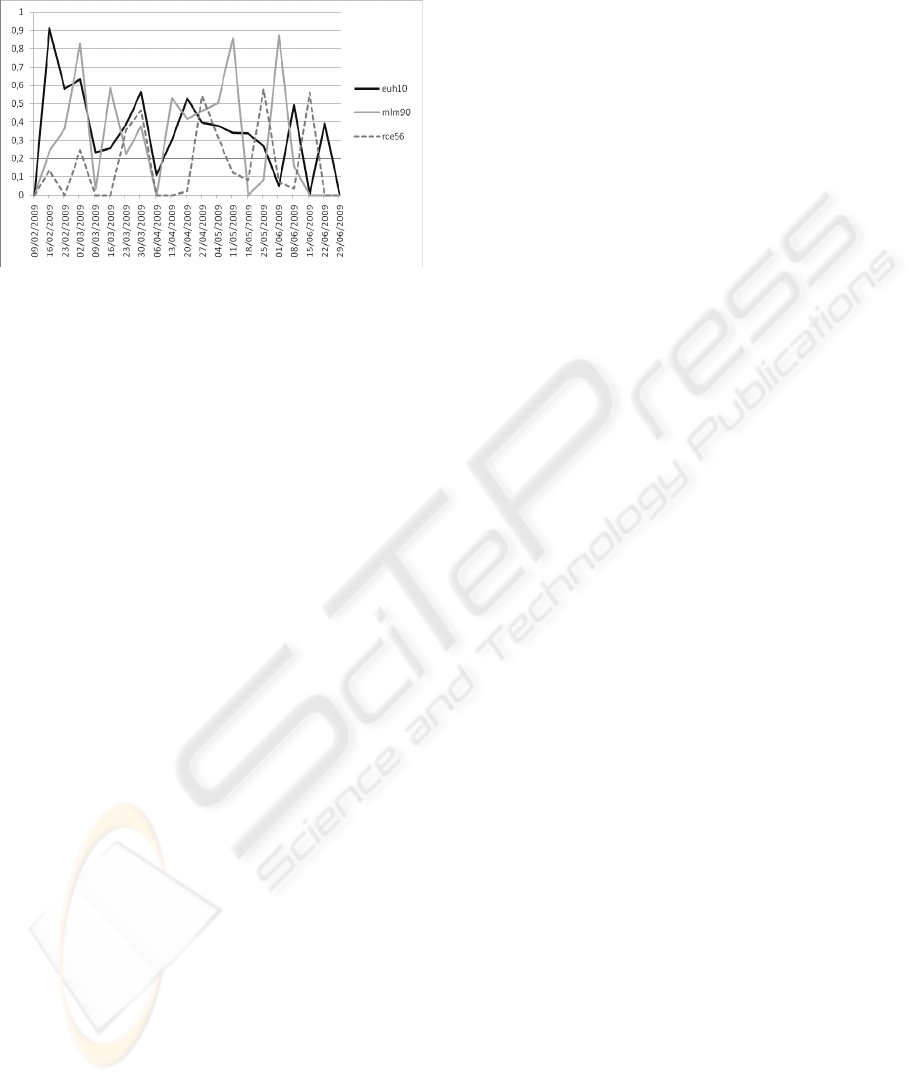
Figure 7 shows the global indicator for each
resource of the three students obtained as the
average of their SAIs throughout the 15 weeks. In
the instructor’s opinion, this graph allows her to see
if a student has carried out an activity above or
below the average and get an idea of his or her
learning style.
Figure 7: Global SAI for resource.
Lastly, Figure 8 shows the global SAI for each
week. This graph illustrates the activity carried out
by the students but hides their behaviour. Rce56 has
a low activity, euh10 is a little more and mlm90 is
the student with the highest activity. We consider
CSEDU 2010 - 2nd International Conference on Computer Supported Education
26
that the SAI in each resource is more useful for the
instructors.
Figure 8: Global SAI for each week.
5 CONCLUSIONS
Monitoring activities in conventional teaching
environments involves observing students’
behaviour in the classroom and estimating the
effectiveness of pedagogical strategies in a continual
and visual feedback. However, in e-leaning context,
this informal monitoring is not possible, and the
teachers must look for other ways to obtain this
information (Lera-López et al., 2009).
In this sense, our work seeks to offer instructors
a student activity indicator that allows them to gain
insights into the learning style of each student, detect
students at risk of drop-out, and assess the grade of
activity and participation of each student in the
course. Furthermore, students will also be benefited
since they will be able to know what their effort is
with relation to their classmates.
The proposed method for assessing students’
online activity is a) flexible, you can decide what
parameter to use in order to measure the activity
(time, hits, a combination of both) and the frequency
with which the indicators are generated; b)
extensible, you can decide which resources to
measure; and c) independent from the LCMS, which
means, you can use data registered in it or in any
learner trace collector which is available.
The results obtained in our case study show that
our indicators adequately reflect the activity carried
out by the students, according to the instructor’s
criteria.
Our next work will be to obtain the indicators
with other criteria (see Table 1) in order to analyse
the behaviour and the information which they offer,
and the advantages and disadvantages which each
criterion presents. After that, we will automate the
calculation of the student activity indicators and
obtain them in other virtual courses to check their
validity and generality. Next, we will develop a
software module with which instructors can
configure the parameters for their courses and
request the reports which they want to analyse.
Lastly, we will gather the opinion of students and
instructors with respect to how useful these
indicators are.
ACKNOWLEDGEMENTS
The authors are deeply grateful to CEFONT, the
department of the University of Cantabria which is
responsible for LCMS maintenance, for their help
and collaboration. Likewise, the authors gratefully
acknowledge the valuable suggestions of the
anonymous reviewers.
This work has been partially financed by Spanish
Ministry of Science and Technology under project
‘TIN2007-67466-C02-02’ and ‘TIN2008 – 05924’.
REFERENCES
Álvarez, V., 2008. E-learning survey. Available at:
http://www.di.uniovi.es/~victoralvarez/survey/
[Accessed 03 October 2009].
Conrad, D. L., 2002. Engagement, excitement, anxiety and
fear: Learners’ experiences of starting an online
course. American Journal of Distance Education,
16(4), pp. 205–226.
Chan, A., Chow, K.O., Cheung, K.S., 2004. Student
Participation Index: Student Assessment in Online
Courses. Lecture Notes in Computer Science, 3143,
pp.449-456.
Douglas, I., Alemanne, N.D., 2007. Monitoring Student
Participation and Effort. Proceedings of the IADIS
International Conference on Cognition and
Exploratory Learning in Digital Age (CELDA 2007).
Lisbon, Portugal. IADIS Press, pp. 299-302.
Douglas, I., 2008. Measuring Participation in Internet
Supported Courses. International Conference on
Computer Science and Software Engineering, 5, pp.
714-717.
Hijon, R., Velazquez, A., 2006. E-learning platforms
analysis and development of students tracking
functionality. In E. Pearson & P. Bohman (Eds.),
Proceedings of World Conference on Educational
Multimedia, Hypermedia and Telecommunications.
Chesapeake, VA: AACE.
Juan, A., Daradoumis, T., Faulin, J., Xhafa, F., 2008. A
Data Analysis Model based on Control Charts to
Monitor Online Learning Processes. International
AN APPROACH TO MEASURE STUDENT ACTIVITY IN LEARNING MANAGEMENT SYSTEMS
27

Journal of Business Intelligence and Data Mining,
4(2), pp. 159-174.
Jusung, J., 2005. Understanding e-dropout?. International
Journal on E-Learning 4(2), pp. 229-240.
Lera-López, F., Faulin, J., Juan, A.A., Cavaller, V. 2009.
Monitoring Students’ Activity and Performance in
Online Higher Education: a European Perspective.
Monitoring and Assessment in Online Collaborative
Environments: Emergent Computational Technologies
for E-Learning Support. Angel A. Juan et al. (Eds),
IGI Global.
Levy, Y. 2007. Comparing dropouts and persistente in e-
learning courses. Computers & Education, 48, pp.
185-204.
Mazza, R., Dimitrova, V., 2007. CourseVis: A graphical
student monitoring tool for supporting instructors in
web-based distance courses. International Journal of
Human-Computer Studies 65(2), pp. 125-139.
Milani, C., Mazza, R., 2007. GISMO: a Graphical
Interactive Student Monitoring System for Moodle.
Available at: http://gismo.sourceforge.net [Accessed
03 October 2009].
Pendergast, M., 2006. An analysis tool for the assessment
of student participation and implementation dynamics
in online discussion forums. ACM SIGITE Newsletter,
3(2), pp. 10-17.
Xenos, M., Pierrakeas, C., Pintelas, P., 2002. A survey on
student dropout rates and dropout causes concerning
the students in the course of informatics of the
Hellenic Open University. Computers & Education,
39(4), pp. 361–377.
Zhang, H., Almeroth, K., Knight, A., Bulger, M., Mayer,
R., 2007. Moodog: Tracking Students' Online
Learning Activities. World Conference on Educational
Multimedia, Hypermedia & Telecommunications (ED
MEDIA), Vancouver, Canada.
Zinn, C., Scheuer, O., 2006. Getting to know your student
in distance learning context. In Innovative approaches
for learning and knowledge sharing, Lecture Notes in
Computer Science 4227, pp. 437-451. Berlin,
Germany: Springer.
Zorrilla, M.E., Álvarez, E.E., 2009. Proposal of a set of
reports for Students’ Tracking and Assessing in e-
Learning Platforms. Monitoring and Assessment in
Online Collaborative Environments: Emergent
Computational Technologies for E-Learning Support.
Angel A. Juan et al. (Eds), IGI Global.
Zorrilla, M., Álvarez, E., 2008. MATEP: Monitoring and
Analysis Tool for e-Learning Platforms. Proceedings
of the 8th IEEE International Conference on Advanced
Learning Technologies. Santander, Spain.
CSEDU 2010 - 2nd International Conference on Computer Supported Education
28
