
WEB ANALYTICS
Analysing, Classifying and Describing Web Metrics with Fuzzy Logic
Darius Zumstein
Information Systems Research Group, University of Fribourg, Boulevard de Pérolles 90, 1700 Fribourg, Switzerland
Keywords: Web analytics, Web controlling, Web metrics, Electronic business, Customer relationship management,
Fuzzy classification, Fuzzy logic, Computing with words.
Abstract: In the Internet economy, it has become a crucial task of electronic business to monitor and optimize web-
sites, their usage and online marketing success. Web analytics, which is defined as the measurement, collec-
tion, analysis and reporting of Internet data, is an effective instrument of website management. First, this
paper describes the technical functionality and use of web analytics and discusses different web metrics.
Second, a fuzzy web analytics approach is proposed, which makes it possible to classify metrics precisely
into more than one class at the same time. Third, a fuzzy web metrics index has been developed for multi-
dimensional, intelligent web analysis. Fuzzy logic enables computing with words and more intuitive, hu-
man-oriented queries, segmentation and descriptions of metrics in natural language. Finally, a web analytics
framework is suggested to analyze and control key performance indicators in a web controlling loop.
1 INTRODUCTION
Since the development of the World Wide Web 20
years ago, company websites have become a crucial
instrument of information, communication and elec-
tronic business. With the growing importance of the
web, the analysis, monitoring and optimization of a
website and online marketing, web analytics, is now
an important issue for business practice and academ-
ic research. Web analytics (WA) enables better un-
derstanding of the traffic and behavior of users on
websites, by analyzing different metrics and success
factors, i.e. key performance indicators (KPIs).
Today, many companies are using web analytics
software from providers like Google, Nedstad, Web-
Trends or Omniture to collect, store and analyze web
data. These tools provide dashboards and reports
with many metrics to web analysts and managers,
responsible for planning and decision-making about
website-related activities. One problem of measure-
ment-based reports is that all values, e.g. the number
of page views, visits, visitors or conversions, are
often raw numbers and therefore difficult to interp-
ret. Usually, they only make sense in comparison
with past values, target values or external values, or
if segmented by other metrics. Another problem is
that web data and metrics are usually reported, clas-
sified and evaluated in a sharp manner.
This paper proposes a fuzzy logic approach mak-
ing it possible to classify web data and metrics fuzzi-
ly and to analyze and express their values with mea-
ningful linguistic variables (i.e. words or word com-
binations). After an initial presentation of the func-
tionality and use of WA, different web metrics are
introduced in section 2. Section 3 explains and ex-
emplifies the fuzzy logic approach, showing how it
can be used for classifying, indexing, segmenting
and computing with words. Section 4 explains the
web controlling loop and section 5 offers a conclu-
sion and outlines likely future developments.
2 WEB ANALYTICS
2.1 Definition
According to the Web Analytics Association (2009),
web analytics is the measurement, collection, analy-
sis and reporting of Internet data for the purposes of
understanding and optimizing web usage.
Weischedel et al. (2005) define WA as the moni-
toring and reporting of website usage so that enter-
prises can better understand the complex interactions
between website visitor actions and website offers,
as well as leverage insight to optimize the site for
increased customer loyalty and sales.
282
Zumstein D.
WEB ANALYTICS - Analysing, Classifying and Describing Web Metrics with Fuzzy Logic.
DOI: 10.5220/0002778502820290
In Proceedings of the 6th International Conference on Web Information Systems and Technology (WEBIST 2010), page
ISBN: 978-989-674-025-2
Copyright
c
2010 by SCITEPRESS – Science and Technology Publications, Lda. All rights reserved

However, it is not only web usage and online
sales which can be monitored, but other goals of a
web presence too. In this paper, therefore, web ana-
lytics is defined as the selection, definition, analysis
and evaluation of key performance indicators (KPIs)
and web metrics in order to verify the achievement
of website-based objectives.
2.2 Functionality of Web Analytics
Technically, in web analytics a distinction can be
made between five different approaches to collecting
data: the analysis of log files (server-side data col-
lection), page tagging (client-side data collection),
the use of packet sniffing, web beacons and reverse
proxies. The following paragraphs focus on log file
analysis and page tagging, as other methods are not
often used in research and business practice.
Server-side Data Collection. In this method, data
from log files are extracted and analyzed. Each time
a web page is loaded in a browser, data such as the
user’s IP address and the names of requested files is
saved with a time stamp in the log file of a web
server. The advantage of log file analysis is that all
requests and file downloads (text, PDF, picture or
video files) from a web server are logged. However,
one disadvantage of log file analysis is that traffic
on the site is not measured exactly because of the
caching in browsers and proxy servers. Additionally,
the requests from search engines, robots and craw-
lers distort the statistics. Moreover, visitors cannot
be identified distinctly, and user actions like mouse
clicks are not tracked either. Finally, the extraction,
preparation and analysis of log files can be complex
and time-consuming. Given these problems, log file
analysis has lost ground in recent years. Today, most
tools are using page tagging, or hybrid methods (us-
ing both server- and client-side data collection).
Client-side Data Collection. In this WA method, a
piece of JavaScript code is inserted in each HTML
page. If a page is loaded in the client’s browser, the
JavaScript is executed, a 1x1 pixel tag loaded, and
all data regarding the page view and the visitor’s
actions is transmitted to an internal or external track-
ing server. Using cookies, data about each user and
that user’s sessions are recorded.
Client-side WA solutions are mostly provided as
‘software as a service’ (SaaS) by application service
providers (ASP). They have many advantages: First,
all of the actions of each website user are recorded
in real time, i.e. all mouse clicks and all keyboard
entries. Technical information about users is cap-
tured too: the size, resolution and colors of the moni-
tor, type and language of the browser and operating
system, and all plug-ins installed. Second, there is no
caching in browsers or proxies, and the JavaScript is
not read by search engine crawlers and robots. Final-
ly, the tagging method can be implemented easily
and no IT specialists are needed. Despite data priva-
cy issues, the client-side data collection method has
become the standard method in web analytics.
2.3 Use of Web Analytics
The use of web analytics depends on the objectives
of a website. However, the main benefits are:
User and Customer Orientation. With WA the
tracking system reveals the information (pages, con-
tent, files) and services (searches, forms, blogs,
RSS) accessed by users. By analyzing information
demand, a high degree of user and customer orienta-
tion can be guaranteed, which is valuable for CRM.
Website Optimization. Based on an analysis of
each user’s information accessing behaviour, web-
sites can be adapted to their surfing, clicking, navi-
gation and search characteristics. Moreover, website
quality can be improved by testing and optimizing
the navigation, structure, links, functionality, usabili-
ty, design and content of the website.
Search Engine Optimization. WA is used to ana-
lyze and monitor search engine optimization (SEO)
and marketing (SEM). The goal of SEO and SEM is
to improve rankings in search engines, using certain
techniques. Web analytics tools reveal where users
are located (continent, country and place) and identi-
fy the search words used to find the web page.
Optimization of Online Marketing. Additionally,
WA can help to measure the effects of online mar-
keting instruments like banner advertisements, news-
letters, surveys and online campaigns.
Finally, WA facilitates rational decision-making,
and target- and performance-oriented management
of websites in order to improve e-business success.
2.4 Web Metrics
For WA, a number of metrics have been reported.
These are listed in Table 1 and appear in Figure 1.
The number of page views, visits, visitors and
the time on page are the standard metrics measured
by most tools and which have often been discussed
in the literature (see e.g. Sterne 2002, Peterson 2005,
Kaushik 2009). The main KPIs of web usage a
WEB ANALYTICS - Analysing, Classifying and Describing Web Metrics with Fuzzy Logic
283

Figure 1: Relations between important web metrics.
Table 1: Definitions of various web metrics.
Page views Number of page views (impressions
of a web page) accessed by a human visitor
Visits A sequence of page views (sessions)
requests of a visitor without interruption
Visitors Number of unique visitors (users) on a website
(excluding crawlers, robots, spiders)
Time on page Average length of time spent on a web page by
all visitors
Stickiness Ability of a web page to keep a visitor on the
website
Bounce rate % of single page view visits (users quit the page
immediately without further action)
Frequency # of visits a user has made to the website
Visit
recency
Number of days since a visitor’s last visit to the
site
Visit length Length of visit, the time visitors spend on the
website (in seconds)
Visit depth # of pages accessed by a visitor on a visit
Conversion
rate
Proportion of visitors (users, surfers) becoming
online customers (buyers)
Ad conver-
sion rate
Proportion of visitors clicking on a banner and
then making a purchase on the website
Display
click rate
Proportion of visitors viewing one or more prod-
uct/service pages
Click-to-
basket rate
Proportion of visitors putting one (or more)
product(s) in the shopping basket
Basket-to-
b
uy
rate
Proportion of visitors paying for a product after
placing it in the shopping basket
Order
rate
Proportion of visitors ordering a product after
viewing the product page
Repurchase
rate
Proportion of online customers making repeat
purchases on the website
Purchase
recency
Length of time since the online customer’s last
purchase on the website
Purchase
frequency
Number of purchases made by an online custom-
er on the website for a certain period
Monetary
value
Monetary value, e.g. revenues, from an online
customer for a certain period
considered to be stickiness, visit frequency, length of
visit and depth of visit. If products or services are
offered in an online shop, additional metrics and
numbers of transaction are useful to analyze and
control electronic business and electronic commerce.
Which product pages were visited? Which prod-
ucts were put in the electronic shopping cart and
which were actually purchased? In order to optimize
pages, processes, e-shops or product mixes it is im-
portant to have the answers to these questions.
Finally, conversion and order rates, purchase
frequency and recency, revenues and profits are also
all KPIs of electronic commerce.
3 FUZZY WEB ANALYTICS
3.1 Fuzzy Classification of Metrics
The theory of fuzzy logic and fuzzy sets goes back
to Lofti A. Zadeh in 1965. It takes the subjectivity,
imprecision, uncertainty and vagueness of human
thinking and language into account, and expresses it
with mathematical functions.
A fuzzy set can be defined formally as follows
(1; Zimmermann 1992, Meier et al. 2008): if X is a
set, then a fuzzy set A in X (A
⊂ X) is defined as
()
(
)
{
}
,
iAi
Ax x
μ
=
(1)
where x
i
∈ X, µ
A
: X → [0, 1] is the membership
function of A and µ
A
(x) ∈ [0, 1] is the membership
degree of x in A. In what follows, an illustration of
fuzzy web analytics is provided. In a sharp set (see
Figure 2a), the terms “few”, “medium” or “many” of
the linguistic variable (web metric) “page views”
can be either true (1) or false (0). A value of 1 of the
membership function µ (Y-axis in Figure 2a) means
that the number of page views (on the X-axis) corre-
sponds to one set. A value of 0 indicates that a num-
Le
g
end:
Basket
Conversion rate
Order rate
Web metrics of
website usage
Order
Product page
Entry page
Web
Exit
p
a
g
e
Search
engines
Bookmarks,
URL entries
Online
advertising
Ad conversion rate
Online revenues and
p
ro
f
i
t
(e.g. per visit, visitor, order)
External
links
Stickiness
Web metrics of
e-commerce
N
umber of (new and
returning) customers
Clic
k
-stream & clic
k
-
p
ath
Depth of visit
Length of visit
(Visit) frequency
Click rate
Reach
Display
click rate
Click-to-
b
aske
t
Basket-to-buy
rate
N
umber of
p
a
g
e views
Average time on page
Number of visitors
Number of visits
Ad click
rate
Key performance indicators (KPIs) Web metric
Bounce Rate
Purchase
fr
e
q
uenc
y
& recency
Metric ratio (rate)
WEBIST 2010 - 6th International Conference on Web Information Systems and Technologies
284
ber of page views does not belong to one of the sets.
In the illustration, the number of page views is de-
fined as “few” between 0 and 32, while 33 to 65 is
“medium” and more than 66 is classified as “many”.
If page 1 is visited 65 times, it is classified in the
“medium” class, while web page 2, with 69, has
“many” views. Although the two pages have been
visited nearly the same number of times, they are
assigned to two different sets. In contrast, when de-
fining fuzzy sets (Figure 2b) by membership func-
tions, there are continuous transitions between the
terms “few”, “medium” and “many”. In a fuzzy ap-
proach, the number of page views for page 1 is clas-
sified both as “medium” (0.55 or 55%) and as
“many” (45%).
Figure 2: One-dimensional sharp (a) and fuzzy (b) classi-
fication of the web metric page views.
Page 2 also has part membership in two classes at
the same time (60% for “many” and 40% for “me-
dium”).
Now, an additional web metric, the bounce rate,
can be considered. Web page X has a “low” bounce
rate (and is therefore "sticky") if visitors view at
least one other page (Y) after visiting page X. Page
X has a “high” bounce rate if visitors leave the web-
site immediately after viewing page X (e.g. by clos-
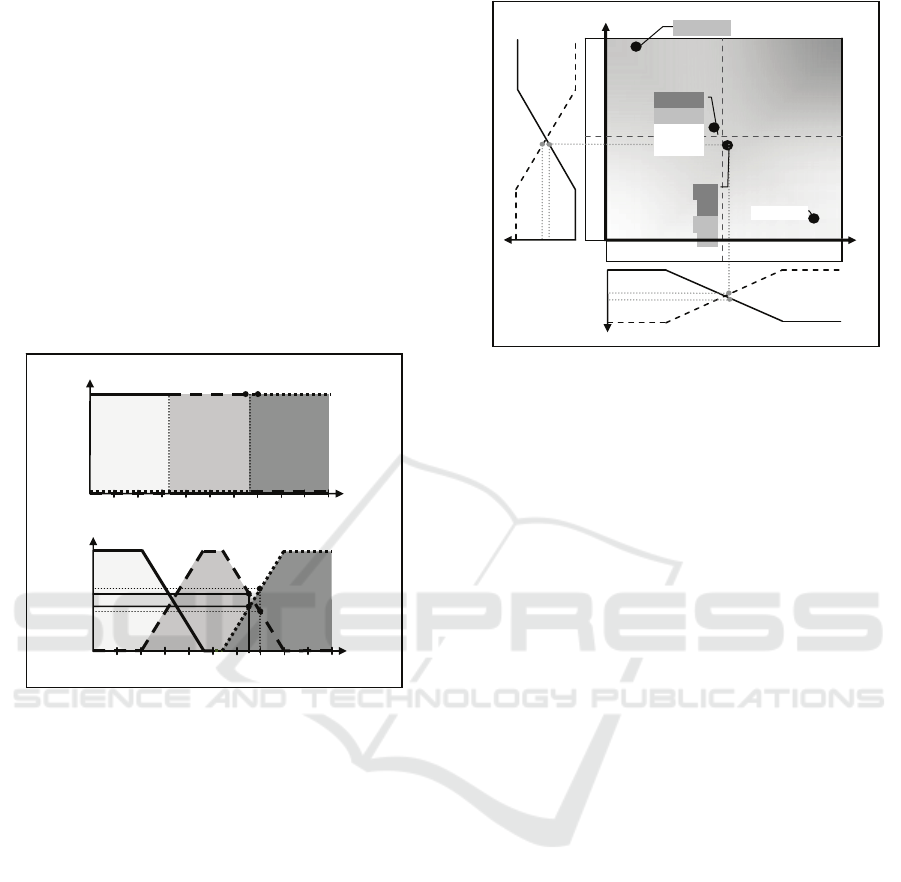
ing the browser window). As can be seen in Figure
3, the two metrics ‘page views’ and bounce rate’
define a two-dimensional matrix with four classes:
Class 1 (C1) is defined by a high bounce rate and
many page views, while the pages in C2 - "leaky
flop pages" - have high bounce rates and few views.
C3 represents “sticky top pages”, and pages in C4
are also sticky, but have few page views. Here too,
the sharp classification of web pages is problematic:
although web page C has almost the same values as
B, C is classified as a “leaky flop page”, and B falls
into the opposite group as a “sticky top page”.
Figure 3: Two-dimensional fuzzy classification of the web
metrics ‘page views’ and ‘bounce rate’.
If a web analyst wants to identify all pages in C3,
a sharp query will return page B and A, but not page
C, although B & C are in very similar positions. In a
fuzzy classification, sharp boundaries disappear and
pages can belong to more than one class. In a fuzzy
approach, pages like B and C in the middle of the
matrix, belong to four classes at the same time.
The basis for calculating the values for each class
is the γ-operator in equation (2). This algebraic
product operator, known as the “compensatory and”,
has been empirically tested by Zimmermann (1992).
μ
Ai
x
()
=
μ
i
x
()
i=1
m
∏
⎛
⎝
⎜
⎞
⎠
⎟
1
−
γ
⋅ 1 − 1 −
μ
i
x
()
()
i=1
m
∏
⎛
⎝
⎜
⎞
⎠
⎟
γ
(2)
where x
∈ X, γ ∈ [0, 1] and µ
i
is the membership
degree between 0 and 1 in a class (x); m is the num-
ber of fuzzy sets A
1
, …, A
m
defined over the refer-
ence set X with membership functions µ
1
,…, µ
m
; γ is
a constant used to influence the degree of member-
ship in the classes. Here, γ is defined as 0.5. The
product is calculated with the membership degrees
of each class and their inverted values (1 - µ
i
(x)).
For example, the membership degree of page B
(in Figure 3) in class 1 is calculated as follows (3):
C1 = .58⋅ .47
()
1−.5
()
⋅ 1 − 1 − .58
()
()
⋅ 1 − .47
()
(
)
.5
= .2726
(3)
Obviously, the definition of fuzzy sets allows grad-
ual ranking within classes, and as a result, more pre-
cise classifications of web metric values. In addition,
data can be classified without loss of information.
Fuzzy classifications of KPIs like revenues and con-
version rates are especially important, since their
values have far-reaching consequences for business.
µ
1
0
few
medium
many
Web page 1
Web page 2
0 10 20 30 40 50 60 70 80 90
a)
100
Page views
(per day)
Web
p
a
g
e 1
µ
1
0.40
0.60
0.45
0.55
Web page 2
few medium
many
Page views
(per day)
b
)
0
0 10 20 30 40 50 60 70 80 90 100
Bounce rate
100% C2)
1
C1)
Leaky
top pages
μ
C2)
L
eaky flop page
Page D
μ low
Page views (per day)
.50
Pa
g
e C
.49
Page
B
C4)
Sticky flop
pages
C3)
Sticky
top pages
27%
C1)
20%
C2
)
100% C3
)
Page A
0
0.53 0.47
1
0
10050 49 1
0
0.4
2
0.58
1
μ
few
μ
25% C1)
35% C2)
17% C3)
23% C4)
WEB ANALYTICS - Analysing, Classifying and Describing Web Metrics with Fuzzy Logic
285
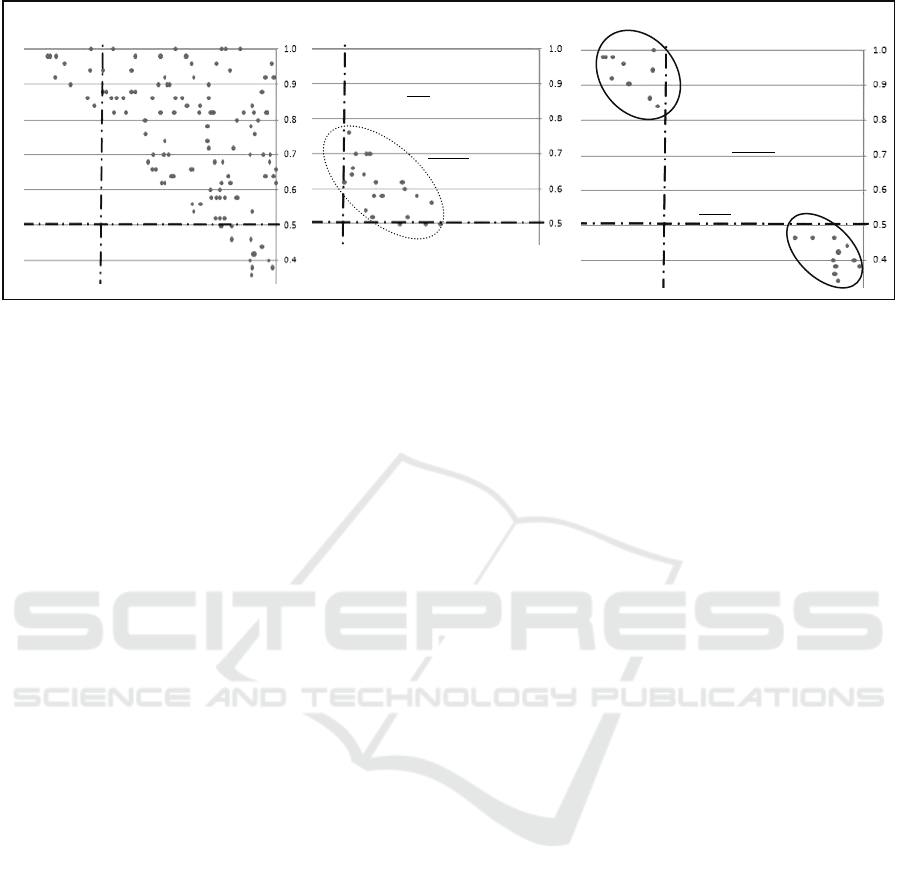
Figure 4: Example of fuzzily classified web metrics.
3.2 Comparison of Sharp and Fuzzy
In what follows a specific example of fuzzily classi-
fied metrics is presented, focusing on class 1 (C1 in
Figure 3 or 4). In a sharp classification, metrics of
pages belong strictly to one class only (e.g. to C1;
note that the data in Figure 4 is normalized in values
between 0 and 1).
In a fuzzy classification, we can select metrics
which belong to C1 with a certain degree of mem-
bership (for C1 in Figure 4a it is 33%). Figure 4b
shows that in comparison to a sharp classification:
Some data in the corner of the class 1 is no longer
considered as in that class when we use a fuzzy clas-
sification. That is, this data is undervalued in a sharp
classification. In contrast, other fuzzily classified
data do belong partially to C1 (Figure 4c), while in a
sharp classification they are excluded.
This comparison shows the differences between
a sharp and fuzzy classification of metrics. While in
a sharp classification web data belongs strictly to
one class, in a fuzzy classification data can be classi-
fied more appropriately and handled more flexibly.
In a fuzzy classification, the risks of misclassifica-
tion (under- or overvaluations) of data near the class
border are reduced.
3.3 Fuzzy Web Metrics Index
Classifications are not bound to one dimension (in
Figure 2) or two dimensions (in Figure 3 and 4). In
an index, for instance, any number of web metrics
(dimensions) can be modelled simultaneously.
If an index (I) is the aggregation of a number of
weighted (w) web metrics (wm) values of a website
with a number of different web pages (g) in period
(p), equation (1) in section 3.1 is adapted as follows
(4):
I
p
g
= w
wm
x
i
,
μ
wm
x
i
()
(
)
(
)
1
wm
∑
(4)
Eight metrics of table 1 are considered in the index
(5): page views (PV), visitors (VS), visits (VI), aver-
age time on page (TP), length of visit (LV), depth of
visit (DV), visit frequency (VF) and stickiness (ST).
I
p
g
= w
PV
x
i
,
μ
PV
x
i
(
)
(
)
+ w
VS
x
i
,
μ
VS
x
i
()
(
)
+w
VI
x
i
,
μ
VI
x
i
()
()
+ w
TP
x
i
,
μ
TP
x
i
()
()
+ w
LV
x
i
,
μ
LV
x
i
()
()
+w
DV
x
i
,
μ
DV
x
i
()
()
+ w
VF
x
i
,
μ
VF
x
i
()
()
+ w
ST
x
i
,
μ
ST
x
i
()
(
)
(5)
Assuming that all metrics have the same weight (w
=1), equation (4) can be defined, in which the value
µ
wm
(x
i
) of a single web metric (wm) is assigned to a
linguistic term (class) “low”, “medium” or “high”:
wm
p
g
=
x
low
,
μ
wm
x
low
()
(
)
,
x
medium
,
μ
wm
x
medium
()
()
,
x
high
,
μ
wm
x
high
()
()
⎧
⎨
⎪
⎪
⎩
⎪
⎪
⎫
⎬
⎪
⎪
⎭
⎪
⎪
(6)
In the example of equation 7, a page 1 (g = 1) has
the following normalized values in period 1 (p = 1):
wm
1
1
=
PV, 0.752
(
)
, VS, 0.389
(
)
, VI, 0.324
()
,
TP, 0.141
()
, LV, 0.108
()
, DV, 0.907
()
,
FR, 0.789
()
, ST, 0.945
()
⎧
⎨
⎪
⎩
⎪
⎫
⎬
⎪
⎭
⎪
(7)
In a sharp multidimensional classification (in Figure
5a), values between 0 and 0.333 belong to “low”,
0.334 to 0.666 to “medium” and 0.667 to 1 to
“high”. For instance, the metric visits (VI) with the
value 0.324 belongs to one class (“low” in 8) only:
VIsharp
1
1
= x
i
,
μ
PV
x
i
()
(
)
{
}
= x
low
,1
()
{
}
(8)
Applying (2), in a fuzzy classification (Figure 5b)
the value of visits belongs to two classes in (9).
c)
b)
Fuzzily classified web
metrics not
belonging
to C1 (sharply classified
belonging to C1;
=> under
valued)
Fuzzily classified web
metrics partly
belonging
to C1 (sharply classified
not belonging to C1;
=> ove
r
valued
)
C1)
C1)
C1)
a) Fuzzily classified
web metrics belonging
with>33% to class C1)
b+c) Fuzzily classified web metrics partly
belonging to more than one class at the same time
WEBIST 2010 - 6th International Conference on Web Information Systems and Technologies
286

VIfuzzy
1
1
= x
i
,
μ
PV
x
i
()
()
{}
= x
low
,0.57
()
, x
medium
,0.43
()
{
}
(9)
Figure 5: Multi-dimensional sharp (a) and fuzzy (b) classi-
fication of an index with eight web metrics.
A fuzzy index, represented in graphic form in
Figure 5b, is an intelligent web analytics system
which can model and measure a website’s most im-
portant KPIs and web metrics. On an aggregated
level, it makes it possible to display and analyze the
performance of web usage and e-business, and to
compare different web pages and users (segments).
Moreover, it monitors changing values over time.
As the following sections will show, with a
fuzzy index both quantitative data and qualitative
criteria can be modelled with linguistic words.
Peterson proposes a sharp index to measure user
interactivity and engagement (Peterson 2006):
I
Engagement
= C
i
+ R
i
+ D
i
+ L
i
+ B
i
+ F
i
+ I
i
+ S
i
()
(10)
C
i
stands for intensive visits, R
i
for visit recency, D
i
for engaged visits, B
i
for brand index, F
i
for feed-
back index, L
i
for loyalty and S
i
for subscription
index. If users are more interactive and engaged, one
or more metric(s) increase and so does the index.
However, index values are abstract and difficult
to interpret. For this reason, WA needs a language-
based approach to reading and analyzing web data.
3.4 Web Analytics with Words
Sections 3.1 and 3.2 explained that linguistic terms
are used to describe membership functions of fuzzy
sets in order to classify metrics more exactly.
Moreover, the fuzzy logic approach makes it
possible to describe, analyze and evaluate results
and changes in web analytics using human language.
In soft computing, this is called computing with
words (Zadeh 1996, 1999) and the consideration of
perception-based information (Zadeh 2004).
For instance, a tool reported 1,718 page views in
June (see left of Figure 6). What does this measure-
ment-based information say to the analyst? Nothing,
as long as the analyst cannot compare this absolute
number with an internal or external benchmark. If in
July 5,897 page views were recorded, the analyst
knows from experience that this is ”much more”
than the month before. If the number of visitors in-
creased by 2.3% in 2009, the analyst might state that
the number of visitors ”increased slightly” in 2009.
Many other examples of analysis show that humans
have a perception-based rather than a measurement-
based approach to interpreting, describing and com-
municating web data and information.
WA tools report oodles of numbers, but web ana-
lysts often have difficulty interpreting web data,
recognizing trends and deriving useful conclusions.
In future intelligent web analytics systems will ana-
lyze and interpret data in a (semi or fully) automatic
system. They will give meaningful answers to rele-
vant business questions, which can be selected or
formulated in natural language. For instance, an ana-
lyst may ask a fuzzy web analytics system:
• Which web or product pages have “many pages
views” and “low bounce rates” (C1 in Figure 3)?
• Which product pages have “high order rates”?
• Which products or buyers have “high revenues”?
• Which visitors are “very loyal” and have “high
engagement”?
3.5 Definition of Fuzzy Concepts
The fuzzy logic approach makes it possible to work
with quantitative metrics (hard facts like revenues)
and qualitative variables (soft criteria like engage-
ment or loyalty) at the same time.
In fact, the strength of the fuzzy logic approach
is the possibility to define and use qualitative, lin-
Page views
Visitors
Visits
Time on page
Length of visit
Depth of visit
Visit
frequency
(loyalty)
Stickiness
Page views
Visitors
Visits
Time on page
Length of visit
Depth of visit
Visit
frequency
(loyalty)
Stickiness
low
m
edium
hi
g
h
Pa
g
e 1
0.333
0.666
1
0.389: 100%
medium
0.324: 100%
low
58% mediu
m
42% low
42% low
58% mediu
m
43% mediu
m
57% low
1
a)
b)
VSsharp
1
1
= x
medium
,1
(
)
{
}
VIsharp
1
1
= x
low
,1
(
)
{
}
VSfuzzy
1
1
=
x
low
,0.42
()
,
x
medium
,0.58
()
⎧
⎨
⎪
⎩
⎪
⎫
⎬
⎪
⎭
⎪
VIfuzzy
1
1
=
x
low
,0.57
()
,
x
medium
,0.43
()
⎧
⎨
⎪
⎩
⎪
⎫
⎬
⎪
⎭
⎪
WEB ANALYTICS - Analysing, Classifying and Describing Web Metrics with Fuzzy Logic
287

guistic variables besides quantitative ones, which is
not possible in binary computing.
Figure 6: Measurement-based and perception-based
information about website traffic.
For example, a analyst may define the following
fuzzy concepts (Fasel & Zumstein 2009):
• “high traffic period”,
• “above-average conversion rates”,
• “strong online customer loyalty”,
• “attractive web pages” or
• “high visitor value”.
Time is an example of a dimension which benefits
significantly from the use of fuzzy constructs. It does
not suddenly become evening at 6 pm, or night at 10
pm. Human beings perceive a fluent transition be-
tween afternoon, evening and night (see Figure 7a).
Similarly, different seasons such as spring, summer,
autumn and winter do not start and end abruptly, and
neither do seasonal variations, like the high season
in summer (in Figure 7b).
In a sharp classification of the construct ‘eve-
ning’, only page views between 6 pm and 8 pm are
displayed (but arbitrarily not those at 5.59 or 8.01).
Within a fuzzy logic approach, page views after 4
and up until 10 pm are considered to have a certain
membership degree (at 5 pm this is 50% afternoon
and 50% evening in Figure 7a). Moreover, uncer-
tainty and imprecision can be taken into account. For
instance, warm summertime is “most” between June
and August, but “sometimes”, summers already start
in May and end later in September (Figure 7b).
Fuzzy time concepts are promising for web ana-
lytics, since they allow new types of deeper analysis.
For example, the web analyst can query: “give me…
• all web pages with many page views and low
bounces rates in the evening.”
• all web pages with high conversion rates in the
high season.”
• the most loyal customers with high purchase fre-
quency and high online revenues.”
The more metrics are considered in web analytics,
the more difficult it is to draw conclusions from the
web data. Qualitative statements in human language,
which are transformed into computer language by
fuzzy logic, reduce complexity and help to analyze
and interpret web usage data.
Figure 7: Fuzzy time constructs: afternoon, evening and
night (a), and summer (b).
4 WEB CONTROLLING LOOP
To implement fuzzy web analytics effectively, man-
agement first has to define the goals of a web offer
at a strategic level (number 1 in the WA architecture
of Figure 8). Websites have many objectives, such
as informing, communicating, branding, advertising,
lead generating, selling, supporting, entertaining or
community-building. Consequently, website success
is linked to the achievement of specific goals
(Bélanger et al. 2006). KPIs and metrics are derived
and defined according to the goals of the website
(2). After collecting data on the website and data
layer, metrics are analyzed and controlled regularly
in an ongoing process of web controlling (4 to 5).
The web controlling loop (6) makes it possible to
monitor the achievement of website objectives and
plans (3), and to (re)act on an operational level (7).
Finally, the controlling loop enables the ongoing
optimization of website quality, electronic marketing
and CRM in a dedicated manner. This permits web
managers to allocate resources more effectively.
0
Time (hours pm)
12 1 2 3 4 5 6 7 8 9
10
11
12
µ
1
Afternoon
Evening Night
a)
Time (month)
µ
1
0
May June
July
August
September
Summer (high season)
b)
sometimes
most
0.5
measurement-based
numerical
perception-based
linguistic
Web analytics information
(web data and metrics)
Total page views:
June 2009: 1,718
July 2009: 5,897
Number of visitors
2009: +2.3%
Most visits lasted
0-10 seconds
The site had many more
page views in June 2009
than in July 2009
The number of visitors
increased slightly in
2009
Most visits lasted:
WEBIST 2010 - 6th International Conference on Web Information Systems and Technologies
288

Figure 8: Web analytics architecture with different layers
and the web controlling loop.
5 CONCLUSIONS
This paper has introduced a fuzzy logic approach to
web analytics and discussed a number of indicators
and metrics in web analytics.
Fuzzy web analytics has several advantages:
• precise classification of elements (e.g. web data
and metrics) in classes and a gradual ranking
within classes
• reduction of complexity (of web data and infor-
mation overload) without loss of information
• use of quantitative variables (numerical values)
and qualitative variables (non-numerical values)
• use of linguistic variables or terms for queries
and computing with words
• human-oriented, perception-based and intuitive
processing of web data, metrics and information
• dynamic and multidimensional analysis consider-
ing different metrics, and the
• consideration and mapping of concepts and con-
structs which are intrinsically fuzzy, i.e. vague,
uncertain or subjective per definition.
Nevertheless, fuzzy logic is confronted with certain
problems:
• Sharp classification is usually clear, simple and
straightforward for everyone. In contrast, fuzzy
classification is more complicated, not as easy to
understand, to communicate and to implement.
• Fuzzy classifications can be confusing or even
contradictory, if an object can belong to differ-
ent, conflicting classes at the same time.
• In practice, some decisions have to be "sharp". In
these situations, fuzzy classifications may not be
adequate.
Moreover, the theoretical approach of this paper has
to be tested with real web data from e-business in
future studies. In fact, case studies with firms are
already planned to show the advantages and limita-
tions of the fuzzy logic method in web analytics.
The research center Fuzzy Marketing Methods
(www.FMsquare.org) is engaged with applications
of fuzziness to different domains in information sys-
tems. FMsquare provides a number of open source
prototypes, including the fCQL (fuzzy classification
query language) toolkit, which enables fuzzy queries
and the calculation of membership degrees of data
stored in MySQL or in PostgreSQL databases.
REFERENCES
Clifton, B., 2008. Advanced Web Metrics with Google
Analytics, Wiley. New York.
Fasel, D., Zumstein, D., 2009. A fuzzy Data Warehouse
Approach for Web Analytics, In: Proceedings of the
2
nd
World Summit on the Knowledge Society (WSKS
2009), September 16-18, Crete, Greece.
Galindo, J. (Ed.), 2008: Handbook of Research on Fuzzy
Information Processing in Databases, Idea, Hershey.
Kaushik, A., 2009. Web Analytics 2.0: The Art of Online
Accountability and Science of Customer Centricity,
Wiley. New York.
Bélanger, F., Fan, W., Schaupp, C., Krishen, A., Everhart,
J., Poteet, D., Nakamoto, K., 2006. Web Site Success
Metrics: Addressing the Duality of Goals, In: Commu-
nication of the ACM, Vol. 49, No. 12, pp. 114-116.
Meier, A., Stormer, H., 2009. eBusiness and eCommerce:
Managing the Digital Value Chain, Springer, Berlin.
Meier, A., Schindler, G., Werro, N., 2008. Fuzzy Classifi-
cation on Relational Databases, In: (Galindo 2008,
pp. 586-614).
Peterson, E. T., 2005. Web Site Measurement Hacks,
O’Reilly. New York.
Peterson, E. T., 2006. The Big Book of Key Performance
Indicators, Available: www.webanalyticsdemystified.
com (accessed 31
st
of January 2010).
Phippen, A., Sheppard, Furnell, S., 2004. A practical eval-
uation of Web analytics, In: Internet Research, Vol.
14, pp. 284-293.
Sterne, J., 2002. Web Metrics, Wiley. New York (2002)
Web Analytics Association, 2009. Available:
http://www.webanalyticsassociation.org/aboutus
(accessed 31
st
of January 2010).
Weischedel, B., Matear, S., Deans, K., 2005. The Use of
eMetrics in Strategic Marketing Decisions: In: Int.
Management
layer
Data
layer
Website
layer
Web
page 1
Visits
Server-
s
ide
data
collection
Users
Plan
WA
software
on tracking
serve
r
Client-
s
ide
data collection
Web
page 2
Web
page n
Log
files on
web server
Page Tagging
Act
Define
Website objectives
Controlling loop
Analyze
Control
KPIs
Analytical level
Operational leve
l
Reports &
Dash
b
oards
Strategic level
eCRM &
eMarketing
eBusiness
o
n
s
u
p
q
r
t
WEB ANALYTICS - Analysing, Classifying and Describing Web Metrics with Fuzzy Logic
289

Journal of Internet Marketing and Advertising. Vol. 2,
pp. 109-125.
Werro, N., 2008. Fuzzy Classification of Online Custom-
ers, Dissertation, University of Fribourg. http://ethesis.
unifr.ch/theses/downloads.php?file=WerroN.pdf
(accessed 31
st
of January 2010).
Zadeh, L. A., 1965. Fuzzy Sets. In: Information and Con-
trol. Vol. 8, pp. 338-353.
Zadeh, L. A., 1996. Fuzzy Logic = Computing with num-
bers, In: IEEE Transaction on Fuzzy Systems, Vol. 4,
Is. 2, pp. 103-111.
Zadeh, L. A., 1999. From Computing with Numbers to
Computing with Words – From Manipulation of Mea-
surements to Manipulation of Perceptions. In: IEEE
Transactions on Circuits and Systems, Vol. 45, No. 1,
pp.105-119.
Zadeh, L. A., 2004. A note on web intelligence, world
knowledge and fuzzy logic, In: Data & Knowledge
Engineering, Vol. 50, pp. 291-304.
Zimmermann, H.-J., 1992. Fuzzy Set Theory and its Appli-
cations, Kluwer. London.
Zumstein, D., Kaufmann, M., 2009. A Fuzzy Web Analyt-
ics Model for Web Mining, In: Proc. of IADIS Europ.
Conf. on Data Mining. June 18-20, Algarve, Portugal.
WEBIST 2010 - 6th International Conference on Web Information Systems and Technologies
290
