
MODELING USER PROGRESS AND VISUALIZING FEEDBACK
The Case of ProPer
Ioannis Kazanidis and Maya Satratzemi
Department of Applied Informatics, University of Macedonia, 54006, Thessaloniki, Greece
Keywords: User Feedback, Progress Visualization, AEHS, Motivation.
Abstract: In traditional classroom education instructors can detect the learning difficulties of their students and take
all the necessary actions in order for the problem to be overcome. In asynchronous online education,
however, it is system functionality that plays a vital role in locating potential problems that may be related
to either or both the students and the courses. In addition, students expect the online course to provide them
with personalized instruction and useful feedback. This paper presents how ProPer, an adaptive SCORM
compliant Learning Management System, monitors and visualizes user progress through instruction in order
to help teachers and students alike to locate possible weaknesses. Moreover, ProPer, through immediate
feedback and comparative techniques aims to motivate students to continue with their study. Evaluation
findings indicate that ProPer can help both instructors and students with their work through out the learning
process.
1 INTRODUCTION
Adaptive Educational Hypermedia Systems
(AEHSs) aim to individualize the learning process to
meet students’ characteristics, preferences and goals.
These systems through the Adaptive Navigation and
Adaptive Presentation techniques provide
personalized courses over the Internet so as to help
distant learners improve their learning outcome.
A new research stream in adaptive systems is
attempting to integrate several tools from Learning
Managements Systems (LMSs) in order to provide
as many teacher and learner support features as
possible as well as enable teachers to easily
administrate their courses and classes. The goals of
this stream is on the one hand to provide the teacher
with tools that will help them to easily develop and
manage online courses and virtual classrooms, while
on the other support students with discussion
forums, quizzes etc., as well as providing
adaptivitity. The development of these systems,
however, is not based on any common framework,
as there are no fixed rules, techniques or methods
acceptable to all. Consequently, although developers
spend a lot of valuable time, money and effort on
their applications, they pay nowhere near enough
attention to instructional strategies. Moreover, due to
the absence of a common framework, the courses
along with the educational content produced are
deficient in reusability, interoperability and
durability. More specifically, it is difficult to apply
the educational content from one course to another;
or to distribute a course from one AEHS to another,
since most times they are not compatible. A
proposed solution to this problem is the adoption of
recently accepted educational standards like
SCORM (Sharable Content Object Reference
Model) in order to provide RAID (Reusable,
Accessible, Interoperable, Durable) courses.
In previous works(Kazanidis and Satratzemi,
2009a;2008) we combined the basic functions of an
LMS with the adaptive features of AEHSs and the
adoption of the SCORM standard and its
specifications. Furthermore, for better learning
outcomes, we promoted the concept that it is
possible to adapt native SCORM compliant courses
to user learning style (Kazanidis and Satratzemi,
2009b).
Even if the above functionality enables
instructors to easily create and manage online
courses, and support students by providing
personalized instruction, another problem arises due
to the nature of asynchronous online education.
Namely, web courses can be used either as an
independent integrated solution for distance learning
or as supplementary material for conventional
46
Kazanidis I. and Satratzemi M. (2010).
MODELING USER PROGRESS AND VISUALIZING FEEDBACK - The Case of ProPer.
In Proceedings of the 2nd International Conference on Computer Supported Education, pages 46-53
Copyright
c
SciTePress

classroom education. Therefore, while teachers in
traditional classroom education can detect problems
and possible student weaknesses, those studying
through distant online education can depend only on
the system’s ability to detect these weaknesses and
to reform user instruction accordingly, whereas in
the case of supplementary instruction it would be
better for teachers to monitor user progress and
attitudes so as to spot possible learning difficulties.
Regrettably, LMSs do not adapt their instruction
according to user needs and even worse they do not
provide enough information to the teacher to enable
them to spot student weaknesses. On the other hand,
AEHSs are attempting to adapt their instruction in
numerous ways (providing further explanations,
more examples – activities, proposing concepts for
study etc.) however; they too do not provide
sufficient information to either teacher or user in
order to ascertain user weaknesses and progress.
We believe that distant education systems have
to observe user interaction with the system and draw
conclusions about both user and course status
providing instant feedback not only to teachers but
also to learners. Feedback about course status will
motivate students to continue with their study and at
the same time inform them about any possible
weaknesses they may have, while instructors will be
able to monitor user progress and identify potential
problems as well as detect possible course
shortcomings.
This paper presents how ProPer (Kazanidis and
Satratzemi, 2009a;2008) an adaptive SCORM
compliant LMS visualizes user progress through
instruction in order to help both teachers and
students locate possible weaknesses. In addition, by
providing immediate feedback and comparative
techniques, ProPer aims to motivate students to
continue with their study.
2 RELATED WORK
In order for AEHSs to be able to be adapted to users,
they have to be aware of the user’s initial and
current knowledge of the domain, as well as his/her
individual characteristics. This information is stored
in the User Model (UM) of adaptive systems. All
this data about the user can be divided into two main
categories (Kavcic, 2000). One category contains the
information about user knowledge of the domain and
the other all the information that is independent of
the domain such, as the user’s individual
characteristics, preferences, learning style etc. This
data can be either static, when gathered at the
initialization of the user model and does not change
during the educational process (user individual
characteristics, preferences, capabilities etc.) or
dynamic, when it is collected throughout the
learning process (user progress, current knowledge,
actions, study time etc.) (Kavcic, 2000; Carmona
and Cionejo, 2004). As a rule, students’ personal
characteristics are static data while their knowledge
is dynamic.
It is clear from the above that the UM can track a
lot of useful information about user progress and
attitudes. The challenge at this stage lies on three
axes a) to provide appropriate adaptivity for
personalized instruction; b) to provide instant
feedback; and c) to allow teachers to monitor user
progress and attitudes.
As this work deals with visualization of user
progress, a short presentation of the visualization
techniques used in adaptive systems will be made.
Most of the AEHSs only give emphasis to the first
of the three axes mentioned above. The visualization
of user progress, most times comes with adaptive
link annotation in the course structure view. More
specifically, in order to present whether a concept is
considered as known or not AES-CS (Triantafillou
et al., 2003) applies a checkmark after the link of
each course concept. A checkmark is also used in
Interbook (Brusilovsky et al., 1998) where no
annotation signifies that the concept is “unknown”, a
small, medium or big checkmark means “known”,
“learned”, “well learned” respectively. Likewise,
INSPIRE (Papanikolaou et al., 2003), applies a
checkmark to indicate whether a concept is
considered as known. In addition, in order to
visualize user progress according to course
outcomes, INSPIRE uses a glass to show user
knowledge. The amount of user knowledge is related
to how full the glass is. Similarly, ELM-ART
(Weber and Specht, 1997) employs an extension of
the traffic light metaphor to annotate links visually.
A yellow sphere before the link indicates that the
corresponding concept is considered as being known
or having been visited and in the case of it being a
test or a problem that it has been solved correctly.
Anes (Kavcik, 1999) is yet another system which
annotates concept links using specific colors for
each state.
Most of these adaptive systems, however, do not
provide comprehensive feedback to the user -or
instructor- about their current course status,
encompassing coverage of course concepts, user
goals, study time, number of visits for each concept
etc.What is more, the teacher is not able to identify
neither student nor course weaknesses so as to take
MODELING USER PROGRESS AND VISUALIZING FEEDBACK - The Case of ProPer
47

appropriate action. Even the majority of LMSs, such
as Moodle, Claroline etc. do not provide a statistics
module, which enables the instructor to obtain
specific information about the performance of each
student (Romero et al., 2007).
Other researches (Ortigosa and Carro, 2002) aim
to support teachers in detecting the need to modify a
course when it does not fully meet every student’s
requirements. More specifically, an agent has been
developed that, among others, identifies users with
the best/worst results and the practical tasks where a
significant number of users have obtained non-
satisfactory results. It also detects points where a
considerable number of users revisit previous
sections and makes conclusions about the need for
improving the content. CourseVis (Mazza and
Dimitrova, 2004) is a visualization tool that tracks
web log data from a Content Management System.
By transforming this data, it generates graphical
representations that keep instructors well-informed
about what precisely is happening in distance
learning classes. More specifically, it employs
information visualization techniques to produce
graphical representations of learners’ social,
cognitive and behavioral aspects allowing instructors
to identify certain tendencies that may exist in their
classes, or to quickly identify individuals that need
special attention. Furthermore, other tools, such as
Logic-ITA (Merceron and Yacef, 2003) attempt to
extend web-based tutoring systems that make
instructors aware of their class progress as well as
any problems that may be encountered.
These systems, however useful they may be for
teachers, do not appear to benefit students in any
way since most times their results are not available
to learners. A system that opens the student model to
the user is KERMIT (Hartley and Mitrovic, 2002),
which among others shows a hierarchical
representation of student’s progress with the ability
to expand some of the subcategories of the course.
As far as we are aware, none of the above
systems accounts for learners’ progress in
accordance with the student’s educational goals
since either they provide information at the concept
level or measure user progress over the whole course
as an integrated domain. Therefore, in the case
where a learner wants to study only a part of the
domain, the results may be inaccurate. We promote
the development of tools that can determine a
learner’s progress both to his/her educational goals
as well as to the whole course. In the following
sections, we present how ProPer assists both
students and teachers by tracking the appropriate
data and sending them feedback about student and
course status.
3 FEEDBACK VISUALIZATION
IN ProPer
ProPer is an integrated adaptive and adaptable
learning environment that offers LMS administration
facilities and conforms to SCORM specifications. It
comprises a combination of an AEHS and a LMS,
while providing a variety of additional educational
features on the one hand for the learner (Instant
feedback, dynamic F.A.Q., Draft notes, Java Online
Editor-Compiler etc.) and on the other for the
teacher (course-user statistics, course management
etc.). It therefore takes advantage of the strengths of
both system categories. The system can be adapted
to the learner’s progress, previous knowledge, goals,
navigation through the course, as well as his/her
learning style. Even if ProPer uses most of the
adaptation techniques as identified by Brusilovsky
(2001) we wanted to not only support students with
their study by providing personalized instruction but
also to try to motivate them for a better learning
outcome. Research (Hartley and Mitrovic, 2002) has
shown that feedback about user progress can
motivate students to achieve better outcome results.
Thus, we decided to provide students with the
appropriate feedback about their progress on the
course. In addition, many research streams like those
referred to in related works, aim to inform
instructors on class progress and any potential
problems that particular students or even specific
parts of the course may be experiencing. This will
help authors to support weaker students and to revise
their courses so as to rectify any problems. For these
reasons ProPer provides instructors with detailed
statistics both for user and course status.
3.1 Design Guidelines
Some basic guidelines where followed in order to
visualize feedback about user and course status:
1. Simple and Easy to use Feedback. Many non-
technical instructors encounter problems
administering their courses and even worst,
students without a technical background may
have a cognitive overload problem in the case of
either a complicated interface or system
functionality. Thus, ProPer was designed for use
by non-technical instructors and students,
providing simple and easy to understand
feedback.
CSEDU 2010 - 2nd International Conference on Computer Supported Education
48
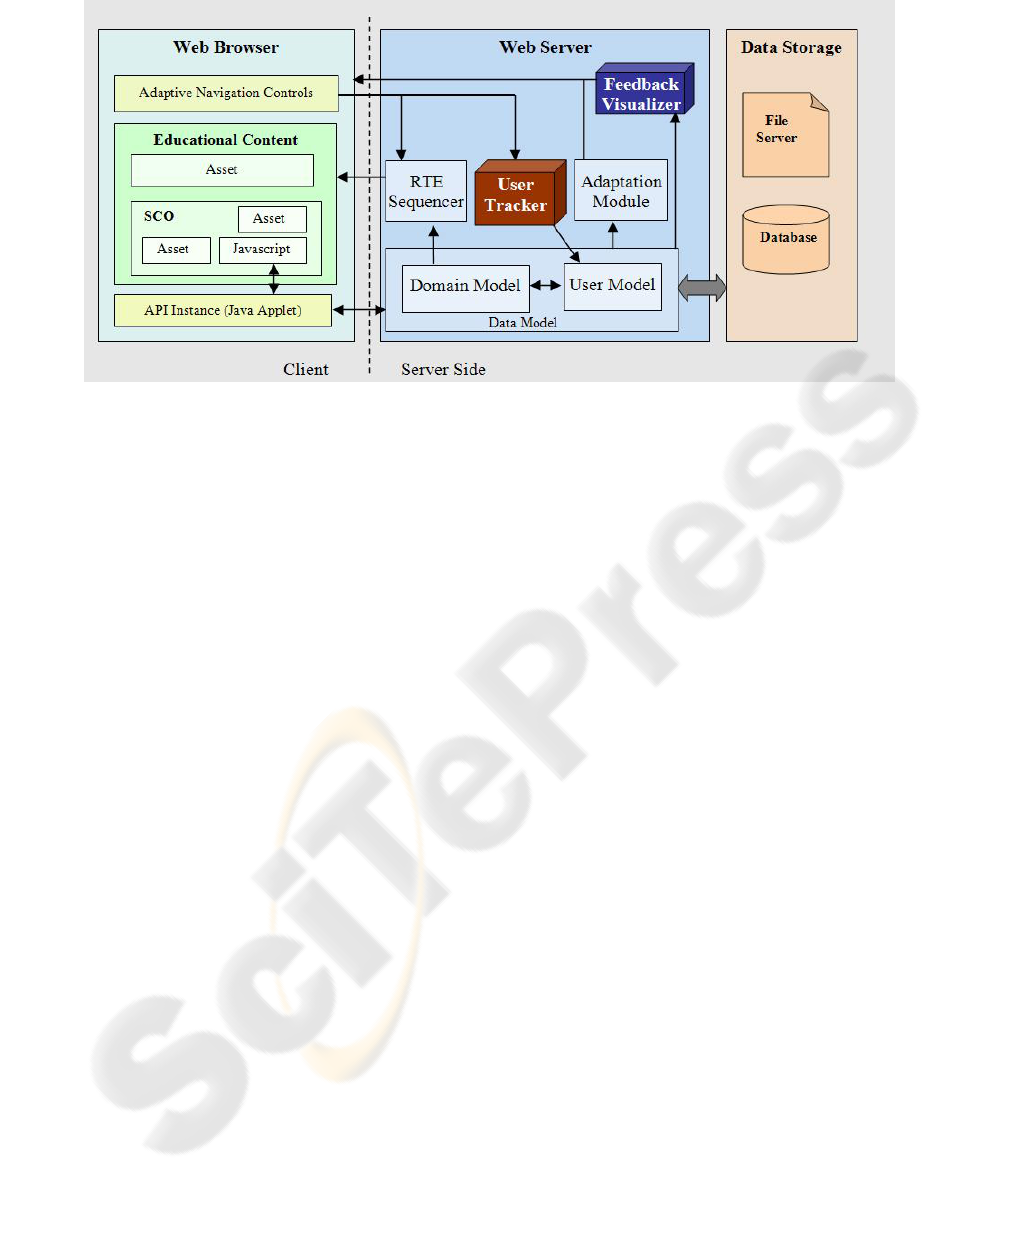
Figure 1: System Architecture.
2. Available Feedback to the Learners. Since
feedback can motivate learners with their study,
it is made available to them throughout the
learning process.
3. Real-time Feedback of Learner’s Progress
and Detailed Feedback through Specific
Tools. Simple feedback about user progress is
available in real-time while an option for more
detailed feedback will enable students to check
their current course progress in more depth.
4. Detailed Feedback about Course and
Learners’ Status to Instructors. The system
provides instructors with detailed statistics for
every course, who also have the option of
checking the entire class progress of the course
as well as each individual user’s progress and
attitudes.
5. Allows Learners to send their own Feedback
to Instructors. In addition to any likely
problems that the course might have, learners
may encounter some difficulties with specific
course concepts. In both cases, the system
provides the necessary mechanism to enable
learners to easily send feedback to their
instructors about every single course concept.
3.2 System Architecture
The system has a combined architecture of SCORM
LMS and AEHS. As shown in simplified form in
Fig. 1, we adopt the typical SCORM Run Time
Environment (RTE) structure adding an Adaptation
Module (AM) and extending the pre-existent
Domain and User Models. Therefore, the system
consists of: i) the Domain Model (DM) that
represents the system’s domain knowledge; ii) the
User Model (UM) that represents the particular
user’s knowledge of the domain as well as his/her
individual characteristics (both these models
comprise the system’s Data Model (DtM)), iii) the
AM which interacts with the DtM and the UM in
order to provide adaptive navigation to the course;
and iv) the RTE Sequencer that is triggered by
course navigating controls, interacts with the DM
and delivers the appropriate educational content to
the learner.
To be able, however, to provide feedback to
users and instructors, ProPer needed two additional
mechanisms. Firstly it had to be able to track user
progress and interaction with the system and
secondly, it had to implement the necessary tools to
calculate the appropriate feedback and visualize it in
an easy, useful and understandable way. Therefore,
two new modules were integrated, the User Tracker
(UT) and the Feedback Visualizer (FV) (Fig.1).
The UT monitors learner’s interaction with the
system and stores all the essential data into the UM.
When feedback has to be delivered, the FV initially
calculates the information that has to be sent, then it
visualizes results and delivers them to the user.
3.3 Modeling Cognitive Aspects
An initial survey with instructors revealed that they
were concerned as to how they could supervise a
virtual classroom through an LMS and how
students’ learning difficulties can be recognized in
order for the appropriate actions to be taken. They
also drew attention to the importance of a tool that
gives them feedback on their already developed
MODELING USER PROGRESS AND VISUALIZING FEEDBACK - The Case of ProPer
49

courses facilitating improvement.
Based on the above, we thus, decided to track the
following user data:
A score for every course concept. This is the
score that a user gets on completion of their
study of a specific course concept, which shows
the level of knowledge acquired for each
concept;
The number of visits to a concept. The user may
only need to study a course concept once or may
need to go back and study it again in order to
reinforce learning. This number will help both
learners and instructors to pinpoint possible
difficulties and problems in specific parts of the
course;
Study time. The time that a student spends on a
course indicates how easy or difficult it is for
them to learn the course domain.
Based on the above data some additional useful
results can be calculated, such as:
Course score – user progress. This score can
show the level of knowledge acquired on the
domain of the course. It actually shows user
progress through the learning process.
Coverage of educational goals. Often on web
courses users have different needs and therefore
different educational goals, for this reason,
ProPer allows learners to define which parts of
the course they wish or not. For those learners
who want to study particular parts of a course, it
is more relevant that the feedback provided is
related to their own educational goals rather than
to the whole course. Thus, coverage of
educational goals is the percentage of the
learner’s educational goals learned so far.
Position in the class. This number will show the
student their class position in comparison with
their fellow students on the course. We have
strong reason to believe according to our survey
(Lawrence et al., 2004; Regueraset al., 2008) that
this helps to motivate students to study harder
with a view to improving their score position, i.e.
it stimulates healthy competition among learners.
A special mechanism was incorporated to
calculate the user’s score on both the course and
goals covered. ProPer courses are compliant with
SCORM and thus have a tree structure consisting of
leaf as well as parent activities. Leaf activities can
be either Sharable Content Objects (SCOs) or
Assets. SCOs are the smallest logical entities in a
course that can communicate with the system and
generally they denote a course concept, while assets
are elementary pieces of knowledge, such as text,
images, video etc. A parent activity is one that
contains other parent or leaf activities that are
referred to as its children. Lastly, it should be
explained that each activity has a weight on their
parent’s score.
In order, therefore, to ascertain user progress,
initially the score of every concept is retrieved as
well as its weight on its parent’s score. In this way,
the system calculates every parent’s score, until it
reaches the primary parent of all the course’s
activities. The score of the primary parent is the one
that the user has in regards to the whole course.
More specifically, let us assume that LA is a leaf
activity, PA a parent activity which contains one or
more child activities. CA is a child activity where
CA {PA, LA} and n is the number of CAs
included in a PA. Every activity has a score [-1, 1]
and a weight [0, 1]. These values are retrieved
from the system’s data server and only the PA scores
have to be calculated according to their CA weights
and scores. Now, let us assume that CA
i
is the i child
of a PA. Also PAscore is the score of a PA;
CAscore
i
, CAweight
i
are respectively the score and
the weight of CA
i
. Therefore, the following formula
is used to find the score of a PA:
n
i
i
n
i
ii
CAweight
CAweightCAscore
PAscore
1
1
(1)
A more complicated procedure is, however,
followed for the calculation of goals covered. Let us
assume that goalscore and goalweight are the goal
score and goal weight of an activity. Therefore,
LAgoalscore and LAgoalweight are the score and
weight of an LA according to user educational goals,
while LAscore and LAweight are the score and
weight of an LA in regards to the whole course.
Similarly, PAgoalweight and CAgoalweight
i
are the
goal weights of a PA and a CA
i
. In addition,
PAweight and CAweight
i
are the weights of a PA and
the CA
i
of the PA as defined by the course author. In
order to find the user score in accordance with the
student’s educational goals we need to first find the
goal weight of each activity. Thus, the following
rules apply:
IF LA is a goal THEN LAgoalweight =
LAweight ELSE LAgoalweight = 0
(2)
IF PA is a goal THEN
CSEDU 2010 - 2nd International Conference on Computer Supported Education
50
(b)
(c)
(a)
Figure 2: Screenshots of student feedback.
n
i
i
n
i
i
CAweight
htCAgoalweigPAweight
htPAgoalweig
1
1
ELSE PAgoalweight = 0
(3)
Following the calculation of the goalweight for
each activity, the goalscore of each parent activity
must also be found until the primary parent of the
course is reached. Let us further assume that
PAgoalscore and CAgoalscore
i
are the goal scores of
the PA and the CA
i
respectively. In order to
determine the goalscore of a PA the following
formula is used:
n
i
i
n
i
ii
htCAgoalweig
htCAgoalweigeCAgoalscor
ePAgoalscor
1
1
(4)
3.4 Visualizing Cognitive Aspects
Feedback in ProPer is offered in two ways: i) that
which is provided to the students and whose
principal aim is to motivate them with their
studying; and ii) that which is provided to the
instructors and whose chief aim is to enable the
detection of learning difficulties that their students
may have or develop, and to detect potential
problems the course may contain.
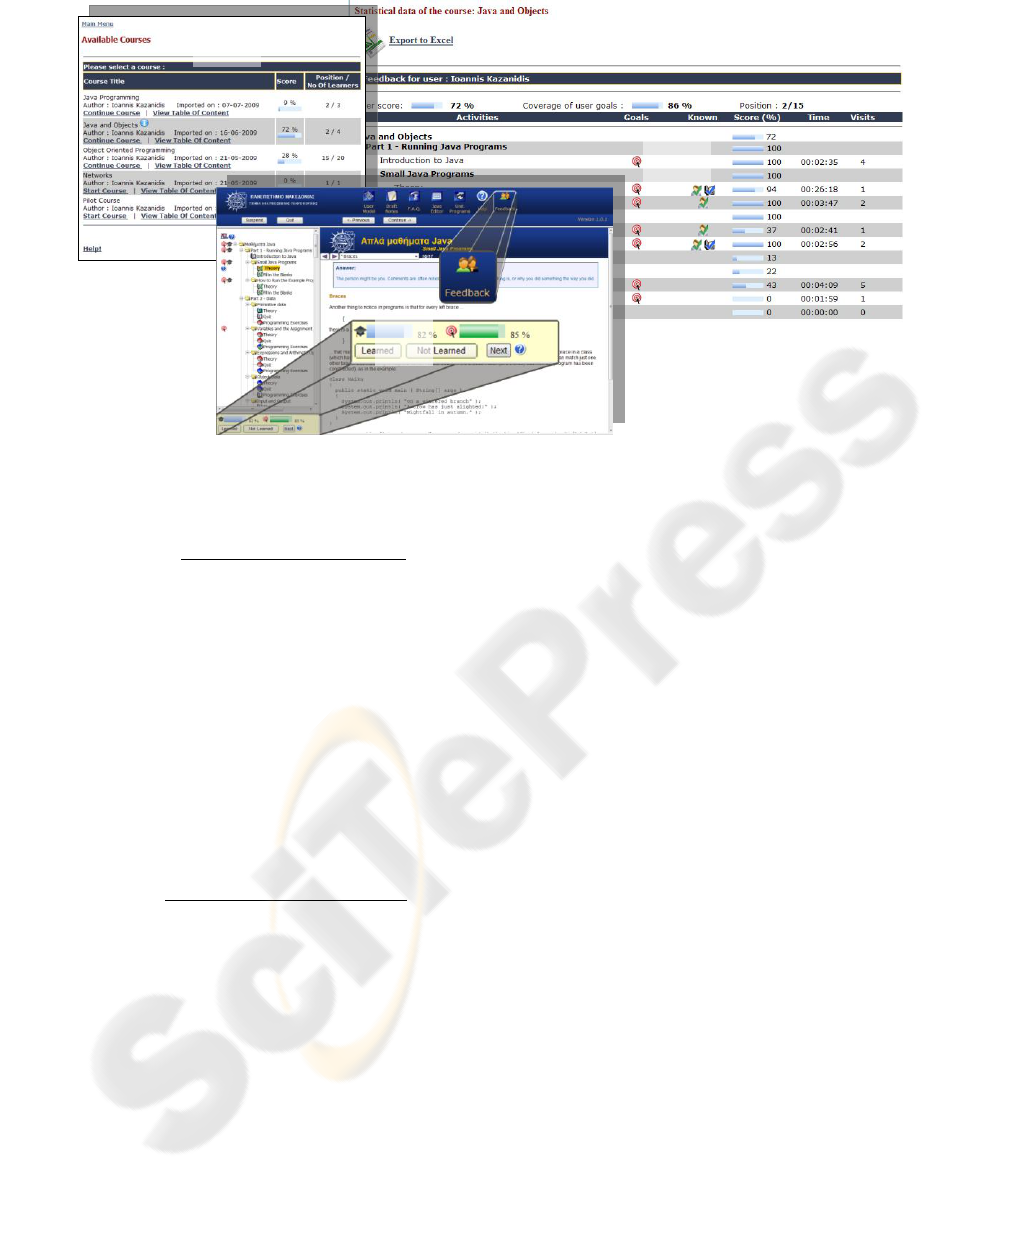
3.4.1 Student Feedback
It was decided that learners would receive feedback
in three different ways. The first is at the selection of
a course where they can view both their score and
their position in the class in comparison to the other
students on the course (Fig. 2a). The second is
throughout the duration of the course. Learners have
access to their scores on the basis of the whole
course as well as their individual educational goals.
These scores are demonstrated as a percentage as
well as a colored bar (Fig. 2b). In addition, when a
user places the mouse over a course activity –
concept in the table of contents, then the score of
this activity is given. Moreover, all learners can at
anytime select the feedback button on the top right
of the screen (Fig. 2b) and send instant feedback to
their instructor related to the specific concept that
he/she is studying. In this way, the instructor can be
acquainted with learners’ opinions about the course.
The third way for the students to obtain feedback is
with a screen that presents detailed statistics about
the course (Fig. 2c). On this screen they can see their
course score, the goals covered, their position in
comparison to the other users, as well as the score,
time spent, and number of visits for every activity.
Furthermore, goal activities are marked with a red
target icon, while pre-known activities and those
known through study are annotated with a man and
an open book respectively with a checkmark on top.
This screen enables learners to view their exact
status in a course and to further define their actions.
MODELING USER PROGRESS AND VISUALIZING FEEDBACK - The Case of ProPer
51
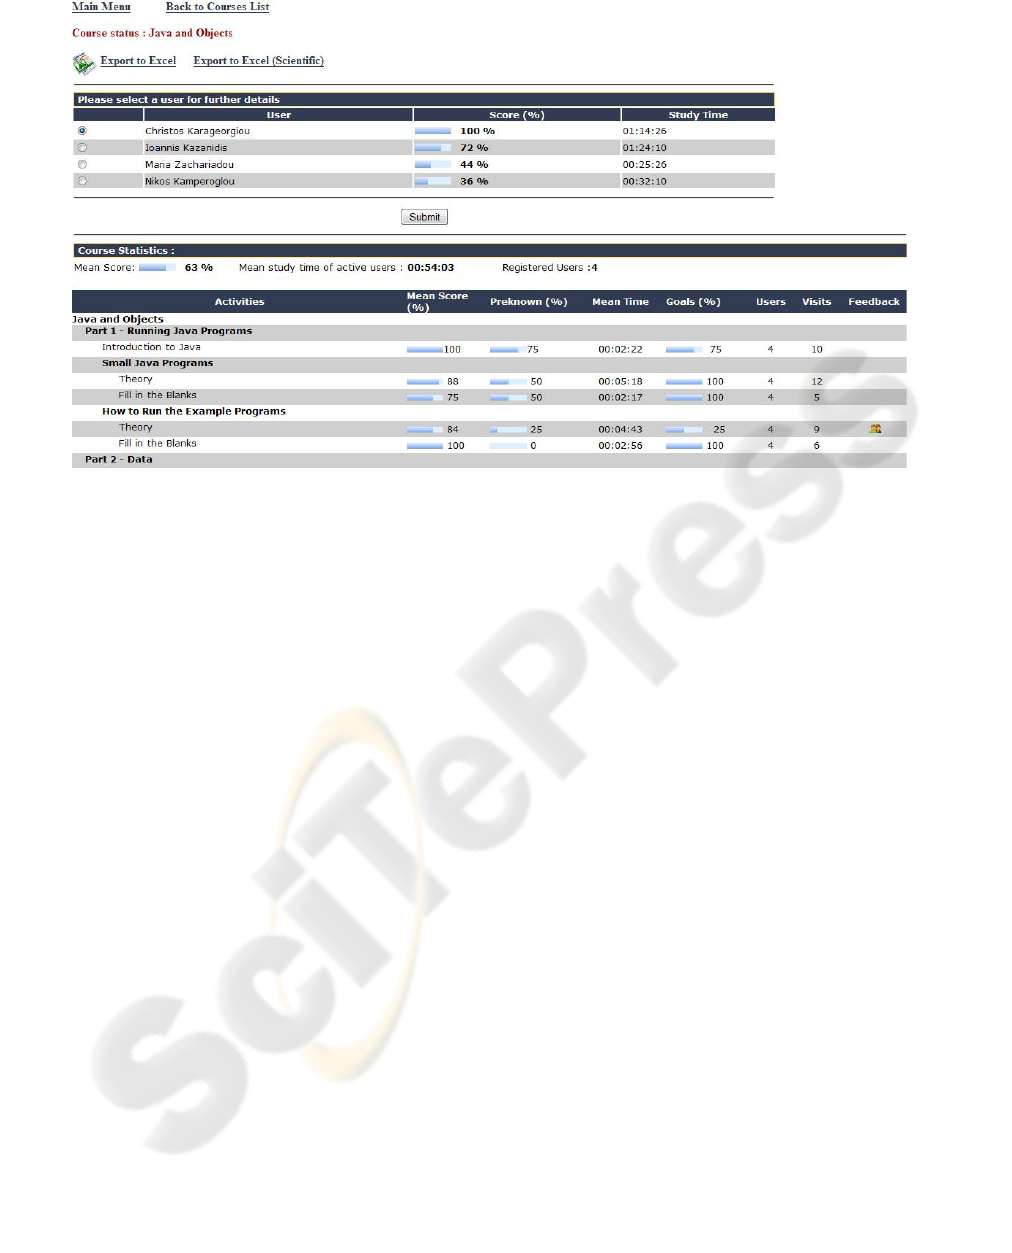
Figure 3: Screenshot of instructors’ feedback for course status.
3.4.2 Instructor Feedback
The system also sends feedback to instructors not
only on every course but also on the status of every
student. More specifically, if an instructor chooses to
see feedback on a specific student, he/she initially
sees a screen similar to Fig. 2a displaying the
course’s name that the student has registered for,
followed by the student’s score and position. Then,
the instructor may select one of the courses and see
further details as presented in Fig. 2c. On this screen
they can figure out the real user status about the
course. In the case where an instructor wants to see
feedback on one of their courses, then a two-part
information screen is displayed (Fig. 3). The first
shows the users registered for that course as well as
their scores and their study times, allowing the
instructor to select one user to view further details.
The second part shows the mean score and mean
study time that users spent studying the course as
well as the number of registered users. Next, the
system provides the following details for every leaf
activity of the course: i) mean score, ii) the
percentage of students that knew the corresponding
concept before their study, iii) mean study time, iv)
the percentage of the students who consider this
activity as one of their goals, v) the number of
students that studied the activity, vi) the total
number of visits, and vii) whether student feedback
is available. If feedback is available instructors may
select the related icon and read it. It is worth
mentioning that these results can be exported to an
excel file for further statistical analysis. In this way
instructors can decide on the courses’ usefulness or
about the possible problems that learners may come
up against.
4 CONCLUSIONS
In this paper we have presented how ProPer, a
SCORM compliant LMS with adaptive features
provides and visualizes feedback both to learners
and instructors. Despite the fact that many systems
do not open the user model to learners, ProPer does
just this and in so doing provides them with detailed
feedback about their progress on the learning
process. In addition, most of the SCORM compliant
or AEHSs do not provide detailed feedback at either
the course or concept levels. Perhaps worse is the
fact that the feedback they do send is related to the
course rather than the individual’s educational goals.
In contrast, ProPer calculates and delivers feedback
according to both the course domain and to specific
learner goals. This feedback can be provided at
either the course or concept level. Furthermore, even
if some LMSs provide some kind of feedback to
instructors, they in no way incorporate such detailed
feedback as ProPer does.
We believe that the kind of feedback presented
above will, on the one hand greatly benefit learners
CSEDU 2010 - 2nd International Conference on Computer Supported Education
52

by motivating them with their study and making
them aware of their weaknesses, and on the other,
ProPer’s functionality will facilitate instructors to
supervise a virtual class and inspect their courses for
potential problems and/or omissions.
A formative evaluation of ProPer (Kazanidis and
Satratzemi, 2009a) has shown that instructors had a
high perception of the system’s usefulness. They
stated that they found the screens displaying
feedback on user and course statistics as one of the
most valuable system features. One of their
suggestions, incorporated into the revised system,
was for functionality to be added to enable every
user to send direct feedback to their instructor on
course activities. The student’s evaluation of the
system’s functionality gave mixed views, namely
that while some liked the feature very much that
shows the user’s score and position on the course in
comparison to the rest of the class, there were those
who felt this could be counter-effective in regards to
motivation. We believe that this reflects the
individual’s learning style, some people like and
thrive on competition, while others do not. We are
therefore considering offering users the option of
choosing their learning style when they sign up in
the system and later allowing the system to
dynamically decide on the appropriate functionality
for each user.
In concluding it can be said that the same
framework as that applied for ProPer can be
implemented by every SCORM compliant LMS and
many AEHSs, so as to improve learners’ motivation
and simultaneously increase the usefulness for
instructors.
REFERENCES
Brusilovsky, P., et al, 1998. Web-based education for all:
A tool for developing adaptive courseware. In
Computer Networks and ISDN Systems. Proceedings
of 7th International World Wide Web Conference, Vol.
30, pp. 291–300.
Brusilovsky, P., 2001. Adaptive hypermedia. User
Modeling and User Adapted Interaction, Ten Year
Anniversary Issue, Alfred Kobsa, (Ed.), Vol.11, No.
1/2, pp. 87-110.
Carmona, C., and Cionejo, R., 2004. A Learner Model in a
Distributed Environment. In De Bra P. and Nejdl W.
(eds) Third International Conference on Adaptive
Hypermedia and Adaptive Web-Based Systems
(AH'2004), LNCS Vol. 3137, Springer Verlag, Berlin,
pp. 353-359.
Hartley, D. and Mitrovic, A., 2002. Supporting Learning
by Opening the Student Model. In Cerri, S.
Gouardères and Paraguaçu (eds.), Proceedings of
International Conference on ITS 2002. pp. 453-462.
Kavcic, A., 1999. Adaptation Techniques in Adaptive
Hypermedia Systems. Proceedings of the 22nd
International Convention MIPRO’99, Conference on
Multimedia and Hypermedia Systems, Hrvaska, 1999.
Kavcic, A., 2000. The Role of User Models in Adaptive
Hypermedia Systems. Proceedings of the 10th
Mediterranean Electrotechnical Conference MEleCon
2000. Lemesos, Cyprus.
Kazanidis, I., and Satratzemi, M. 2009b. Applying
learning styles to SCORM compliant courses.
Proceedings of ICALT09, Riga, Latvia.
Kazanidis, I., and Satratzemi, M., 2009a. Adaptivity in
ProPer: an adaptive SCORM compliant LMS. Journal
of Distance Education Technologies. Vol.7 No. 2, pp.
44-62.
Kazanidis, I., and Satratzemi, M., 2008. Adaptivity in a
SCORM compliant Adaptive Educational Hypermedia
System. In ICWL 2007 Leung, H., Li, F., Lau, R., Li,
Q. (eds.). LNCS Vol. 4823, pp. 196-206.
Lawrence, R., 2004. Teaching Data Structures Using
Competitive Games, IEEE Transactions on Education,
Vol. 7, No. 4, pp. 459-466.
Merceron, A., and Yacef, K., 2003. A Web-Based
Tutoring Tool with Mining Facilities to Improve
Learning and Teaching. Proceedings of the
International Conference in Artificial Intelligence in
Education. Sydney, pp. 201-208
Ortigosa, A., and Carro, R. M., 2002. Agent-based
Support for Continuous Evaluation of E-Courses.
Proceedings of the 6th World Multiconference on
Systemics, Cybernetics and Informatics. Orlando,
Florida, Vol. 2, pp. 477-480.
Papanikolaou, K. A., et al, 2003. Personalizing the
Interaction in a Web-based Educational Hypermedia
System: the case of INSPIRE. User Modeling and
User-Adapted Interaction. Vol. 13, No 3. pp. 213-267.
Romero, C. et al, 2007. Data mining in course
management systems: Moodle case study and tutorial.
Computers & Education, Vol. 49, pp. 1-17.
Regueras, L., Verdú, E., Verdú, M., Pérez, M., Castro, J.,
and Muñoz, M., 2008. Motivating Students through
On-line Competition: an Analysis of Satisfaction and
Learning Styles. LNCS, Vol. 5145, pp. 167-177.
Triantafillou, E., et al, 2003. The design and the formative
evaluation of an adaptive educational system based on
cognitive styles. Computers and Education Vol. 41,
pp. 87–103.
Weber, G., and Specht, M., 1997. User modeling and
adaptive navigation support in WWW-based tutoring
systems. Proceedings of 6th International Conference
on User Modeling, pp. 289-300.
MODELING USER PROGRESS AND VISUALIZING FEEDBACK - The Case of ProPer
53
