
THE INTERNET AS A TOOL FOR IMPROVING THE STUDENT
EVALUATION OF TEACHING
F. J. Martín-Carrasco, L. Mediero and J. A. Sánchez
Department of Civil Engineering: Hydraulic and Energetic. Technical University of Madrid
ETSI Caminos, Canales y Puertos. Ciudad Universitaria. 28040, Madrid, Spain
Keywords: Teacher Evaluation, Web-based Tool, Divulgation of Evaluation Results.
Abstract: This paper describes a methodology to assess the quality of teaching using a web based tool, which has been
developed and implemented in the School of Civil Engineers of the Technical University of Madrid (UPM).
The software has been developed using a combination of tools freely available and widely used. Students
use the Internet to fill out and send the questionnaires. Each questionnaire has three items: subjects, teachers
and general comments. The system guarantees the student answers anonymity. It also assures each student
can only evaluate those courses and teachers for which they are enrolled and can only evaluate them once.
The evaluation results have been divulgated by a process where teachers and students right to know the
results and personal data protection right have been joined. The methodology was implemented four years
ago. By now there is enough evidence to verify that results have been very successful.
1 INTRODUCTION
Quality assessment of the activity is a mandatory
requirement in a public organization (Reid, 2001).
Due to this demand, public universities periodically
evaluate the quality of their activities, mainly
teaching (Martin-Carrasco and Fraile, 2008; Ghedin
and Aquario, 2008). One of the traditional
components of this assessment is the student opinion
about teaching (Kitsuse, 2009; Kember et al., 2002).
Nowadays, the best procedure to know this opinion
is to ask the students by a survey (Sproule, 2000).
The most common teaching quality survey is the
paper-and-pencil questionnaire, consisting in the
distribution of a sheet with the questionnaire in the
classroom, which each student must complete
(Wang et al., 2005; Dommeyer et al., 2004). Then,
after data processing, each subject and teacher
results are sent to interested parties.
This paper describes a new methodology for
conducting surveys on the quality of teaching, which
has been developed in the School of Civil Engineers
of the UPM, and first implemented in the 2005-06
academic year. It is an integral process, which
considers, reviews and improves each step of the
traditional assessment process, from the
questionnaire to the results divulgation. While one
of the features of the methodology is its web based
process to complete the questionnaires (Anderson et
al., 2005), there are other innovative steps,
highlighting the legal and technical analysis which
has been developed to determine how to divulgate
the results. The methodolgy has been validated,
showing its practical viability and effeciency.
The main purpose of the system is the quality
assessment of the teaching activity and the learning
quality of subjects (Algozzine et al., 2004; Ratz,
1975). In addition, the methodology allows students
to express their points of view and suggestions on
other aspects of the school, such as facilities, library,
dining room, administrative staff and any other
operative service. Even the system itself has been
subject to assessment, so that students can discuss
their experience as users to improve the system in
next years (Nulty, 2008). References to a similar
procedure for the assessment of the teaching quality
implemented in any other Spanish University were
not found.
The paper has been organized as follows. Firstly,
the methodology for developing the telematic
system, conducting the surveys and disseminating
the results is presented. Secondly, the new system
for conducting surveys is compared to traditional
methods. Finally, future improvements and
conclusions are presented.
412
Mediero L., J. Martín-Carrasco F. and Sánchez A. (2010).
THE INTERNET AS A TOOL FOR IMPROVING THE STUDENT EVALUATION OF TEACHING .
In Proceedings of the 2nd International Conference on Computer Supported Education, pages 412-419
DOI: 10.5220/0002780904120419
Copyright
c
SciTePress

2 METHODOLOGY
DESCRIPTION
The methodology has been divided in two sections.
Firstly, the design and implementation of a telematic
system for conducting surveys on the teaching
quality is presented. Then, the presentation of results
and their divulgation to all the teachers and students,
in a personal way depending on the degree of
representativeness that each of them holds, is
presented.
2.1 Telematic System
The first step is the design and implementation of a
new telematic system, which allows students to
conduct surveys on the teaching quality by the
Internet. The system has been installed on an
Apache server which works on Linux. Web
developments have been achieved in PHP 4.0
language and MySql has been used as a database
engine. These tools, all freely available, are widely
used in web developments.
Students data (subjects for which they are
enrolled) and teachers data (subjects for which they
teach) have been provided by the Administrative
Office and Departments of the School.
Students access and authentication into the
system is carried out through the virtual area of the
School, where each student already has its own
access password, avoiding an additional complexity
to the process. Once the student is authenticated, the
login is kept throughout the connection. Each page
checks that this access has been made through the
previous athentication. The page and questionnaire
format keeps the previous style used in the virtual
area of the School, so that students will not realize
the difference between the two applications. The use
of a cascading style sheets application makes it
easily adaptable to other environments.
Pages have a maximum width of 600 points, so
that these can be printed on an A4 sheet size, as
students must print their survey to save their
answers. After survey submission, students will not
be able to access their answers again, since each
answer is stored without any reference to the person
who has submited it, for the safety of the anonymity.
Available data to be introduced in each field are
restricted to allowable data from that field database.
This restriction has been carried out by JavaScript
scripts to avoid a high server load while a client run,
also resulting in a faster response in case of error.
For the safety of the survey results, daily backups
are carried out and a second MySQL is being
performed for making a database backup.
Once the evaluation period is expired, which
lasts the month of May, results data are recovered by
Sql scripts and imported in an Excel sheet, which is
specially designed for its final presentation.
2.2 Methodology for Conducting the
Surveys
As said before, students can access the system by the
only requisite of being registered as users in the
virtual area of the School (all students are registered
from the date of the beginning of their studies in the
School). Once logged in, the list of subjects in which
the student is enrolled is showed (Fig. 1). One of
them must be selected to proceed to the
corresponding survey about the subject itself or the
teachers of it.
In the case of conducting the survey of the
subject itself, a list of questions is shown (Fig. 2).
The student must answer ticking one of the boxes for
each question. The student has an available field to
freely express his comments and suggestions about
the subject, with a maximum length of 500
characters.
If the survey about the teachers is selected, a list
of the teachers who lecture that subject is shown.
The student must select those who wish to evaulate
and a list of questions is shown (Fig. 3). The student
must tick one box between 1 and 10 for each
question. The student has also an available field to
freely express his comments about the teacher.
Once the survey of a subject or a teacher is
finished, the student can not modify or conduct
again it (it disappears from the list of subjects that is
shown). After that or with a later login, he can
conduct the remaining surveys for other subjects and
teachers.
Furthermore, in the initial page, where the
student selects the subject that wishes to evaluate,
four fields have been displayed, in which he can
express his opinions about the pre-freshman course
(4 weeks intensive course), the final-year project, the
School as a whole and the telematic assessment
process itself.
2.3 Results Presentation
A set of tables and figures has been developed for
the presentation of the results, which summarize the
huge amount of information generated by surveys.
THE INTERNET AS A TOOL FOR IMPROVING THE STUDENT EVALUATION OF TEACHING
413
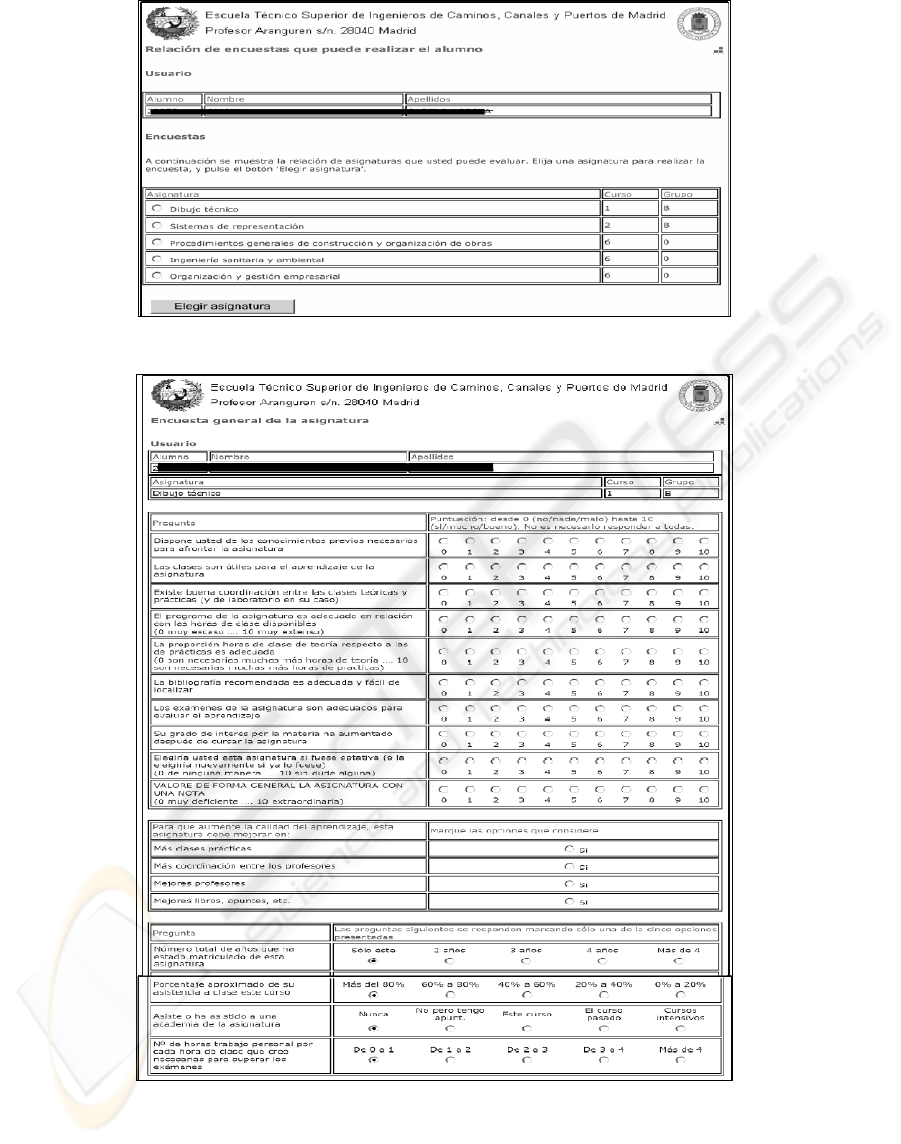
Figure 1: Form to access the assessment questionnaires.
Figure 2: Subject evaluation questionnaire.
These tables and figures are simple enough to make
quick comparisons between results, but have an
enough detail to analyze each individual case.
The design of these tables and figures has been very
labour-intensive. Nine tables have been developed:
Tables 1 and 2: Evaluation of the subjects, sorted by
course and by assessment results (Fig. 4).
Tables 3 and 4: Evaluation of the teachers, sorted by
subject and by assessment results (Fig. 5).
CSEDU 2010 - 2nd International Conference on Computer Supported Education
414

Table 5: Graphics of the results distribution of the
teachers evaluation (Fig. 6).
Table 6: Comments on subjects.
Table 7: Comments on teachers.
Table 8: Comments on the final-year project and the
pre-freshman course.
Table 9: Comments on the School and on the survey
itself.
2.4 Dissemination of Results
Transparency and publicity of the survey results
improve the quality of teaching. If the results are
hidden, the surveys will not be effective. For this
reason, the survey results have been divulgated as
widely as the UPM regulations and Spanish Data
Protection Law allows. The current legislation has
been studied in detail and legal advisors have been
consulted on the most doubtful aspects.
Each teacher has the right to receive his personal
evaluation. At first, no one else should receive it,
because teaching evaluation is considered as
personal data, and therefore this information is
restricted to the cases collected by the Law. But, as
an exception, the members of the School governing
body, i.e. the School Board and the Department
Board, have the right to know the evaluations of all
the other teachers within the scope of the body, in
order to have the most complete information about
each case. Because of this, to join the maximum
dissemination and the data protection, different
documents have been developed, each of them
targeting a specific area and staff. One of the
documents (Divulgative Document) is available to
anyone who requests it, mostly students, and it is
sent in pdf format.
2.5 Additional Developments
In addition to the two main parts of the developed
system methodology (the telematic system for
conducting surveys and the presentation and
divulgation of results), other additional works have
also been developed.
The survey forms have been designed taking into
account that are going to be filled out on the
Internet. The forms have three distinct parts, i. e.
subjects, teachers and general comments, which are
activated by pressing the corresponding buttons. The
answers are bounded, so that students can only tick
one of the offered answers.
Questionnaire questions have been defined after
a comparative analysis of many questionnaires from
other schools and universities.
Efforts were made to select questions that really
incide on the quality of teaching, including contrast
questions to evaluate the quality of results. Finally,
10 questions have been set for subject assessment
and 10 for teacher assessment. The questions are
simple, short, with clear language and, relevant for
the person evaluated and for the university.
Authors have carried out several divulgative
conferences on the new methodology to the students,
in order to present the new method and to know their
opinions. Some of these opinions and comments
advised to include some changes to the initially
planned procedure.
The system has also promoted the use of the
virtual area. This is a resource that the School offers
to teachers and students. It has a huge potential
because, as a web based tool, it enables the
communication between teacher and student without
constraints of time or place. However, this is a
seldom used resource, which has been known by
many students through this new system to conduct
surveys.
3 COMPARISON WITH
TRADITIONAL METHODS
Surveys to assess the quality of teaching have been
conducted in our school for many years. The
traditional system was to distribute in the classroom,
in a single day near the end of the course, a few
pages with questionnaires that students should fill
out. Once the surveys were completed and after the
slow and costly processing of results, these were
given to each teacher and to the Director of the
Department.
After the implementation of the presented
system, the surveys, with updated forms and aimed
at improving the quality of teaching, enable a more
complete, accurate and faster assessment. The
survey results, as being available in digital format,
can be processed more efficiently. Moreover, the
results are summarized and presented by some
specially designed tables, which allow the
comparison of results. Speed and accuracy in data
processing has been tested, as the documents
described above had been developed one month after
the completion of the surveys.
Previously, traditional methods of survey led to a
very labour-intensive data processing, which needed
to handle by hand thousands of questionnaires, with
very high costs and calculation errors, so that the
THE INTERNET AS A TOOL FOR IMPROVING THE STUDENT EVALUATION OF TEACHING
415
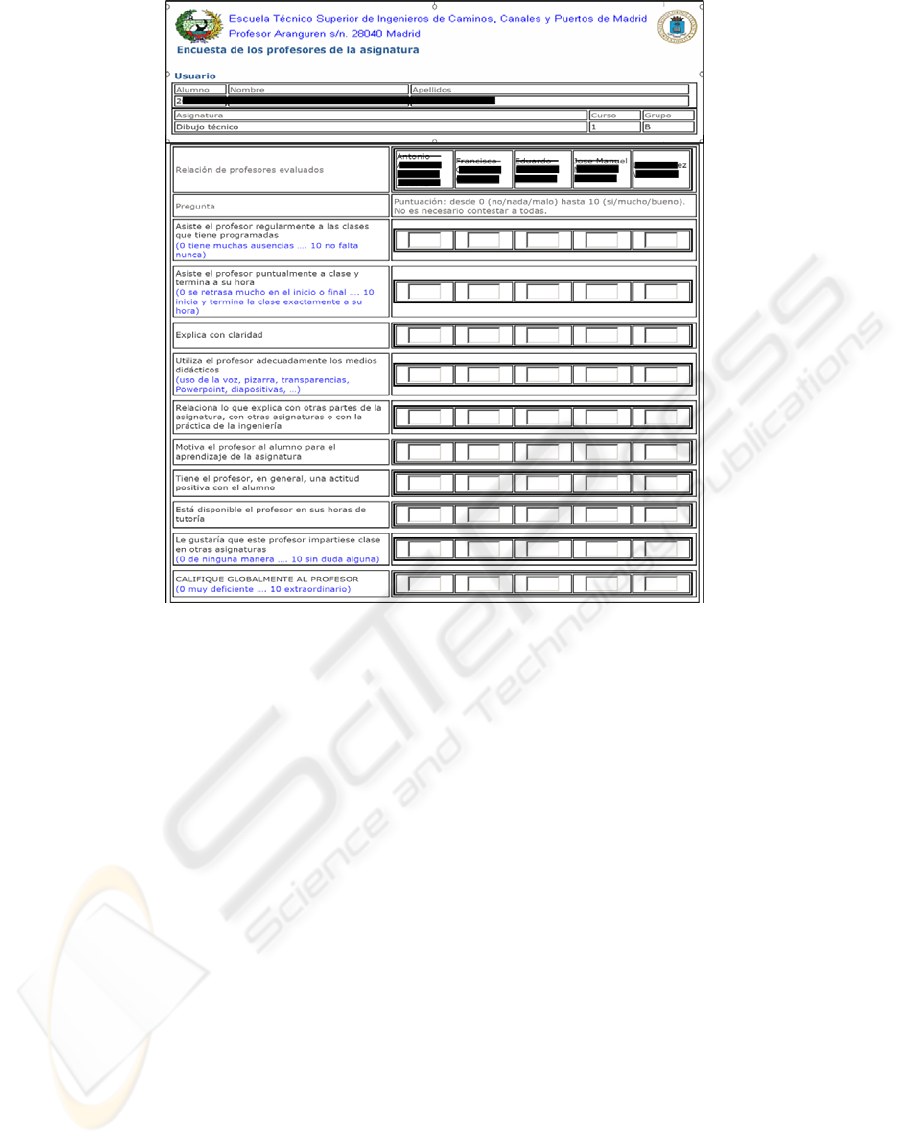
Figure 3: Teacher evaluation questionnaire.
results were never available before six months after
the completion of the surveys. The rapid availability
of results allowed by this new methodology, added
to the use of e-mail to speed up its distribution and
to reduce costs, allow teachers to draw their own
conclusions, being these put into practice from the
beginning of next academic year.
Widespread dissemination of results, observing
the law restrictions, breaks with traditional
obscurantism of the survey results and turns them
into an effective tool to improve the quality of
teaching. Each teacher can compare his results with
that from other teachers in their subject, Department
or School. The students, which have access to the
results of teaching evaluation for the first time,
something that had never happened before with
traditional methods, feel to contribute to the system,
find that their opinions are properly transmitted and
are more motivated to participate in next courses.
The participation of students is not easy to
quantify by comparing the number of surveys that
have been completed by the new system with those
by traditional systems, due to the difficult data
handle and location from those previous years.
However, Table 1 shows the increasing number of
teachers and subjects assessed in recent courses
compared to previous courses.
It can be seen that the last years have tripled the
number of completed surveys and more teachers
have been assessed, from those of the first year of
implementation. These results show an increasing
trend in the use of this system for conducting the
surveys, which confirms that it is being successfully
implemented.
In addition, the evaluation of the system by the
students has been very succesful, as they have stated
in the reserved field for this purpose in the
questionnaire (Table 9 of the results).
4 FUTURE IMPROVEMENTS
As the system has been implemented for the last two
courses, some elements have been identified as
improvable: reducing of the questionnaire length,
changing the date for conducting the surveys,
promoting
the use of he virtual area, etc.
Other possible improvements have been suggested
by teachers and students.
CSEDU 2010 - 2nd International Conference on Computer Supported Education
416
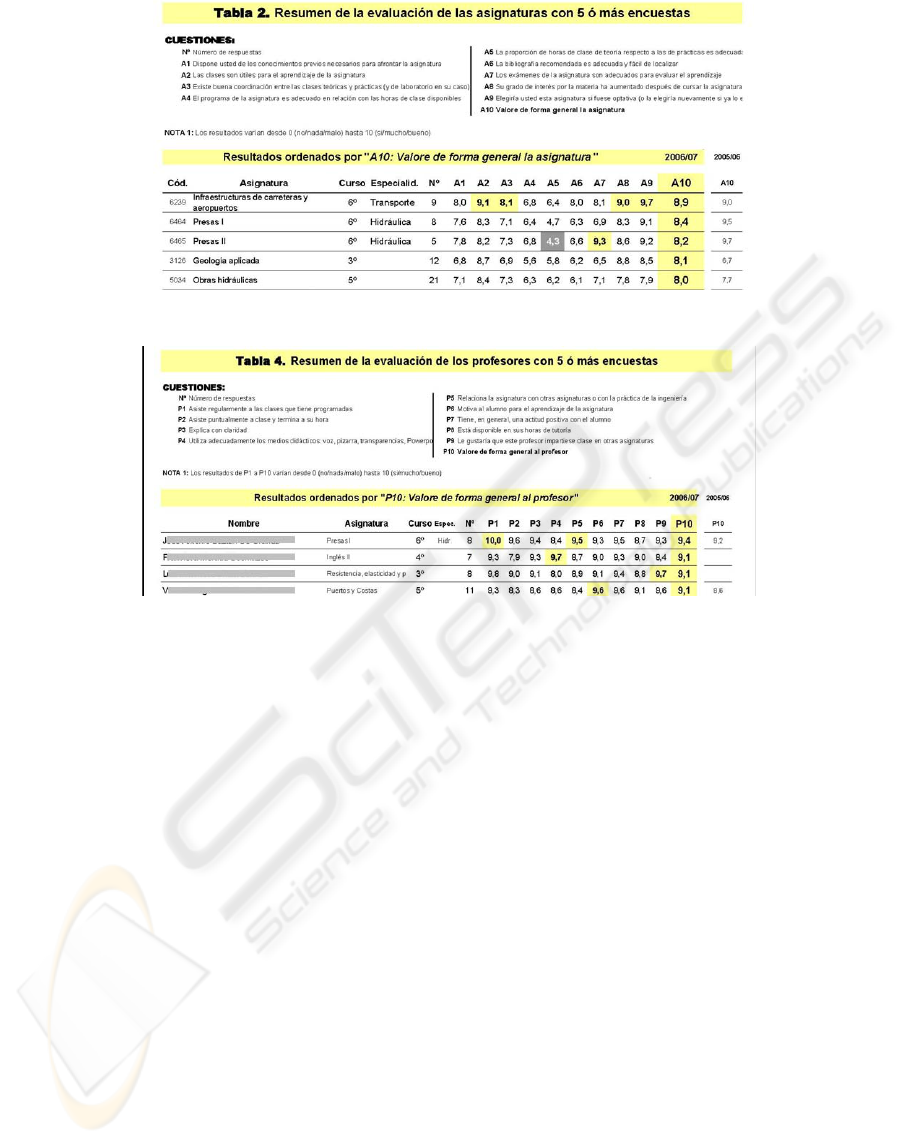
Figure 4: Subjects evaluation summary (part of Table 2).
Figure 5: Teachers evaluation summary (part of Table 4).
The most important aspect to be improved is the
student participation, which has not increased as it
was expected. The two main causes indicated by the
students are: concern about the anonymity of
answers, because they must identify themselves to
access the system, and the traditional lack of
confidence in the teaching evaluation surveys, which
are considered as a useless activity that until now
has been for nothing (Beran et al., 2009; Giesey et
al., 2004). Concern about the anonymity of answers
is mainly due to the system novelty (Oliver and
Sautter, 2005). Previously, all the surveys were
conducted on paper, answering on a page where the
student was not identified. However, the new
telematic system requires the student to identify
himself as a user of the system, which has aroused
some suspicion, although it was warned that the
answers were added to the database without any
reference to the person who completed it. However,
after the students verificate the real anonymity of
answers, an increasing participation is expected for
the next course.
The traditional lack of confidence in the surveys to
improve the quality of teaching is a widespread
opinion among the students. It is mainly due to the
obscure divulgation procedure that had been used
previously. Only the teacher himself knew the
results of their surveys and also sometimes the
Director of the Department. This lack of
transparency affected the students, who were blinded
to the results of the evaluation that they had
completed. It is expected that the new dissemination
system, which allows the students to know the
survey results, will lead to the students feeling of
contribution to the system and becoming more
involved in next years.
5 CONCLUSIONS
This paper has presented a methodology to assess
the quality of teaching. It has been developed and
implemented in the School of Civil Engineers of the
UPM. All the stages of the process are novel,
highlighting the presentation and divulgation of
results.
The implemented telematic system uses freely
available software tools, commonly used in web
developments.
THE INTERNET AS A TOOL FOR IMPROVING THE STUDENT EVALUATION OF TEACHING
417
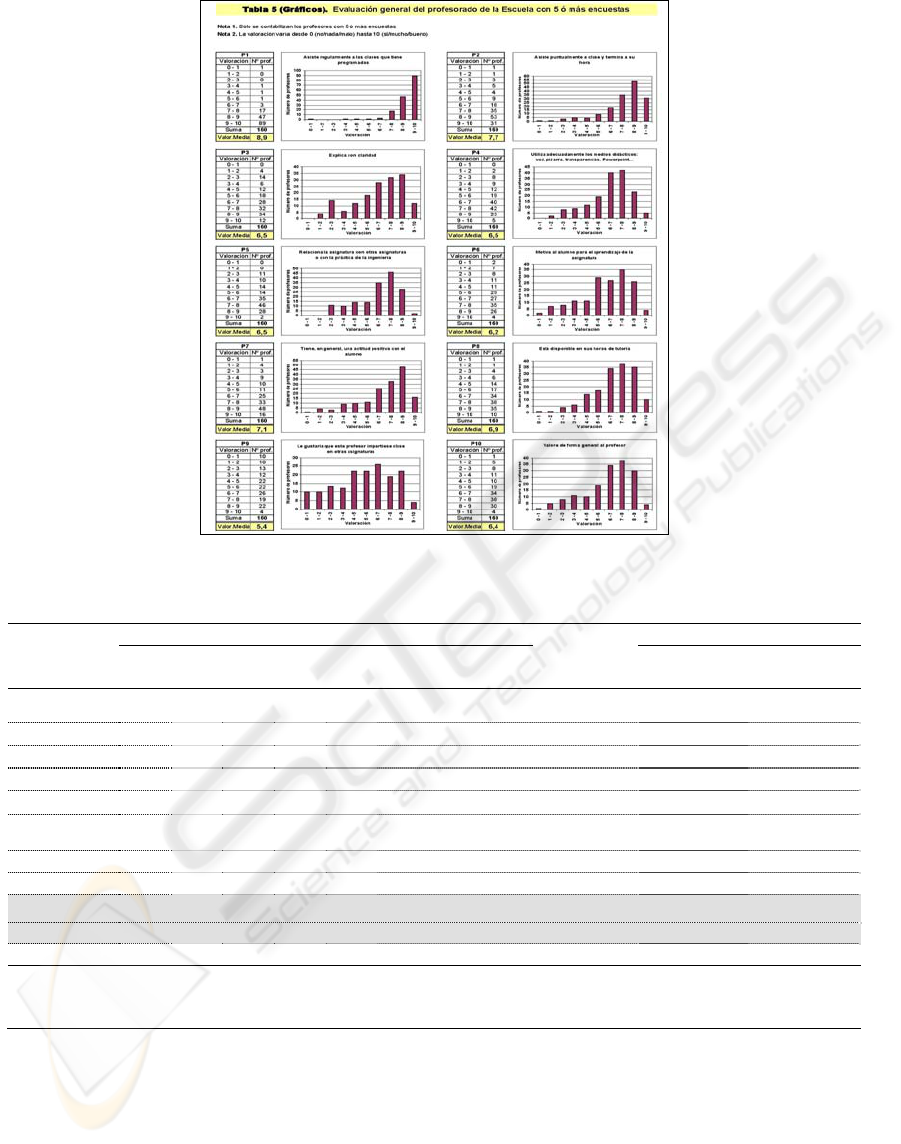
Figure 6: Results distribution of teachers evaluation (Table 5).
Table 1: Comparison between web based and traditional surveys.
Academic
year
Evaluated teachers per course
Evaluated
subjects
Number of surveys
Bridge
course
1
st
2
nd
3
rd
4
th
5
th
6
th
Total
Teachers Subjects
Internet based system
2008-09 34 29 40 37 62 69 271 64 3.126 1.237
2007-08 32 32 35 36 67 71 273 68 3.449 1.352
2006-07 1 41 24 36 31 60 63 256 68 2.263 1.022
2005-06 6 28 30 28 30 51 62 235 68 908 535
Traditional system
2004-05 0 7 13 36 38 29 59 182 48
2003-04 0 10 26 22 26 56 58 198 59
2002-03 No data
2001-02 No data
2000-01 0 9 15 0 16 28 38 106 35
N
ote: The number of students in the School was 1800, as the average over the last five years, but those who regularly
attended the classes were around 950. The number of students who filled out the surveys is about the fifty percent of
the latter.
To simplify the students login and authentication, it
makes good use of an already established system,
which is the virtual area of the School. Once logged
in, students gradually access to a number of forms
that allow them to complete the surveys of subjects,
teachers and comments, activating the corresponding
commands.
To make the presentation of the results easier, 9
tables and graphs have been carried out, which
summarize the huge amount of information
generated by the surveys and facilitate its
consultation. The dissemination of the results is
believed to be essential for the proper operation of
any teaching assessment system. This divulgation
has been based on joining the teachers and students
right to know the evaluation results and the right to
CSEDU 2010 - 2nd International Conference on Computer Supported Education
418

personal data protection collected by the current law.
To satisfy both rights, initially opposed, a personal
divulgation has been made, which reflects the
situation of each receiver, and different documents
have been developed to achieve this rule, each of
them targeting a specific group. It must be
emphasized that one of these documents, called
Divulgative Document, is only available in pdf
format and is distributed by the Internet, reducing
costs.
The system was introduced five years ago with
very successful results, which are much better than
those of previous traditional procedures.
REFERENCES
Algozzine, B., Beatti, J., Bray, M. et alteri, 2004. Student
evaluation of college teaching: A practice in search of
principles. College Teaching. Vol. 52, nº 4, pp.
134-141.
Anderson, H.M., Cain, J., Bird, E., 2005. Online student
course evaluations: Review of literature and a pilot
study. American Journal of Pharmaceutical Education.
Vol. 69, nº 1. pp. 34-43
Beran, T., Violato, C., Kline, D., Frideres, J., 2009. What
do students consider useful about student ratings?
Assessment & Evaluation in Higher Education, Vol.
34, nº 5, pp. 519-527.
Dommeyer, C.J., Baun, P., Hanna, R.W., Chapman, K.S.,
2004. Gathering faculty teaching evaluations by in-
class and online surveys: their effects on response
rates and evaluations. Assessment and Evaluation in
Higher Education, Vol. 29, nº 5, pp. 611-623
Ghedin, E. and Aquario, D., 2008. Moving towards
multidimensional evaluation of teaching in higher
education: A case study across four faculties. Higher
Education, Vol. 56, nº 5, pp. 583-597.
Giesey, J.J., Chen, Y.N. and Hoshower L.B., 2004.
Motivation of engineering students to participate in
teaching evaluations. Journal of Engineering
Education, Vol. 93, nº 4, pp. 303-312.
Kember, D., Lueng D.Y.P. and Kwan K.P., 2002. Does
the use of student feedback questionnaires improve the
overall quality of teaching? Asessment and Evaluation
in Higher Education. Vol. 27, nº 5, pp. 411-425.
Kitsuse, J.I., 2009. Talk about teaching: reflections on the
problem of teaching evaluation. The American
Sociologist. Vol. 40, nº 1-2, pp. 3-14.
Martin-Carrasco, F.J., Fraile, J., 2008. La evaluación de la
docencia: ventajas e inconvenientes del procedimiento
DOCENTIA propuesto por la ANECA. II Jornadas
Internacionales UPM sobre Innovación Educativa y
Convergencia Europea.
Nulty, D.D., 2008. The adequacy of response rates to
online and paper surveys: what can be done?
Assessment & Evaluation in Higher Education, Vol.
33, nº 3, pp. 301-314.
Oliver, R.L., Sautter, E.P., 2005. Using course
management systems to enhance the value of student
evaluations of teaching. The Journal of Education for
Business, Vol. 80, nº 4, pp. 231-234.
Ratz, H.C., 1975. Factors in the evaluation of instructors
by students. IEEE Transaction on Education, Vol. 18,
nº 3, pp. 122-127.
Reid, I.C., 2001. Reflections on using the Internet for the
evaluation of course delivery. The Internet and Higher
Education, Vol. 4, nº 1, pp. 61-75.
Sproule, R., 2000. Student evaluation of teaching: A
methodological critique of evaluation practices.
Education Policy Analysis. Vol. 8, nº 50.
Wang, Y., Lee, C., Lew-Ting, C., Hsiao, C.K., Chen, D.,
Chen, W.J., 2005. Survey of substance use among
high school students in Taipei: Web-based
questionnaire versus paper-and-pencil questionnaire.
Journal of Adolescent Health, Vol. 37, pp. 289-295.
THE INTERNET AS A TOOL FOR IMPROVING THE STUDENT EVALUATION OF TEACHING
419
