
ABSTRACT CONCEPTS TO CONCRETE IMPLEMENTATION
Visualizing the Evolution of Data Structures through Animation
Christopher Smith, Jeffrey Strauss and Peter Maher
Department of Mathematics and Computer Science, Webster University, St. Louis, MO 63119, U.S.A.
Keywords: Algorithms, Animation, Education, Visualization.
Abstract: Data Structures and Algorithms courses are known to be a particularly challenging hurdle to overcome for
computer science students. Specifically, many students struggle with being able to visualize detailed
transformations as data structures evolve under standard operations. Such an understanding is a critical
factor for success in later software engineering courses, and therefore represents a vital platform on which
many more advanced principles are built. This paper describes a data structure visualization tool designed to
graphically demonstrate the manipulation of well-known data structures via standard operations. The tool is
designed to enable instructors to enhance the effectiveness of their lectures, and for students wishing to
solidify their understanding of key concepts via a user-friendly, animated environment. We detail the
primary features of the software, discuss the key benefits, and describe potential future enhancements.
1 INTRODUCTION
One of the largest obstacles for many students in a
computer science program is that of fully
understanding the design and implementation of
common algorithms and data structures. Such
fundamental concepts are introduced at the
beginning of the program and provide a vital
foundation for memory management and common
programming principles taught in later software
engineering courses (Aho, Ullman and Hopcroft,
1983). Developing a sound understanding of how
such data structures evolve under standard
operations, as well as the internal mechanics of
common computer algorithms, is both challenging
and enormously important.
Traditionally, when a student is learning the
concepts of algorithms and data structures, he or she
traces lines of code and manually draws a diagram
of what is expected to happen. Although such a
process has enormous value, the lack of feedback
means that the student is unable to definitively
determine whether their understanding is accurate.
Moreover, when an instructor introduces these topics
in lectures, hand-drawn diagrams can quickly
become difficult to comprehend.
The Data Structure Visualizer (DSV) described
in this paper is designed to support the needs of both
students and instructors. Common data structures
such as dynamic arrays, linked lists, stacks, queues,
priority queues, hash tables, and binary trees, as well
as standard sorting algorithms are implemented and
can be clearly visualized via an animated display
window. Code for standard operations on each data
structure is provided. By stepping through each line
of code, users can observe the evolution of the data
structures being studied.
In the classroom, there are limits to what one can
draw for students on a whiteboard – it is a suitable
tool for displaying code, but performs very poorly as
a medium to illustrate the dynamic behavior of data
structures. Even using standard illustrations for
visual elements, such as nodes in a linked list,
attempting to show any kind of behavior using lines
and arrows or by erasing and redrawing can be
ineffective, or worse, confusing for students. This
tool provides a means to demonstrate the effects of
high-level, standard data structure manipulation
operations, as well as visually showing the effects of
each code statement. The ability to accurately
demonstrate these changes in a clear, repeatable
manner significantly enhances the clarity of
descriptions provided in lectures, as well as being
more engaging to students.
Conversely, from a students‟ perspective, having
the ability to repeatedly step through lines of code
and visually observe how each statement modifies a
data structure is highly educational. They are no
282
Smith C., Strauss J. and Maher P. (2010).
ABSTRACT CONCEPTS TO CONCRETE IMPLEMENTATION - Visualizing the Evolution of Data Structures through Animation.
In Proceedings of the 2nd International Conference on Computer Supported Education, pages 282-287
Copyright
c
SciTePress
longer dependent on seeing such changes only
within the context of a lecture, but are able to
observe the effects of operations in their own time.
Used in conjunction with traditional textual
descriptions, this tool enables students to solidify
their understanding of the concepts in a unique and
highly effective manner.
The DSV has been designed to be highly
expandable and will be augmented with additional
algorithms and data structures in the future.
2 DEVELOPMENT PROCESS
We began the development process by examining
existing visualization tools (Chen and Sobh, 2001)
(Erkan, VanSlyke and Scaffidi, 2007). What we
found was surprising: there are many existing
visualization tools freely available on the Internet
already, but all of them are significantly lacking
either in their flexibility, content, detail or visual
attractiveness. Many were entirely hard-coded and
had no interactivity, while others offered users some
control over a limited set of operations. Even the
few that offered some flexibility often featured
visualizations that were primitive, confusing or
extremely oversimplified.
Existing animation tools, even when well-
developed have one critical flaw: they grossly
oversimplify the potential complexities of operations
in even basic data structures. While they are
effective as an uncomplicated, early and completely
logical look at a data structure, they lack the
sophistication to fully demonstrate the subtleties of
standard data structure transformations. These tools
are useful in offering students a logical
understanding of such structures, but cannot
transition them from that high-level, abstract concept
into their actual, physical implementations in code.
From the beginning of this project, we
understood that building a visualization application
solely based on features which we deemed useful
would likely produce something which was
insufficient for widespread use. By interviewing
both faculty and students, we were able to gain
perspective on the problems they were trying to
solve, and develop specific design requirements for
the application.
The major benefit of using direct interviews over
surveys or other information-gathering techniques
was that it gave us an opportunity to pursue new and
unanticipated ideas that developed during
conversations. In fact, these gave us some of the
most meaningful insights into building this type of
application. The one universal theme expressed by
faculty in every interview was the difficulty students
have in transitioning from the logical “draw it on
paper” understanding of a data structure to its
physical “write it in code” implementation.
It was from this theme that we determined that
ultimately what all existing tools lacked was
precision and detail. By delving deeply into the line-
by-line details of implementing data structures, yet
presenting them in an easy to follow and visually
engaging format, we could match up this logical
understanding with the actual code behind it.
Effectively, we saw that to realize the potential of
this application, we would need to provide a one-to-
one ratio between a line of code and an action on the
screen.
3 FEATURES AND
CAPABILITIES
The graphical interface for the DSV consists of five
major components:
a) Animation Window. In which graphical
representations of data structures evolve as a
result of operations being performed
b) Code Window. Displaying implementation code
for the operation being performed
c) Data Structure Manipulation Interface.
Enabling the desired data structure to be selected
and appropriate operations initiated
d) Control Interface. Providing control over how
the animation proceeds
e) Variable Display Window. Showing key
variables and their current values.
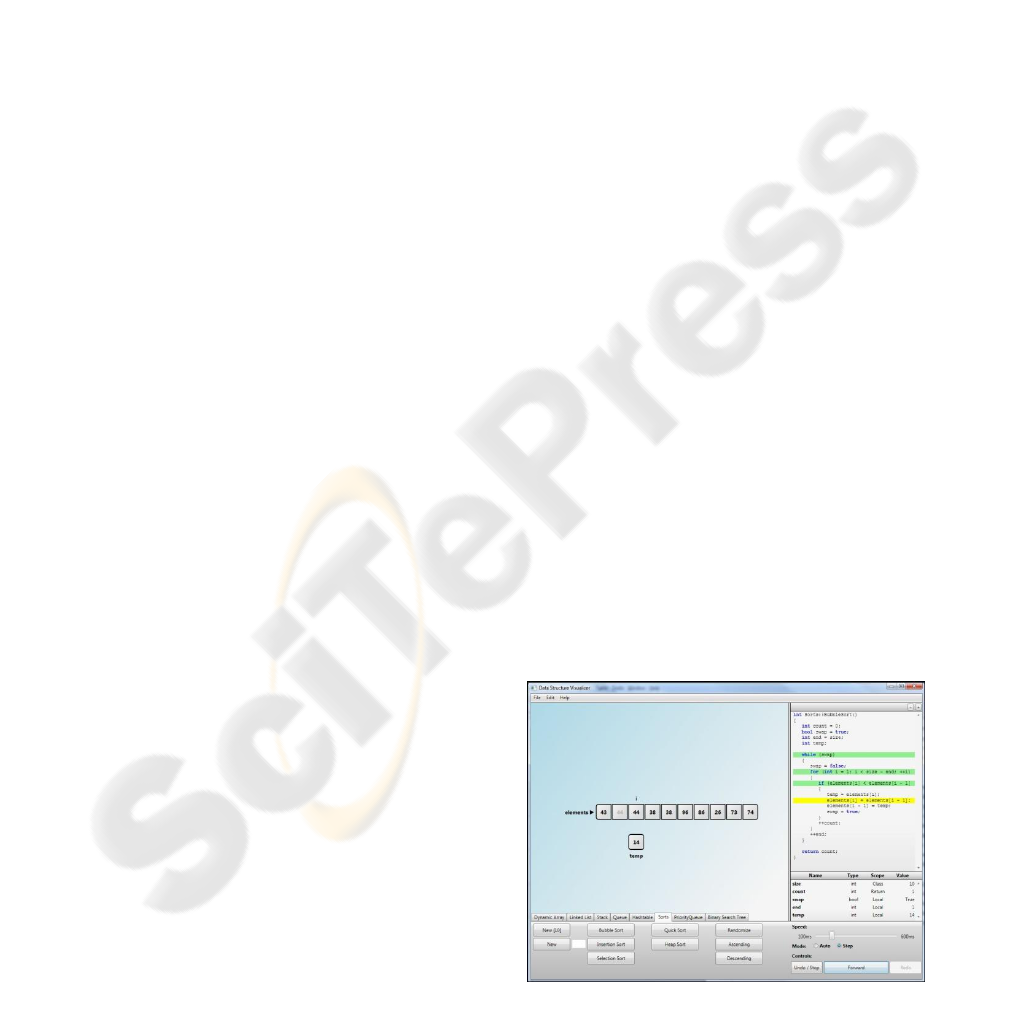
The overall interface is outlined in Figure 1 in
which a standard „bubble sort‟ algorithm is being
demonstrated.
Figure 1: Demonstration of the „bubble sort‟ algorithm.
ABSTRACT CONCEPTS TO CONCRETE IMPLEMENTATION - Visualizing the Evolution of Data Structures through
Animation
283
Each component, and its role within the
application, will be described in more detail via
several examples.
Users begin by choosing the desired data
structure via selecting a tab in the „data structure
manipulation interface‟ component. Within each tab,
buttons are provided to enable users to execute all
standard operations on the chosen data structure.
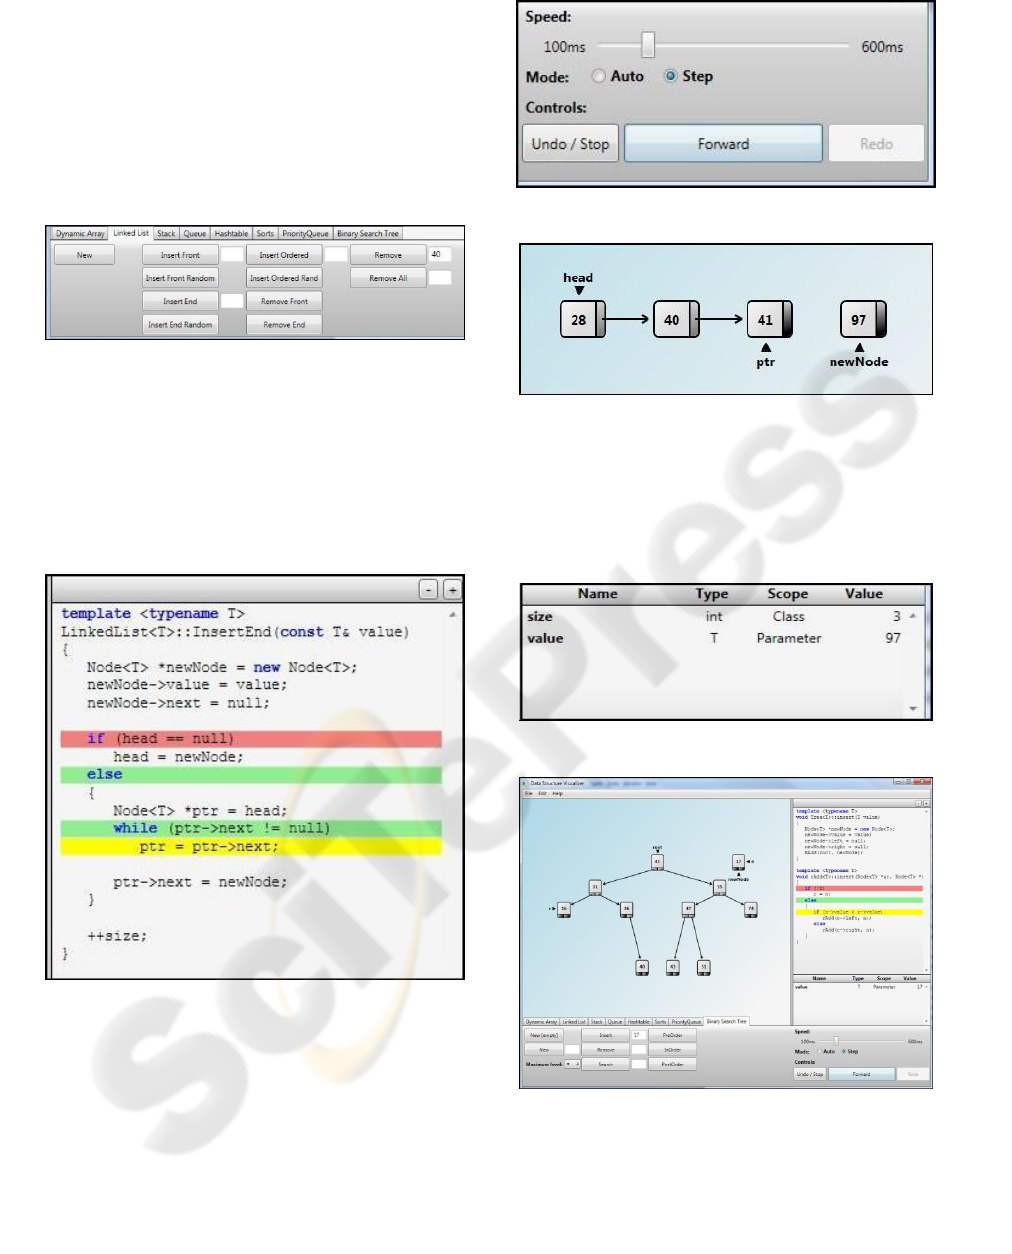
This portion of the interface is shown in Figure 2.
Figure 2: Data structure selection and manipulation.
Once a button is clicked, implementation code
for that operation appears in the „code window‟
component. For example, a user may select the
„Linked List‟ data structure, and choose to
investigate how values can be inserted at the end of
the list. The tool will show the code for the
„InsertEnd‟ function, as shown in Figure 3.
Figure 3: Code display.
Through the „control interface‟ component, users
are given the option of automatically executing the
statements of the function at a designated speed, or
manually stepping through each statement via a
button click, as shown in Figure 4.
In both cases, the DSV will animate the
evolution of the data structure based on each
statement. Figure 5 shows the state of the display
after several insertions.
Figure 4: Animation control.
Figure 5: Demonstration of the „InsertEnd‟ operation.
During this operation the key variables are „size‟,
representing the current size of the linked list, and
the „value‟ being inserted. The „variable display
window‟ component is used to show these variables,
as highlighted in Figure 6.
Figure 6: Variable display.
Figure 7: Demonstration of binary tree insertion.
This type of animation is particularly effective
for data structures such as „Binary Trees‟ due to
their recursive nature – a concept that is very
challenging for many students. Figure 7 shows the
CSEDU 2010 - 2nd International Conference on Computer Supported Education
284
state of the DSV following several insertions into a
binary tree.
In addition to standard manipulations, the three
common binary tree traversal algorithms are also
demonstrated. Users are able to step through the
code for each of these traversals and clearly observe
the order in which nodes of the tree are visited.
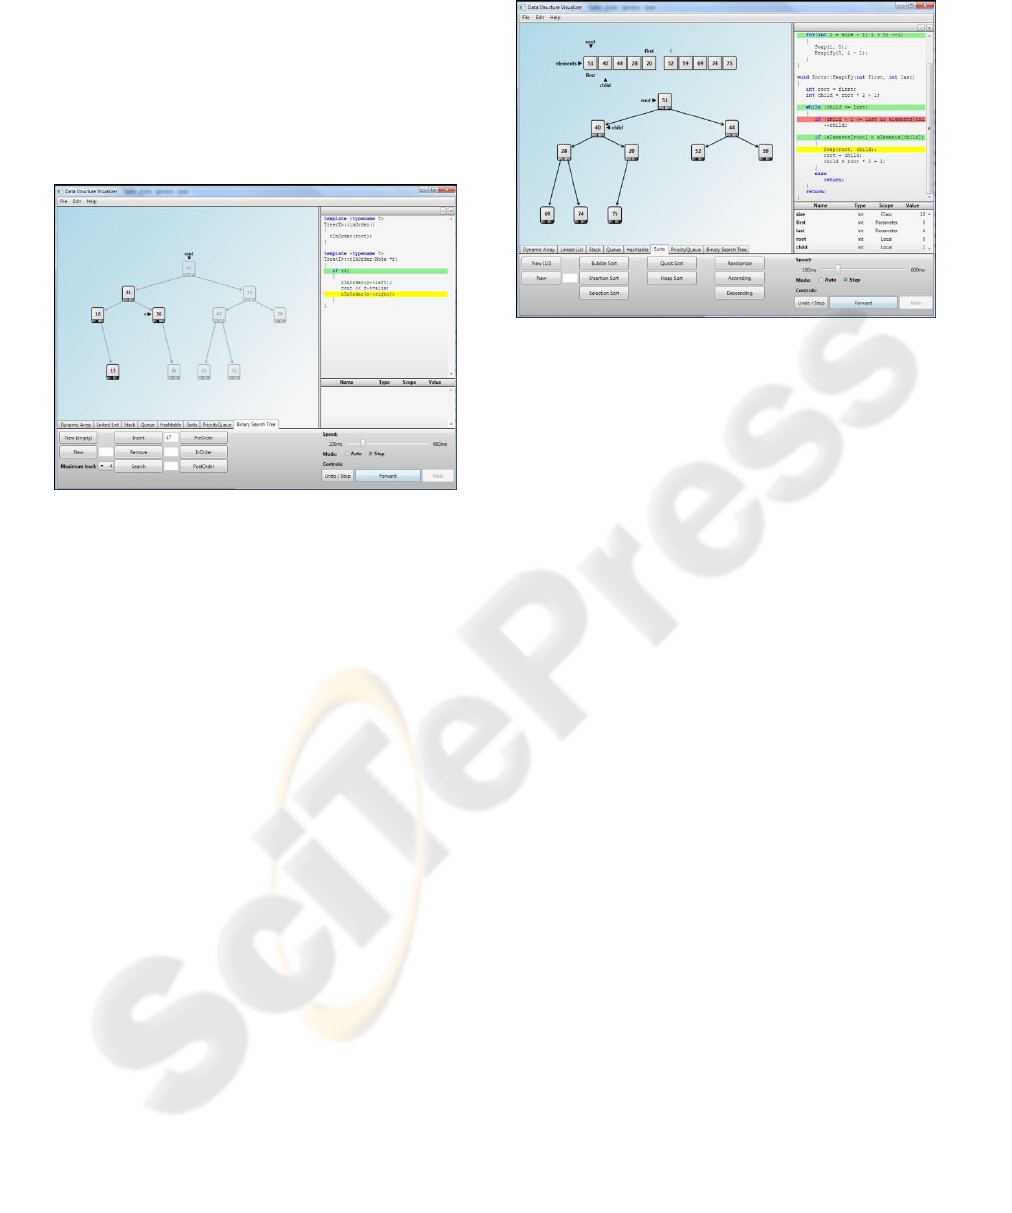
Figure 8 shows a standard „inOrder‟ traversal
algorithm being demonstrated.
Figure 8: Demonstration of binary tree traversal.
Another algorithm that typically challenges
undergraduate computer science students is „heap
sort‟. This algorithm is notoriously difficult to
conceptualize, and hence an animated representation
of the steps involved is invaluable. The DSV depicts
the values to be sorted in both an array, as well as
showing their logical view in the form of a binary
tree. Again, each line of code in the implementation
may be stepped through with the configuration of
each data structure being modified accordingly.
Figure 9 shows the DSV‟s display after several
iterations of the heap sort algorithm.
The sort visualization includes some additional
features. First, when activated it automatically
creates an array of a default or specified size filled
with random integers, rather than requiring the user
to build the structure before sorting it. Also, instant
methods to randomize the data, and sort it in
ascending or descending order are provided. These
methods allow students to explore the performance
of each sorting algorithm on data which is already
sorted, or sorted in reverse order.
Additionally, this software fully supports undo
and redo functions, which are generally not included
in other similar offerings. This is particularly
important for a teaching tool because it allows the
instructor or student to repeatedly witness the same
operation with the same data, or to experiment with
the structure freely and still be able to restore it to a
prior state when needed.
Figure 9: Demonstration of the heap sort algorithm.
Most structures offer two general kinds of
approaches to adding data: adding a specific value,
or adding a random value. The ability to add a
random value with a single button-press was deemed
important because it allows users to quickly grow a
structure without the potential tedium of manually
entering data. Additionally, some data structures
have constructors which can create the structure with
some random data already in it – binary trees can be
created with a specified number of random nodes
already added (and can be limited by maximum
allowable level), and priority queues can be filled to
approximately 75% full when constructed (as would
happen when adding an entire array to the priority
queue), allowing the simulator to demonstrate an
initial heapify function.
The structures featured are designed to be
flexible and clear. For example, the software
supports both linked and array-based stacks and
queues, but allows the user to interact with each
form of implementation through the same interface.
Furthermore, the code in each function is chosen for
clarity and readability, not necessarily because it is
the most efficient approach or involves the fewest
characters of code. Since this is a teaching tool, the
goal is to have code that represents commonly
taught methods and can be readily understood by
students.
Through the interface described in this section,
both students and instructors are easily able to
benefit from the tool. Students are permitted to
experiment with standard data structures and
algorithms being studied, repeatedly tracing their
evolution through numerous manipulations.
Moreover, instructors have an invaluable tool to
enhance their presentations.
ABSTRACT CONCEPTS TO CONCRETE IMPLEMENTATION - Visualizing the Evolution of Data Structures through
Animation
285

4 TOOL DESIGN AND
IMPLEMENTATION
C# .NET and WPF (Windows Presentation
Foundation) were selected early on in the design
process, partially due to some previous experience
with .NET development, but also because .NET and
WPF in particular offer several features that
significantly enhanced the software. WPF allows for
faster and more streamlined development of visual
elements of an application through the use of
XAML, and has much richer features for graphical
applications. The data binding capabilities of WPF
are extensively used in this application, which
greatly simplifies the logistics of moving collections
of visual objects around the screen by allowing them
to be bound together and automatically handled as a
single unit. Additionally, the flexibility and power of
anonymous methods and lambda expressions in
.NET allow for one of the most unique features of
this software – a variable-speed, interactive
execution of data structure functions which can be
run automatically or stepped through line by line.
This application uses a custom visual framework
designed specifically to represent and manipulate
data structures as visual objects. In all but a few
cases, the structures with which users interact are
composed of the visual objects themselves.
Individual data structures are built from a base data
structure class which handles basic manipulation of
these objects, can arrange them into independent
groups, display value-type variables in a structure,
use illustration objects to highlight pointers, loop
iterators or other peripheral elements, and saves and
restores structure states to allow undo and redo
operations. By using a smart canvas as a drawing
surface for these visual objects, they can be
automatically scaled and centered, allowing a
structure to grow arbitrarily large.
Each data structure function occurs in two
phases: first, a look-ahead phase pre-determines
everything that will occur in a particular execution
of a function based on user input, and in doing so
creates a list of anonymous delegates which act as
small, dynamically generated functions each
representing a single line of code. A controller then
steps through these functions one at a time, allowing
the user to demonstrate them slowly, speed through
them quickly or advance them by a mouse click.
Particular attention was paid to the smoothness and
uniformity of animations, to both capture student
attention and enhance the learning experience.
As originally intended, each line of sample code
displayed corresponds to some action on the screen.
Even small details, such as the lifetime of variables
within their scope, have been considered so as to
provide a completely accurate portrayal of how code
is behaving. The sample code is highlighted both by
„active line‟ and by „pass or fail‟ on conditionals,
illustrating movement inside and between loops and
clauses. Providing a mapping between individual
programming language statements and an animated
display enables the algorithm to come to life, and
greatly aids a student in transitioning from an
abstract concept to a concrete implementation.
5 CONCLUSIONS
The visualization software described in this paper
presents significant benefits for both instructors and
students. In addition to the clear animation features
of this tool, the ability to step through individual
lines of code and observe the effects on data
structures being considered is invaluable. The
expandable design of the tool provides enormous
future potential for additions of more advanced data
structures and algorithms.
This application is now entering testing in Data
Structures courses at Webster University. As part of
this phase, we intend to gather quantitative and
qualitative information from students regarding the
effectiveness of the tool, what features they find
most useful, which ones they find less useful or
could use improvement, and gather suggestions for
useful additions in future versions. The experiences
and opinions of this first group of students will be
extremely important for future development.
Based on some initial feedback, there are already
new features planned for the next release. First,
additional structures will be added (namely AVL
trees and doubly linked lists), as well as new sort
algorithms and variations on existing functions (for
example, different methods of chaining and handling
collisions in a hash table). Additionally, support for
variable levels of detail on structures is planned. For
example, a quick sort could be shown in full detail,
or in a simplified version which omits the actual
line-by-line partition code and displays only the
results of recursive partition, which could be useful
as an introduction to the algorithm.
Finally, some upgrades to the interface which are
planned include the addition of an overlay on top of
the drawing surface which will contain a “key”
illustrating the components of each visual element,
as well as support for variations in the appearance of
elements themselves. WPF's XAML-based styling
greatly simplifies altering the appearance of ele-
CSEDU 2010 - 2nd International Conference on Computer Supported Education
286

ments and supporting different skins.
We believe we have created a unique educational
tool with significant potential for in-classroom
instruction and individual student use. It
significantly exceeds the visualization capabilities of
similar offerings while simultaneously
demonstrating the explicit associations between the
logical view of a data structure and the code used to
create and manipulate it. Effectively, it allows
students to “see” code behave in a way that was
previously not possible. Additionally, the project
itself was an invaluable learning experience,
involving all phases of design and development on a
challenging topic that was both personally relevant
and extremely useful for the academic community. It
is our hope that this can become a widely used tool
which enhances the classroom experience for both
instructors and students.
REFERENCES
Aho, A., Ullman, J., Hopcroft, J., 1983. Data Structures
and Algorithms,Addison Wesley.
Chen, T., Sobh, T., 2001. A Tool for Data Structure
Visualization and User-defined Algorithm Animation,
fie, vol. 1, pp.TID-2-7vol.1, Frontiers in Education
Conference, 2001. 31st Annual, 2001.
Erkan, A., VanSlyke, T.J., Scaffidi, T., Data Structure
Visualization with LaTeX and Prefuse. ITICSE 2007,
Dundee, Scotland.
ABSTRACT CONCEPTS TO CONCRETE IMPLEMENTATION - Visualizing the Evolution of Data Structures through
Animation
287
