
THE APP ORACLE
An Interactive Student Competition on Pattern Recognition
Alfons Juan, Jes´us Andr´es, Adri`a Gim´enez, Jorge Civera, Roberto Paredes and Enrique Vidal
DSIC/ITI, Universitat Polit`ecnica de Val`encia, Cam´ı de Vera, s/n, 46022 Val`encia, Spain
Keywords:
Interactive learning, Student competition, Pattern recognition.
Abstract:
This paper describes the implementation of an interactive student competition in an introductory course to
pattern recognition. This competition is based on the automatic evaluation of student performance thanks to a
piece of software to which we refer as the APP oracle. The oracle assesses the accuracy of three different type
of classifiers provided by students on a series of predefined tasks. Students are scored for each classifier-task
pair according to the error rate of their classifiers and that of their colleagues, promoting competitiveness.
A global score for each student is finally computed from his/her rank in the different classifier-task pairs,
contributing to his/her final grade. This fact strongly motivates students to harvest a deeper knowledge of the
topics covered in the course and a greater degree of implication in class.
1 INTRODUCTION
Motivating students has always been a challenge for
instructors. The design of assignments that awake the
curiosity and interest of our students is a must in order
to enhance their knowledge and push them to explore
beyond the material of the course. One possible way
to capture students’ attention is to involve them in a
competition as a part of their evaluation.
In computer science (CS) courses, such as intro-
ductory pattern recognition, students are presented
with problems that need to be solved with minimum
error rate. This idea can be reformulated in terms of
a competition in which students try to find the best
solution to a proposed problem.
Competitions are excellent catalysts to boost the
state-of-the-art in many scientific areas. Pattern
recognition related conferences hold numerous com-
petitions. However, this is not so often the case in the
academic field for pattern recognition related fields,
with the notable exception of the Data Mining Cup
1
.
Student competitions are an excellent resource to
accelerate students’ learning process. These compe-
titions are found in many CS courses, for example
in introductory courses to data structures (Lawrence,
2004) and artificial intelligence (Barella et al., 2009).
This paper describes a similar experience in a short in-
troductory course to pattern recognition (Duda et al.,
1
http://www.data-mining-cup.com
2001). The course is entitled Learning and Percep-
tion, but usually referred to by its Spanish/Catalan
acronym, APP. It is a 45-hour course in the 4th year of
Computer Science at UPV (Spanish/Catalan acronym
for Polytechnic University of Valencia).
2 APP
The APP programme consists of 8 lectures given in
13 weekly sessions of 2 hours each, and 3 lab assign-
ments (partially) carried out during 12-13 sessions of
1.5 hours. Most APP lecture time is devoted to ba-
sic statistical decision theory and supervised learn-
ing (lectures 3, 4, 5 and 8). The remaining lecture
time mainly covers elementary concepts of image and
speech preprocessing (lectures 2 and 7), and conven-
tional clustering techniques (lecture 6).
Regarding lab assignments, it is convenient to dis-
tinguish between the APP oracle and the other two as-
signments. Note that nearly half of the total lab time
is devoted to the APP oracle: main parts, classifica-
tion datasets, examples of use, etc. During this period
of time, we also describe in full detail how to design
complete pattern recognition experiments from only
the available (training) data.
Evaluation of APP consists of a theoretical writ-
ten exam, which accounts for the 70% of the global
qualification, and lab exercises (including the oracle).
385
Juan A., Andrés J., Giménez A., Civera J., Paredes R. and Vidal E. (2010).
THE APP ORACLE - An Interactive Student Competition on Pattern Recognition.
In Proceedings of the 2nd International Conference on Computer Supported Education, pages 385-388
DOI: 10.5220/0002797103850388
Copyright
c
SciTePress
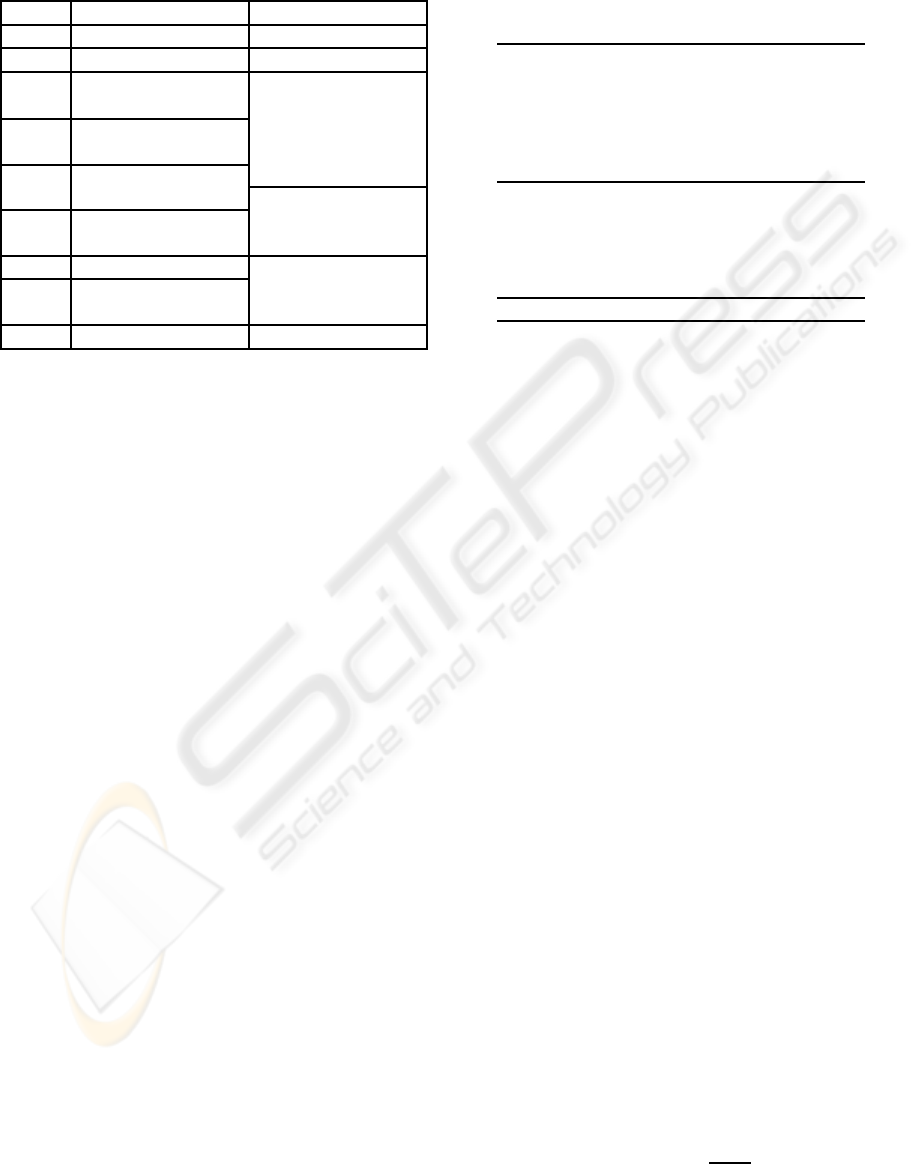
Table 1: APP Programme: 8 lectures given in 13 weekly
sessions of 2 hours each, and 3 lab assignments (partially)
carried out during 12-13 sessions of 1.5 hours.
Week Lecture Lab Assignment
1 1. Introduction —
2 2. Image Preproc. Working Environ.
3 3. Statistical
Decision Theory
1. The APP Oracle
4
5 4. Distance-Based
Classifiers6
7 5. Discriminant
Functions8
2. Face
Recognition
9 6. Unsupervised
Learning10
11 7. Speech Preproc.
3. Speech
Recognition
12 8. HMM-based
Classifiers13
14 — Open Session
The exam is divided into two parts: a questionnaire of
multiple-choice questions, which has to be answered
in one hour at most, and a few, free-response pattern
recognition problems that must be solved in a maxi-
mum of two hours. On the other hand, evaluation of
lab exercises is done at the lab except for the oracle,
which is evaluated from the submitted classifiers as
described in Section 5. The oracle accounts for the
20% of the global qualification, while the remaining
10% corresponds to lab assignments 2 and 3.
3 CLASSIFICATION DATASETS
The APP oracle comprises 11 pattern recognition
datasets (tasks): 6 of them are based on vectorial
data representations, while the remaining 5 involve
symbolic (string) data. The vectorial datasets are
expressions, gauss2D, gender, news, ocr20x20 and
videos, while the symbolic datasets are abecede, cro-
mos, krev, ocrcc8, traveller.
Each dataset is partitioned into a training set and
a test set. The training sets are made available to stu-
dents for them to develop accurate classifiers using
appropriate supervised learning techniques. On the
contrary, the test sets are not made available to stu-
dents. They are only used by the APP oracle to mea-
sure the error of each student-developed classifier.
Some basic statistics of the classification datasets
are summarised in Table 2. On average, they involve
7.7 classes, 2866 training samples, and 1591 test sam-
ples. The vocabulary size of the traveller dataset is the
number of distinct words in the training sentences.
Table 2: Basic statistics of the classification datasets
(D=”feature space dimension” or ”alphabet size”,
C=”number of classes”, NTr=”number of training sam-
ples”, NTe=”number of test samples”).
Name D C NTr NTe
expressions 4096 5 88 92
gauss2D 2 2 200 1000
gender 1280 2 946 946
news 100 20 16000 3974
ocr20×20 400 10 700 300
videos 2000 2 2692 2694
abecede 4 4 3000 1000
cromos 11 22 2200 2200
krev 5 2 1000 1000
ocrcc8 8 10 700 300
traveller 626 4 4000 4000
Average - 7.7 2866 1591
4 CLASSIFICATION
TECHNIQUES
As discussed in the introduction, APP is a short intro-
ductory course on (statistical) pattern classification,
and hence only a few, basic classification techniques
are described. They are introduced as approximations
to the so-called Bayes decision rule:
c
∗
(x) = argmax
c=1,...,C
p(c | x) (1)
where x is the object to be classified, c = 1,. . .,C is
the class variable, and p(c | x) is the actual posterior
probability that x belongs to class c. The predicted
class, c
∗
(x), has maximum posterior probability, and
thus this classifier has minimum probability of pro-
ducing classification errors.
In what follows, we briefly describe the three ap-
proximations to (1) that are introduced in APP. For
brevity, only a few technical details are given for each
approximation. For further details, the reader is re-
ferred to (Duda et al., 2001).
4.1 The k-NN Classifier
The first approximation to the Bayes rule is the so-
called k-nearest neighbour (k-NN) classifier. This
classification technique requires a distance function
to be defined so as to measure the proximity between
any pair of data points. Given such a distance func-
tion, posterior class probabilities can be locally esti-
mated from a given collection of prototypes (labelled
training samples) as:
ˆp(c | x) =
k
c
(x)
k
(2)
CSEDU 2010 - 2nd International Conference on Computer Supported Education
386

where k is a predefined number of nearest neighbours
to be considered and k
c
(x) is the number of nearest
neighbours of x that are labelled with c. The k-NN
classifier uses (2) to approximate (1); it assigns x to
the most voted class among its k nearest neighbours.
4.2 The Linear Classifier
The second approximation to the Bayes rule is the
well-known linear classifier (for vectorial data):
c
∗
(~x) ≈ argmax
c=1,...,C
g
c
(~x) (3)
where, for each class c, g
c
(~x) is its linear discriminant.
4.3 The HMM-based Classifier
In contrast to the previous classification techniques,
the third approximation to the Bayes rule is devoted
to symbolic (string) data. This approximation is best
described by first rewriting the Bayes rule as:
c
∗
(x) = argmax
c=1,...,C
log p(c) + logp(x | c) (4)
where p(c) is the prior probability of class c, and
p(x | c) is its class-conditional probability function.
Then, we assume that each class-conditional proba-
bility function p(x | c) is given by a class-conditional
Hidden Markov Model (HMM) M
c
, thus:
c
∗
(x) ≈ argmax
c=1,...,C
log p(c) + log p(x | M
c
) (5)
This is referred to as the HMM-based classifier.
5 THE ORACLE
The APP oracle is implemented on a Web-based inter-
face comprising five main pages: start, data, classi-
fiers, submissions, and scores. As its name indicates,
the start page is the initial page to visit (see Fig. 1). It
includes a navigation bar with links to the main pages,
and a body with the evaluation schedule (every day at
23:35 in Fig. 1) and a section of best results for each
classifier-task pair. Each result corresponds to a dif-
ferent submission and includes the test-set error, in
percentage and absolute terms, as well as the submis-
sion date, hour and file name. Also, each section of
best results includes a link to a page where all results
for its corresponding classifier-task pair are listed in
non-decreasing order of test-set error.
The data page simply lists both the vectorial and
symbolic datasets described in Section 3, together
with brief descriptions and links to their training sets.
Figure 1: Start page of the APP oracle.
Analogously, the classifiers page describes the clas-
sification techniques discussed in Section 4, file for-
mats for submissions, and a few examples of baseline
classifiers for different tasks.
The submissions page allows the students to sub-
mit their classifiers individually, or in groups of two.
Each submission is actually an uploaded file associ-
ated with a certain classifier-task pair; that is, learnt
from the training samples of a specific task, and ap-
propriately written in a specific classifier format. The
APP oracle runs periodic evaluations in accordance
with the planned evaluation schedule shown in the
main page. At each evaluation, the oracle tests up-
loaded classifiers on their corresponding test sets and
updates all oracle pages accordingly. Students are not
allowed to submit new classifiers while a previously
submitted still awaits evaluation. This is to avoid
“training on the test data” by repeatedly testing mi-
nor classifier variations on the test data.
Finally, the scores page contains a table of student
scores. Although the oracle maintains a complete log
of evaluation results, only the best (test-set) error for
each student in each classifier-task pair is taken into
account. This best error receives a score from 0.1 to
1 only if it is not below a predefined minimum error
for its corresponding classifier-task pair; otherwise, it
is ignored. The precise value from 0.1 to 1 assigned
to it depends on the quality of the error (1=high-
est quality), as compared with other student errors.
The table of student scores shows, for each student
(row), the student identifier (unknown for other stu-
dents), the current scores for all classifier-task pairs,
and the global score, which is simply the sum of cur-
rent scores at classifier-task level. It is sorted in non-
increasing order of global scores.
6 LATEST RESULTS
The oracle stores a complete log file of evaluation re-
sults. The analysis of this file draws interesting con-
THE APP ORACLE - An Interactive Student Competition on Pattern Recognition
387
clusions about the usage that students made of the or-
acle and the degree of accomplishment of the diverse
classifier-task pairs over the duration of the course.
Figure 2 shows the accumulated percentage of
submissions over the total number of submissions re-
ceived by the oracle, as a function of the course week.
The three plotted curves correspond to the submis-
sions received for the three classifiers presented in
Section 4: k-NN, linear and HMM-based classifiers,
denoted as nn, lin and hmm, respectively.
0
10
20
30
40
50
60
70
80
90
100
1 2 3 4 5 6 7 8 9 10 11 12 13 14 15 16 17 18
0
10
20
30
40
50
60
70
80
90
100
acc. % submissions
nn
week
lin
hmm
Figure 2: Accumulated percentage of submissions over the
total number of submissions received by the oracle, as a
function of the course week. Each curve is the percentage
of submissions for each classifier: k-NN, linear and HMM-
based classifier, denoted as nn, lin and hmm, respectively.
As shown in Figure 2 and strongly correlated with
Table 1, submissions with each classifier start as soon
as students have acquired the necessary knowledge in
the theory sessions about that classifier, and the oracle
has been presented in the practical sessions.
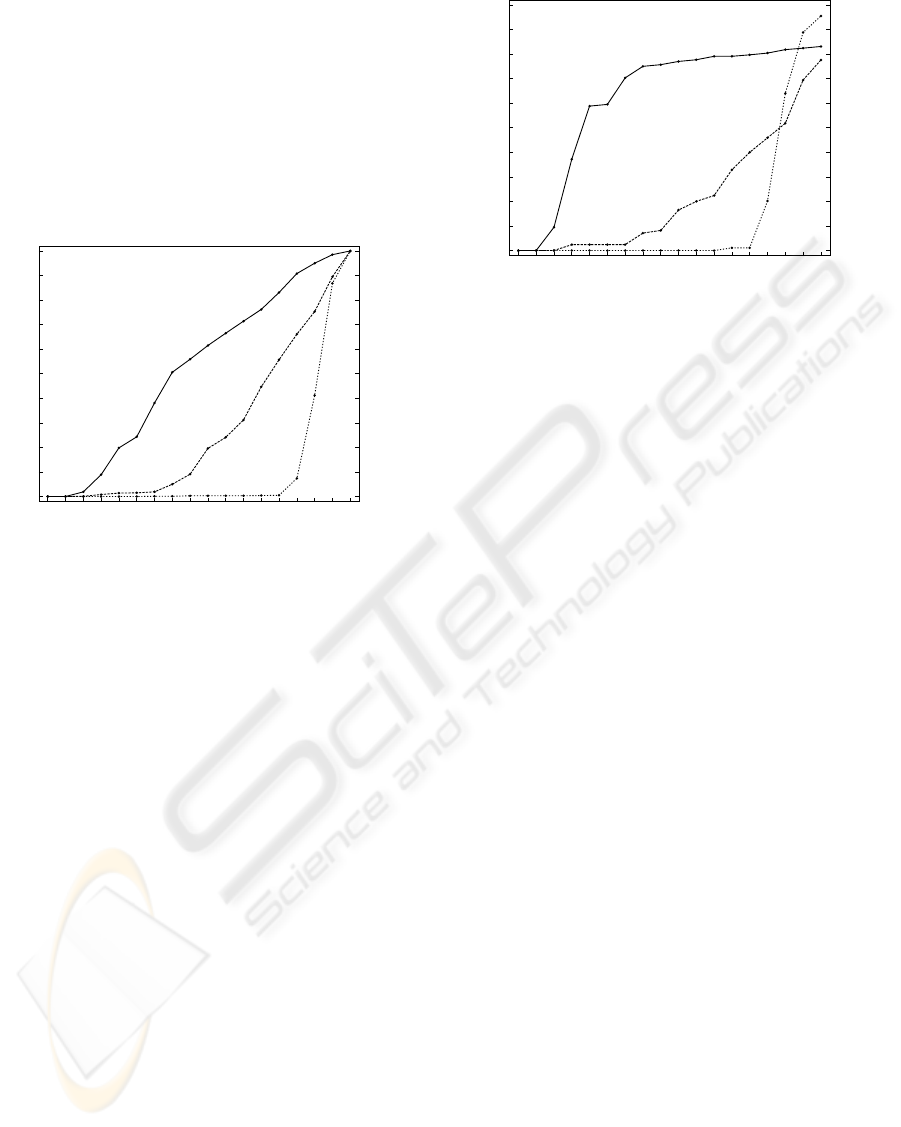
Figure 3 presents the accumulated percentage of
students that accomplished at least one of the tasks for
a given classifier over the APP course. We mean by
accomplish a task to lower the error threshold defined
beforehand for each pair classifier-task. We will also
refer to this fact as to student success.
In Figure 3, 70% of the students accomplished at
least one task using the k-NN classifier by the seventh
week, that is, the next week after presentation of lec-
ture 4 (see Table 2). Since then, until the day of the
exam, the percentage of students increased up to 83%.
However, linear classifiers seem to put in some trou-
ble a group of students. The ninth week, right after
lecture 5, more than 90% of the students were unable
to accomplish at least one task using a linear classi-
fier. At the end of the course, there still were more
than 20% of the students, who ever submitted a linear
classifier, not being able to use a linear classifier to
accomplish a single task. This indicates that there is a
group of students that do not feel comfortable work-
0
10
20
30
40
50
60
70
80
90
100
1 2 3 4 5 6 7 8 9 10 11 12 13 14 15 16 17 18
0
10
20
30
40
50
60
70
80
90
100
week
acc. % student success rate
nn
lin
hmm
One or more tasks
Figure 3: Accumulated percentage of students accomplish-
ing at least one of the tasks for a given classifier, as a func-
tion of the course week. Each curve represents the percent-
age of students for each classifier: k-NN, linear and HMM-
based classifier, denoted as nn, lin and hmm, respectively.
ing with linear classifiers and they would require fur-
ther attention. In contrast, HMM classifiers were suc-
cessfully used by most of the students to accomplish
at least one task by the end of the course. Indeed, al-
most half of the students who submitted HMM clas-
sifiers, accomplished all five symbolic tasks.
7 CONCLUSIONS
This paper presents a student competition in the con-
text of an introductory course to pattern recognition.
A global ranking with all the students is derived and
he position of a student in it determines part of the
grade of the course. This fact strongly motivates stu-
dents to explore innovative solutions, study extra ma-
terials and follow references provided by instructors.
As a result, students harvest a deeper knowledge of
the topics covered in the course and awake their cu-
riosity for research in pattern recognition. Students
showed their enthusiastic approval for the oracle as
reflected by their active participation in Figure 2.
REFERENCES
Barella, A. et al. (2009). JGOMAS: New Approach to AI
Teaching. IEEE T. on Education, 52(2):228–235.
Duda, R. O., Hart, P. E., and Stork, D. G. (2001). Pattern
Classification. Wiley.
Lawrence, R. (2004). Teaching data structures using com-
petitive games. IEEE T. on Education, 47(4):459–466.
CSEDU 2010 - 2nd International Conference on Computer Supported Education
388
