AN ENHANCED PRACTICAL PROGRAM ON DATA MINING
EDUCATION
Hiroyuki Morita, Masashi Kondo, Tomonori Ishigaki, Nagateru Araki and Yuji Nakayama
School of Economics, Osaka Prefecture University, 1-1 Gakuenmachi Nakaku Sakai, Osaka, Japan
Keywords: Data mining, Challenging education, Competition.
Abstract: To provide effective data mining education, practical data, high-level mining tools supported by computer,
and students’ interests are essential factors. To provide such education, we incorporated data analysis
competition into our data mining education. The competition highly motivates students; however, there was
no connection between their analysis and the practical usage. In our new educational program, we
incorporate a real sales promotion by the students themselves who propose a good analysis at a real shop.
By investigating some questionnaires for the students, we show that our program has a good evaluation.
1 INTRODUCTION
From the viewpoint of practical usage, data mining
education has been promoted since several years. To
implement the successful achievement of this
program, we need many factors than other existent
programs. In particular, in this course, a practical
data mining process supported by computer is highly
important. This is because experiments that analyze
extensive practical data are valuable for students to
develop a more comprehensive understanding.
However, it is not easy to generate practical data in a
real shop. To meet this necessity, from data of past
several years, we prepared a data of our University
Co-op shop, as real business data. By using this data,
we conducted a data analysis competition, which
provides common data to student participants and
they rival each other by their analysis.
The data that we use comprises about 1.5 million
records and several hundreds of items. Although the
shop is not big, its data is similar to those of an
outside real shop. A glance shot of the data is as
follows.
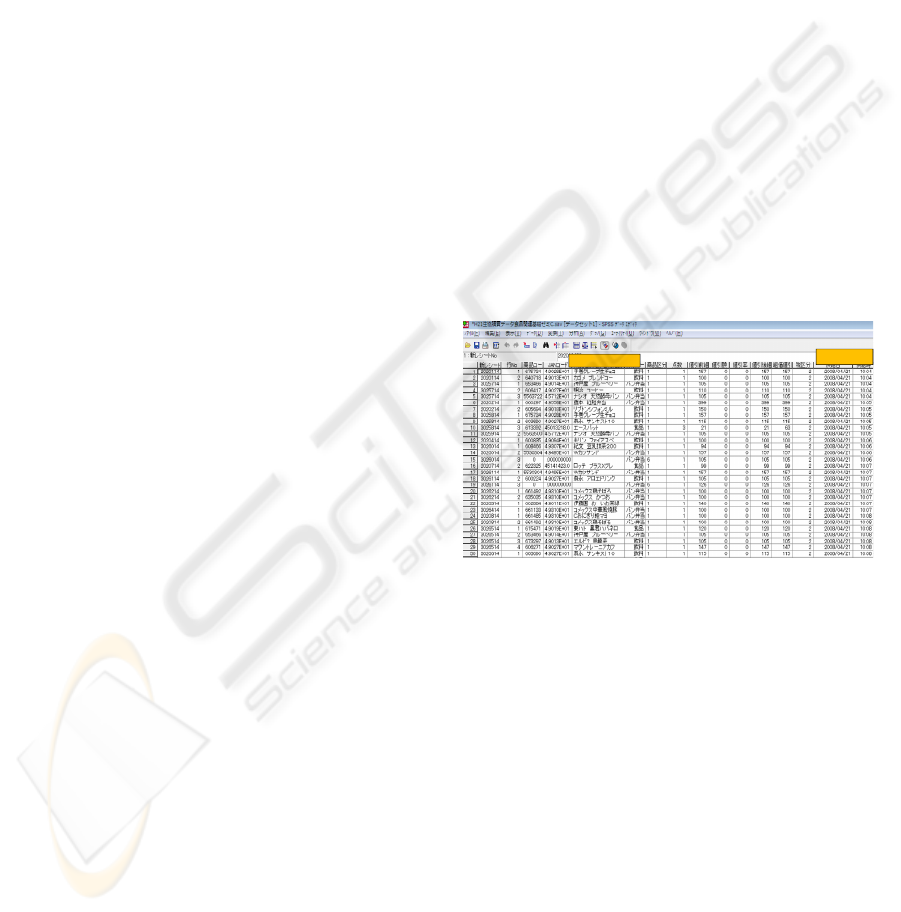
Figure 1 illustrates an overview of the point-of
sales (POS) data that we used. It has general data
attributes such as item code, purchasing time, and
receipt number. As an example of aggregation,
figures 2 and 3 illustrate the monthly sales and sales
by the hour for food and drinks, respectively.
Figure 1: An example of POS data.
Figures 2 and 3 illustrate that the sales are
unbalanced. In particular, around noon, we observe a
significant amount of sales.
In addition to the competition, we implement a
new trial which performs their analysis on the
University Co-op. It is an interesting and
challenging task.
As a related work, (Kay et al.. 2006) utilized data
mining method to extract effective communication
event patterns in student’s teamwork. They are
interesting, but we have a gap how to use data
mining to educational programs.
POSData(ScannerData)ofUniv Coop
Day/Time
NameofProduct
177
Morita H., Kondo M., Ishigaki T., Araki N. and Nakayama Y. (2010).
AN ENHANCED PRACTICAL PROGRAM ON DATA MINING EDUCATION.
In Proceedings of the 2nd International Conference on Computer Supported Education, pages 177-180
DOI: 10.5220/0002797201770180
Copyright
c
SciTePress
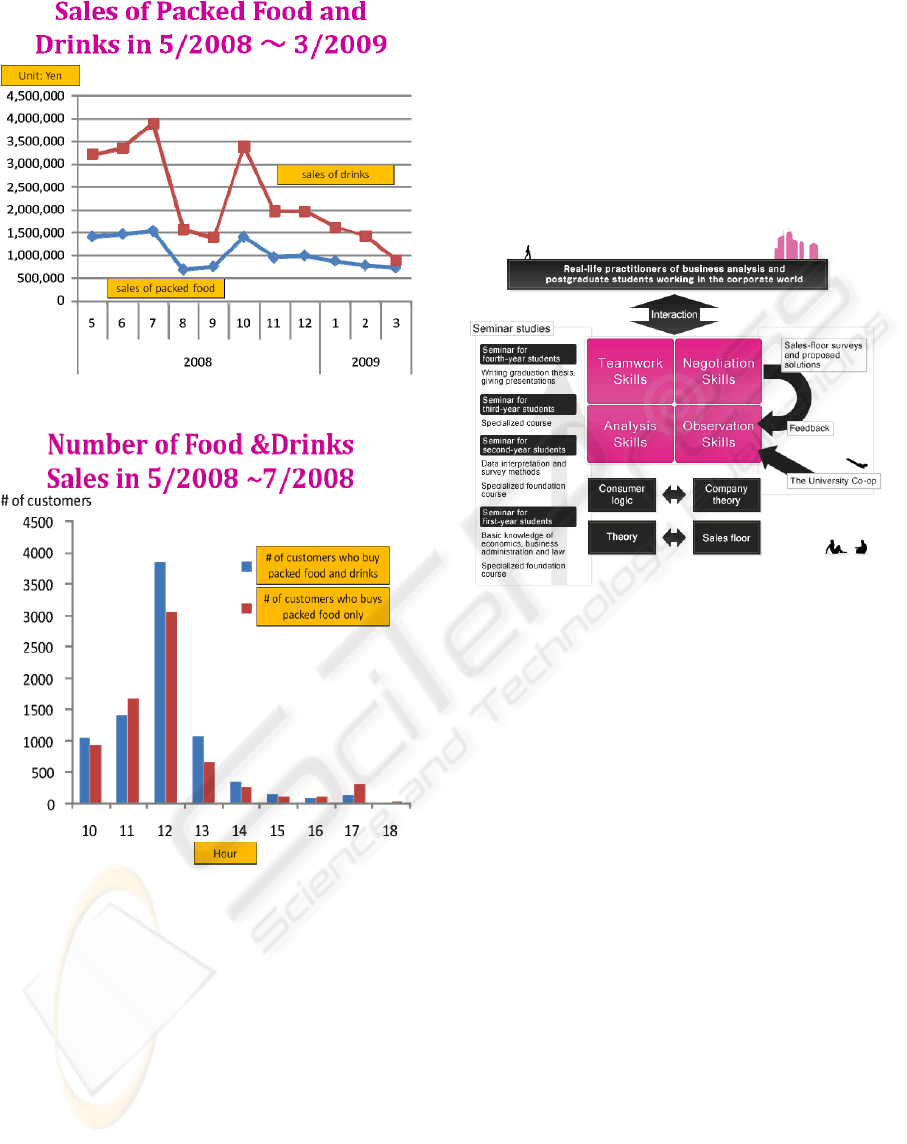
Figure 2: Monthly sales of food and drinks.
Figure 3: Food and drinks sales by the hour.
We explain our trial as follows. Section 2 describes
our aim and program, section 3 shows the practice in
this year, and section 4 draws a conclusion.
2 EDUCATION PROGRAM
2.1 The Aim and Distinctive Features
of this Education Program
By providing real-life business experience and an
opportunity to analyze business data, this academic
program aims to foster the development of
individuals who possess the abilities needed to
identify problems and come up with business
solutions by themselves. The distinctive feature of
this program is that with the cooperation of
University Co-op, actual on-campus business
premises are used as learning resources, and the
daily sales activities carried out in these premises,
along with the POS data obtained on a daily basis by
the Co-op, are used as teaching materials.
Figure 4: The aim of the education program.
Divided into teams of four or five, the
participating students carry out role-playing
exercises by acting as “distribution advisers” or
“business consultants”; this enables them to learn the
theory and application of data mining based on the
real-world experience. In addition to helping the
students learn the skills of teamwork, negotiation,
analysis and observation, and their importance there
of, these role-playing exercises enable them to
identify problems concerning real-life sales, which
would not be possible through lectures alone.
Furthermore, in this experiential learning process,
the students attempt various business solutions. In
addition, through their interaction with not only
faculty members but also real-life practitioners of
business analysis and postgraduate students working
in the corporate world, they learn how to present
their findings from new perspectives and how to put
forward practical business solutions.
2.2 Outline of the Education Program
Once the first- and second-year students have
completed their Liberal Arts Course and Specialized
Foundation Course or while they are taking them,
CSEDU 2010 - 2nd International Conference on Computer Supported Education
178
four classes in the second-year’s Seminar for Basic
Studies form the central locus of learning in this
program.
To enable second-year students to perform
problem-solving using large volumes of business
POS data, an advanced data mining system has been
introduced to ensure that liberal arts students as well
as those majoring in business subjects achieve
excellent results. The system consists of various
software-enabled data mining tools to be used
simultaneously on computers with a high processing
capacity.
The POS data analyzed consists of one to two
years’ worth of receipts data generated on a daily
basis in Osaka Prefecture University Co-op shops
and cafeterias. This includes POS data with ID,
which enables the tracking of individuals’
purchasing history after the data has been
anonymized.
Working in teams of four or five, students are
required to (1) adopt the viewpoint of those who
manage the business of University Co-op and (2)
find ways to use the Co-op’s data to improve its
business performance. For this, the students need to
observe how business is carried out at nearby stores
and eateries, perform various surveys, and interview
the members of the Co-op’s staff.
Presentation sessions are held in which students
report on their findings and have their analyses and
proposals evaluated. These sessions are attended not
only by the representatives of the Co-op but also by
specially invited business people with practical
experience of sales, purchasing, and data-handling in
various types of enterprises, thus bringing students
into contact with the real-life business world.
Challenge sessions verify the excellent team’s
proposal at the Co-op shop. Next, students try to
conduct sales at the Co-op shop as per their proposal
during one week. Students have to display the
commodities and carry out verification work by
order. Again, they identify the practice and their
proposal and have to report the results to the chief of
the Co-op shop and the members of this project.
3 APPLICATION OF DATA
ANALYSIS AT THE Co-oP
STORE
The announcement convention in which an all-star
team participates from a class (the current date is
September 24, 2009) is held. In this convention, the
report of an analysis proposal is presented between
the excellent (4 or 5) team of the class representative
of basic seminar C of second-year students and the
participating (3 or 4) team from special seminar,
which is conducted by the staff of this program.
Further, the content of the report is evaluated by
judges, including a judge outside the school, and
superiority or inferiority is decided.
3.1 Result Report Association
Excellence Announcement Outline
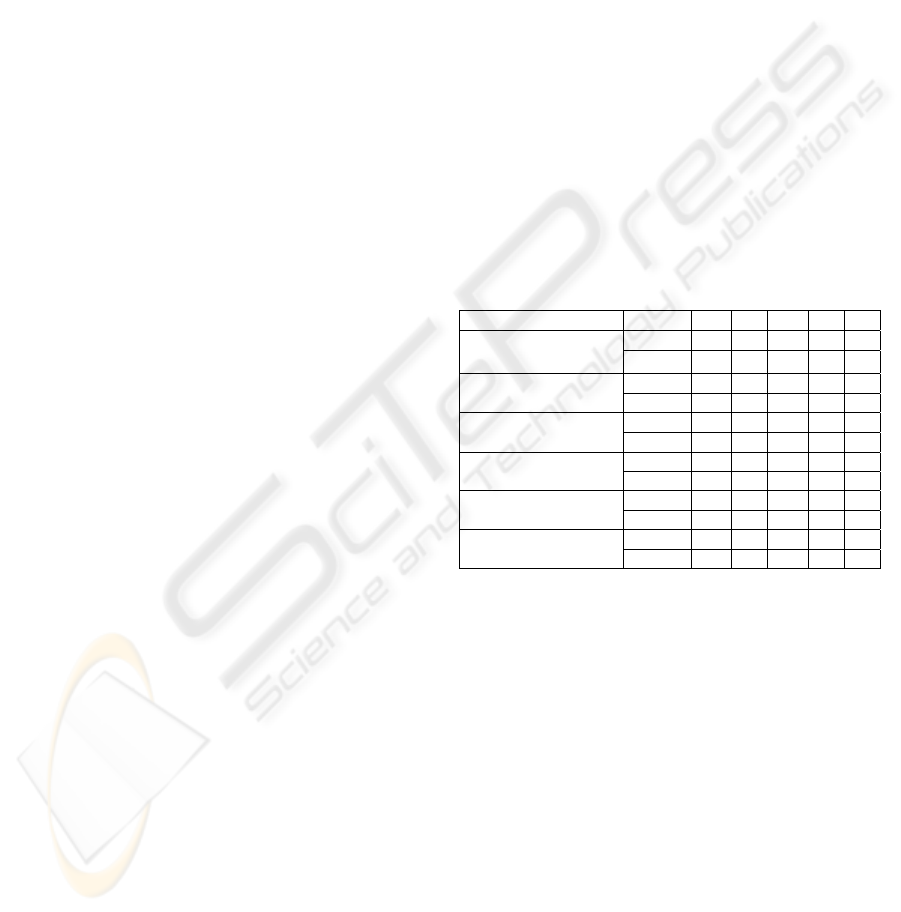
Report 1:
This team conducted sales promotion that gave a
10% discount of drinking products to customers who
bought dairy desserts such as yogurt and pudding.
Figure 5 shows that almost all the products of both
the categories were sold out. Thus, this sales
promotion seemed to work well, although a detailed
analysis that would compare the figure with that in
another period without the sales promotion must be
conducted.
Dairy dessert
in-out
Mon. Teu. Wed.
Thur.
Fri.
Cream puff (Monteur)
line-up
8 8
buy-out
8 8
Pudding (Glico)
line-up
5 5
buy-out
2 3 5
Caramel pudding
(Ropia)
line-up
6
buy-out
1 4 1
Chocolate crape
(1:Ropia)
line-up
8
buy-out
7 1
Chocolate crape
(2:Monteur)
line-up
6
buy-out
6
Yogurt (Meiji)
line-up
6
buy-out
1 1 1 2 1
Figure 5: Sales of dairy desserts.
Report 2:
This team analyzed the opportunity loss of sales.
They showed a prediction using the volume of sales
as a function of a day of the week and temperature.
In this analysis, the paper pack drink is applicable to
the analysis. They chose the goods of the annual
sales best 10, and expected the amount of
opportunity losses. The goods that have a slightly
less order quantity according to their analysis and
should increase the order quantity were ascertained.
3.2 Approach of Challenge
Introduction in Co-op Bread Shop
Site
The experience of the verification of the proposal
AN ENHANCED PRACTICAL PROGRAM ON DATA MINING EDUCATION
179

on the site in the bread shop by a result report
association excellent team and the sales site was
given by cooperation in the Co-op sales in the
current year (bread shop challenge). The testing
period was two weeks from October 19, 2009, to
October 30, 2009. The team of report 2 took charge
in the first week (20:30 was assumed to be business
hours from 8:30 on weekdays) and the team of
report 1 took charge of the second week.
The main work is as follows.
1: Order work (done two days before the sales day)
2: Carrying work (exhibition of confirmation and
commodity of order goods)
3: Verification work (set sales goods decision, sale
notice of time, and POP substitution)
4: Abandonment commodity (The one to be
abandoned with daily goods that remained
unsold on that day is selected).
3.3 Comment on a Challenge
Students in both the teams said that the period of one
week, during which they managed some part of the
Co-op store, was too short. They had to order
products that would be sold out within one week.
They also said that if they had had another week,
they could have ordered a variety of products, which
would have satisfied customers’ demands. We must
take these opinions into account in order to make our
educational project in future more valuable and
enjoyable for students.
4 CONCLUSIONS
In this program, students are requested to obtain a
useful finding from the extensive POS data collected
for a long-term period of one year or more by the
group work. Students should (1) understand the
features of the commodity, customer’s purchasing
pattern, and features of the store; (2) analyze data
through trial and error while combining several
analysis tools; and (3) solve this problem in the
limited class time. Here, it is understood that
information technology plays a prominent role. That
is, the data mining software with high speed of
computational speed and GUI known by intuition,
an excellent display, and the presentation
environment are needed in addition to a naturally
necessary data mining and statistical model analysis.
It is thought that the education effect that these
functions are the following is brought;
1. It is necessary to verify various hypotheses to
obtain a significant result from a large amount of
capricious POS data. Therefore, it is necessary to
analyze the data repeatedly. For this, the system
with strong calculation ability is useful.
2. It is effective in obtaining the analysis result in a
short time, correcting the hypothesis, making the
model easy, and sustaining students’ interest and
concentration. As a result, the possibility of
reaching a satisfactory result increases.
3. It is necessary to allot the analysis business for
the findings by team work. The easiness of the
operation by GUI software is lost in the
difference of the capacity for the analysis of the
students in the team and contributes to the
decrease of time loss as a team.
4. The computer network to share an individual
analysis result mutually makes the group work
extremely efficient.
5. A big display and the presentation device are
effective in bringing the result together and
obtaining a final finding.
Our system meets a necessary requirement for
executing this program.
There has been much discussion on the POS data
with respect to the reality of the business process. To
solve this and to obtain an effective finding, our
educational system has adequate power. However,
we think that we can use only a part of this power.
We wish to draw out the power kept secret by
teacher and student’s collaborations.
ACKNOWLEDGEMENTS
This program is financially supported by the
program for Promoting High-Quality University
Education of the Ministry of Education, Culture,
Sports, Science, and Technology in Japan.
REFERENCES
Kay,J., Maisonneuve, N., Yacef, K., Zaiane, O., Mining
Patterns of Events in Students' Teamwork Data,
Proceedings of Educational Data Mining Workshop,
held in conjunction with Intelligent Tutoring Systems
(ITS), Taiwan, June 26, 2006.
CSEDU 2010 - 2nd International Conference on Computer Supported Education
180
