
SensorGIS
An Integrated Architecture for Information Systems based on Sensor Networks
Jianzhao Huang, Nicholas M. Boers, Eleni Stroulia, Pawel Gburzynski and Ioanis Nikolaidis
Department of Computing Science, University of Alberta, Edmonton, Alberta, Canada
Keywords:
Wireless sensor networks, Geographic information systems, Forums, Visualization.
Abstract:
In this paper, we describe SensorGIS, an integrated architecture for WSN applications. SensorGIS provides
an integrated service-oriented architecture for collecting, archiving, analyzing, and visualizing sensor network
data in a geographic information system (GIS). By using an extendible GIS framework as one of its user
views, SensorGIS can contextually communicate the collected data, its trends, and distinct values of interest.
In addition, it is designed in the service-oriented style and hence is extendible in terms of the analyses and
visualizations. Finally, it integrates an online collaborative forum that enables annotation of the collected data
with the users’ observations and interpretations.
1 INTRODUCTION
We observe that for sensors, to be systematically and
cost-effectively deployed in applications, it is essen-
tial to develop software architectures that treat them,
their data, and their potential services in an integrated
manner. For SensorGIS, we adopt a web-based archi-
tecture that relies on the representational state transfer
(REST) style of services to archive, analyze, and vi-
sualize sensor-network data. At the user-interaction
layer, it integrates (a) a geographic information sys-
tem (GIS) for contextually communicating sensed
data, (b) a visual data analysis component for explor-
ing interesting trends and events in the collected data,
and (c) a collaboration forum for enabling users to
share their observations and interpretations.
The fundamental innovation of SensorGIS is
twofold. First, it relies on an XML data representa-
tion and a REST-style architecture that integrates ser-
vices for data management, analysis, and visualiza-
tion. Second, it integrates three different components
to communicate data to end users: (a) a geographic
model, (b) data-specific visualizations, and (c) a col-
laborative tool for associating data with user interpre-
tations and analyses.
The data-visualization tools of SensorGIS support
charts and interactive tables that enable users to see an
overviewof observations of interest. Users can access
historical data and statistics, and they can also reg-
ister to receive notifications when values cross user-
defined thresholds. Finally, users can record their ob-
servations and interpretations of the data in a forum
so that a whole community can collaborate.
2 RELATED WORK
WSNs have applications in a variety of areas, such as
environmental monitoring and healthcare. This tech-
nology also brings forth challenges in visualizing and
interpreting information, which have given rise to a
variety of sensor-network visualization systems.
SensorMap (Nath et al., 2007)is a real-time WSN
visualization web service developed by Microsoft. Its
disadvantages include its limited (or missing) sup-
port for (a) alerting users when measured values cross
user-defined thresholds, (b) aggregating data retrieved
from multiple sensors, (c) analyzing data within the
web-based environment, and (d) facilitating the an-
notation of observations or trends deduced from the
data.
Viewlon (Furuyama et al., 2007), unlike Sen-
sorMap, is not a web service and displays sensor re-
lationships such as masters and sinks alongside the
correlation of their sensed data. It visualizes WSNs
as graphs, which makes it difficult to visualize sen-
sors geographically, and not all WSNs form explicit
and stable graphs (Gburzynski and Olesinski, 2008).
MoteView (Turon, 2005), similar to Viewlon, is
not a web service, and its graphical user interface
(GUI) runs on the client side. Similar to Viewlon, it
199
Huang J., M. Boers N., Stroulia E., Gburzynski P. and Nikolaidis I.
SensorGIS - An Integrated Architecture for Information Systems based on Sensor Networks.
DOI: 10.5220/0002798301990202
In Proceedings of the 6th International Conference on Web Information Systems and Technology (WEBIST 2010), page
ISBN: 978-989-674-025-2
Copyright
c
2010 by SCITEPRESS – Science and Technology Publications, Lda. All rights reserved

represents sensor distribution as a graph and depends
on specific sensor-network hardware.
Other tools include SNAMP (Yang et al., 2006),
SpyGlass (Buschmann et al., 2005), GIS for ground-
water surveillance (Lawerence et al., 2003), and
SeeMote (Selavo et al., 2006). SNAMP is a desk-
top application without a GIS, and SpyGlass does
not have an extendible database schema for data rep-
resentation. The GIS for groundwater surveillance
is designed to fit a particular WSN and, similar to
SeeMote, visualizes the WSN as a graph.
3 THE ARCHITECTURE
SensorGIS follows four software-design principles:
1. separation of data representation from user-
centric data renderings,
2. adoption of XML as the data-exchange format be-
tween data resources and the user-centric data ren-
derings,
3. independence of database schema design from
the sensor-network deployment and configura-
tion, and
4. use of an efficient API to extract relevant data
views from the data resource.
It consists of several key components. End-users
access the user interface component that contains
three parts: the multi-layered map, the data-analysis
panel, and the collaboration forum. The second com-
ponent, the data layer, resides in the background and
stores the data received from the network and serves
as the source for visualizations and analyses. The fi-
nal AJAX component glues the above two components
and uses representational state transfer (REST) and an
appropriate XML schema to integrate the user inter-
face with the data layer.
3.1 The User Interface
One of the fundamental innovations of SensorGIS is
its design that integrates the collecting, archiving, an-
alyzing, and visualizing of sensor-network data. The
web-based user interface allows access to the Sensor-
GIS services from multiple locations using different
types of devices and integrates multiple synchronized
views. In the following subsections, we discuss the
three key parts of the SensorGIS web interface and
explain their features.
3.1.1 The Multi-layered Map
SensorGIS builds on the OpenLayers JavaScript li-
brary for its multi-layered map. The base map can be
a user-supplied image or a map from Google, Yahoo,
or NASA. The library supports importing geographic
data from GeoServer, which is a spatial database de-
signed for geographic data storage and retrieval, and
can display the data as overlays. It also supports a
variety of other data sources.
The SensorGIS map shows sensor nodes as mark-
ers pinned at the node locations. If the network con-
tains mobile nodes, the map view may periodically
refresh to reflect changing locations.
SensorGIS can be used to monitor both individual
sensor states and sensor group states. When the user
selects a node marker, a pop-up displays the most re-
cent state values. Users can define sensor groups by
selecting (a) all sensors within a geographic area of
interest or (b) individual node markers.
In addition to sensor and sensor-group queries,
SensorGIS also supports a “watch” functionality to
monitor nodes for extreme values. When enabled,
the map shows sensors with state values outside user-
defined ranges.
The SensorGIS map also allows users to manage
the topology of the deployed WSN. Users can create
new markers on the map for newly deployed nodes
and manually change the location of current sensors.
3.1.2 The Data-analysis Panel
The top-right corner of the interface embeds the data-
analysis panel (Figure 1, top-right). The content of
this panel changes according to user selections made
in the multi-layered map. If the user selects a single
node, it shows either (a) the most recent observations
of the node or (b) its historicaldata as a scalable graph
(we use the flotr JavaScript plotting library).
The data-analysis panel also supports a number
of predefined queries for groups of nodes. The ini-
tial view contains the latest readings of each sensor
at each node. A second view shows summary statis-
tics for a single sensor type for a given period at each
node. Finally, the third view extends the second to
multiple sensor types, and furthermore, it summarizes
them for all nodes in the group. To relate sensor
groups with their geographic location, the map view
labels the sensor group markers with numbers corre-
sponding to table rows in the data-analysis panel.
Besides history graphs and grouping tables, users
can also see any enabled watch function’s status in the
panel.
WEBIST 2010 - 6th International Conference on Web Information Systems and Technologies
200
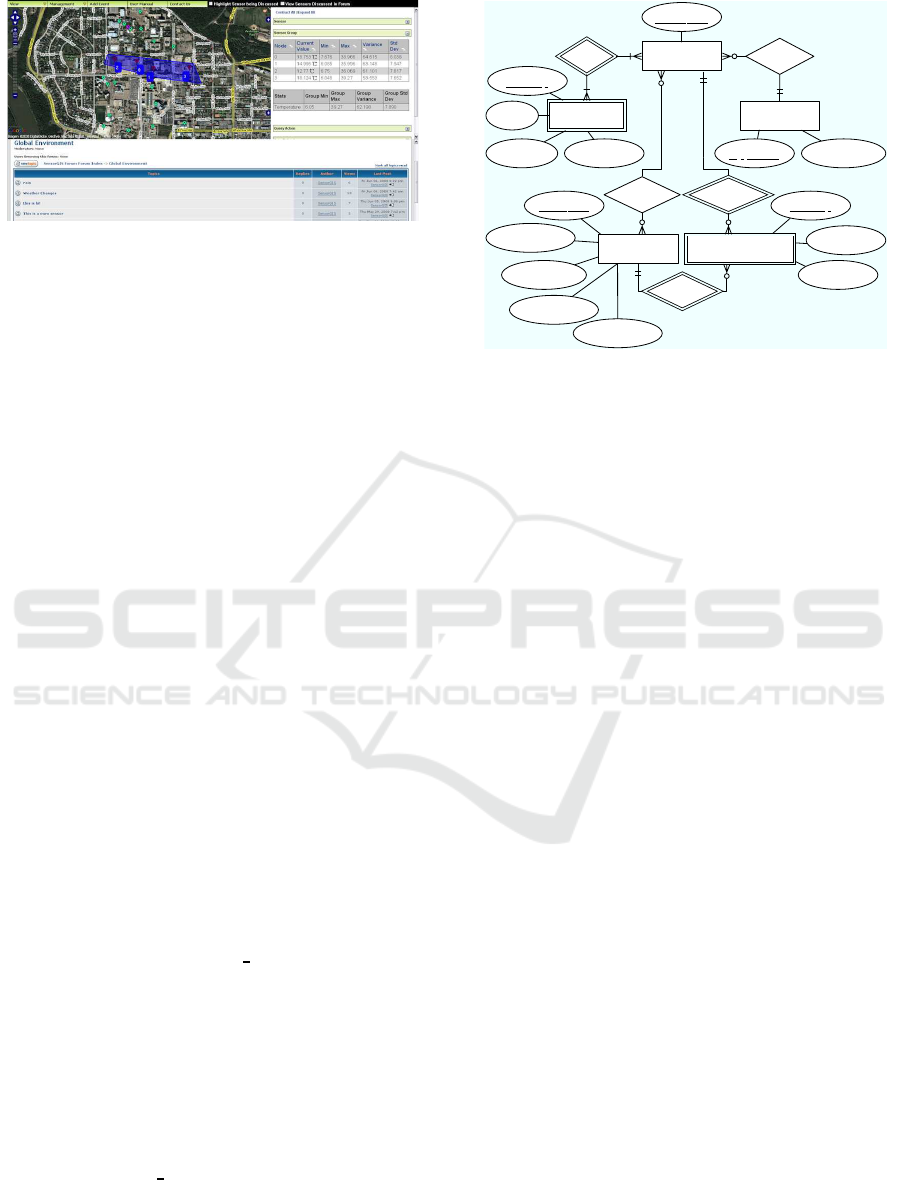
Figure 1: The SensorGIS interface with the multi-layered
map in the top-left, the data-analysis panel in the top-right,
and forum in the bottom of the window.
3.1.3 The Collaboration Forum
The integration of a forum (phpBB) is a powerful fea-
ture of SensorGIS (Figure 1, bottom). Unlike typical
forums that simply sequentially sort postings, our in-
tegration associates postings with the source sensor.
When a user observes something within the WSN
data, he can add a topic to the forum. The forum entry
and the selected sensor(s) are then cross-referenced in
the server. Consequently, when another user exam-
ines the particular sensor(s), the software highlights
the appropriate forum entry. Conversely, users read-
ing a particular entry in the forum see the correspond-
ing sensor(s) highlighted on the map.
A type of summary view is also available to vi-
sualize the amount of forum attention given to each
sensor. After enabling this overlay, coloured markers
on the map appear next to each annotated sensor, and
the marker’s colour indicates the number of related
forum entries.
3.2 The Data Layer
To support the described user interface, the collected
sensor data is stored in (and retrieved from) a MySQL
database. Figure 2 shows its entity/relationship dia-
gram. It contains five entities:
NODE, with attribute Node ID, lists the wireless
nodes in the network.
LOCATION, with attributes for the longitude, lati-
tude, altitude, and a time-stamp, associates wire-
less nodes with their physical locations. We in-
clude time-stamps to support mobile nodes.
STATE lists all of the possible states that a sensor
may observe.
OBSERVATION contains the actual state measure-
ments. The Is User attribute indicates whether
a SensorGIS user (rather than the network)
recorded the observation.
NODE
has
ROLE
Type_ID Type_Desc
observes
STATE
Tstamp
Value
Is_User
Range_Min
Range_Max
State_Desc
State_Name
State_ID
Tstamp
X
Y Z
Node_ID
LOCATION
OBSERVATION
has
generates
observes
Figure 2: The database schema showing the relationship be-
tween tables and attributes.
ROLElists the possible functions a node may take on
in the network (e.g., sensor, sink, or master). At
any given moment, each node is associated with
one of these roles.
3.3 User-interface/Database Integration
To produce the user interface, server-sidePHP scripts:
1. process HTTP POST requests from the client to
extract arguments for database queries,
2. invoke relevant database queries on our MySQL
database, and
3. construct an XML document containing the rele-
vant data in response to the client-issued request.
Before sending the XML document to the client, the
server validates it against the XML schema.
Two distinct styles exist for implementing web-
based service-oriented applications: the ws* style and
the REST style. Given the relative immaturity of
the sensor-network technologies and applications, we
have chosen the simpler REST style, which builds
well on the set of core operations we have discussed
earlier in this section.
The server contains three modules:
1. The network maintenance module reflects the
WSN structure, manages all the raw data from the
network, and feeds the network states with read-
ings.
2. The network states module stores all readings re-
ceived from the network maintenance module.
When query requests unrelated to the forum ar-
rive, the network states module generates query
results and sends the results back in XML format.
SensorGIS - An Integrated Architecture for Information Systems based on Sensor Networks
201

3. Finally, the forum module is standalone and it
manages the forum database and provides data for
interaction between the multi-layer map and the
forum, again in XML format.
According to the REST style, the data exchanged
between server and client are represented in XML.
Inspired by SensorML, we develop a simpler three-
part XML schema to represent sensor-network data
and add in it the support of history and statistics. The
three parts are Operation, Sensor, and Statistics.
The Operation element defines the visualization
operation to be applied to the retrieved XML doc-
ument. In addition to the operation ID, a transac-
tion ID is also included in the element, to prevent the
client from performing redundant or wrong visualiza-
tion operations.
The Sensor element is used to represent all the in-
dividualsensor information, including history. A Sen-
sor tag has seven potential elements: sensorID, loca-
tion X, location Y, location Z, typeID, typeDesc, and
states. The first four elements are mandatory and cor-
respond to the database table LOCATION. The fourth
and fifth elements, typeID and typeDesc, are also re-
quired and correspond to the entity ROLE. The last
element, named states, is optional and corresponds to
the entities STATE and OBSERVATION. The states
tag may consist of multiple child tags if it is carrying
history data. According to the database query per-
formed, child tags will be appended adaptively to the
XML.
The third part of the schema is the Statistics ele-
ment, and it is for sensor group data including sum-
mary statistics. It has two child tags: Sensor List and
Observations. Sensor List records all the node IDs,
and Observations has multiple child tags that repre-
sent different group statistics retrieved from the OB-
SERVATION table in the database.
While the Operation element is mandatory, the
Sensor and Statistics elements are optional and mu-
tually exclusive. This exclusiveness results from each
XML response document only containing the result of
a single query. For example, an XML document con-
taining the current state values of a sensor does not
need to include the Statistics tag. Similarly, an XML
document including the statistics of a sensor does not
need the Sensor tag. Moreover, if an error occurs and
no sensor data can be returned, the XML document
will only include the Operation tag.
4 CONCLUSIONS
We described SensorGIS, an extendible service-
oriented architecture for managing and analyzing the
data collected by WSNs. SensorGIS aims to improve
productivity by providing a library of functions that
collect, archive, visualize, and analyze WSN data. We
have incorporated SensorGIS into two significantly
different WSNs: the Intelligent Mousetrap and the
Smart Condo, representing respectively an outdoor
and an indoor WSN. In the context of the first project,
we augmented traps, used by biologists to live-catch
small animals for study purposes, with switches and
a radio, and we visualized the network and the traps’
states within SensorGIS. Biologists can view the data
in SensorGIS, either in the field or via the Internet,
and then focus only on occupied traps. The inter-
ested reader can find more information about the latter
project at (Boers et al., 2009). Its integration with the
intelligent mousetrap and Smart Condo project pro-
vides strong support for its applicability to diverse
WSNs.
REFERENCES
Boers, N. M., Chodos, D., Huang, J., Stroulia, E., Gburzyn-
ski, P., and Nikolaidis, I. (2009). The Smart Condo:
Visualizing independent living environments in a vir-
tual world. In PervasiveHealth ’09: Proceedings from
the 3rd International Conference on Pervasive Com-
puting Technologies for Healthcare, London, UK.
Buschmann, C., Pfisterer, D., Fischer, S., Fekete, S. P., and
Kr¨oller, A. (2005). SpyGlass: a wireless sensor net-
work visualizer. SIGBED Rev., 2(1):1–6.
Furuyama, M., Mukai, J., and Imai, M. (2007). New
Frontiers in Artificial Intelligence, volume 4384 of
LNCS, chapter Viewlon: Visualizing Information on
Semantic Sensor Network, pages 65–76. Springer
Berlin/Heidelberg.
Gburzynski, P. and Olesinski, W. (2008). On a practical ap-
proach to low-cost ad hoc wireless networking. JTIT,
2008(1):29–42.
Lawerence, A., Varadhan, A., and Gadiparthi, S. (2003). A
GIS application for remote surveillance of groundwa-
ter contamination. In Proc. 2003 ESRI User Conf.
Nath, S., Liu, J., and Zhao, F. (2007). SensorMap for wide-
area sensor webs. Computer, 40(7):90–93.
Selavo, L., Zhou, G., and Stankovic, J. (2006). SeeMote:
In-situ visualization and logging device for wireless
sensor networks. In Proc. of the 3rd Int. Conf. on
Broadband Comm. Networks and Syst., pages 1–9.
Turon, M. (2005). MOTE-VIEW: a sensor network moni-
toring and management tool. In Proc. 2nd IEEE Work-
shop Embedded Networked Sensors, pages 11–17.
Yang, Y., Xia, P., Huang, L., Zhou, Q., Xu, Y., and Li,
X. (2006). SNAMP: A multi-sniffer and multi-view
visualization platform for wireless sensor networks:
A multi-sniffer and multi-view visualization platform
for wireless sensor networks. In Proc. 1st IEEE Conf.
on Industrial Electron. and Applications, pages 1–4.
WEBIST 2010 - 6th International Conference on Web Information Systems and Technologies
202
