
A NEW SUPPORT FOR OBJECTS CLASSIFICATION
IN MULTIMEDIA INFORMATION RETRIEVAL
Walter Balzano, Maria Rosaria Del Sorbo and Antonio Tarantino
Istituto Nazionale Fisica Nucleare, Università degli Studi di Napoli Federico II, via Cinthia, 4 – 80126, Napoli, Italy
Keywords: Metadata, Information Retrieval Systems, WordNet, Bag of Synset, Semantic Knowledge Representation,
Nearest Neighbour Index.
Abstract: Multimedia databases store huge amount of heterogeneous information, but the user’s queries usually search
for just very short sections of data hidden and mixed with each other. This work presents a support
methodology for Information Retrieval Systems on a collection of Multimedia Data Objects. The main idea
of this retrieval methodology exploits raw metadata information stored in multimedia objects to realize a
classification using an innovative approach, based on a spatial dispersion index. A convenient synthetic
representation of multimedia objects is drawn from the Lexical Database WordNet. It provides the system
with synonymic and polysemic Semantic Knowledge. With the aim to achieve an alternative segmentation
on document classes, a clustering algorithm based on the Nearest Neighbour geospatial index is finally used.
1 INTRODUCTION
Information searching is nowadays a topical issue in
the area of paper and electronic documents. This
problem worsens with new Web trends such as
remote information storing and sharing. Data access
is becoming more and more difficult in this
exponentially growing information amount.
Many retrieval systems have been recently
projected to support new tools and strategies,
improving multimedia information access
performance and potentiality; very representative
instances of this new approach methodologies are
the Image Information Retrieval Systems like QBIC
(wwwqbic.almaden.ibm.com/, IBM’s Query By
IMAGE Content,), SIPLIcity
(wang14.ist.psu.edu/cgi-bin/zwang/regionsearch_
show.cgi, Semantic-sensitive Integrated Matching
for Pictures Libraries) (Jia, J. et al., 2003, Wang, J. Z
et al., 2001) and CIRES (cires.matthewriley.com/,
Content based Image Retrieval System). Even if the
mentioned above systems represent a considerable
effort to improve the information retrieval quality,
they are still inaccurate and insufficient to agree user
satisfaction. For these reasons the most popular
search engines, as Google, are basically text-based
and use complicated text manipulations to
implement retrieval strategies. It is straightforward
to note that in the World Wide Web the main part of
methodologies for information grabbing in
multimedia objects is based on text analysis
enveloping searched objects. In particular the search
in web pages can be driven by basic and raw textual
object information, like the file name and/or the text
following or preceding the object itself. This method
presents some problems, because file names may not
be always correlated to real object meaning and,
accordingly, the search engine retrieves objects not
relevant to user’s query.
This work proposes a new classification
criterion: the idea is to try pricking the object shell
to collect text data from object metadata layer and
then to estimate objects’ similarity using iteratively a
spatial dispersion index based on the minimum of
the inter-feature distances.
Figure 1 shows a schematic representation of a
search engine. Some off-line processes, such as
documents elaboration and representation are
executed independently of on-line processes, such as
query representation. The meeting point of the two
different processes is the similarity comparison. It
generates the retrieval and ranking of the documents,
matching the query as much as possible.
226
Balzano W., Rosaria Del Sorbo M. and Tarantino A.
A NEW SUPPORT FOR OBJECTS CLASSIFICATION IN MULTIMEDIA INFORMATION RETRIEVAL.
DOI: 10.5220/0002809902260233
In Proceedings of the 6th International Conference on Web Information Systems and Technology (WEBIST 2010), page
ISBN: 978-989-674-025-2
Copyright
c
2010 by SCITEPRESS – Science and Technology Publications, Lda. All rights reserved

Off-line processing
Documents
Query
Processing
Processing
Comparison
(similarity calculation)
Retrieved
and Ranked
Doc ument s
Query
Representation
Document
Representation
Figure 1: Search engine classic scheme.
2 INSIDE MULTIMEDIA OBJECT
One of the most important approaches of the current
search engines in data grabbing tasks, is based on
data objects skin-deep scanning. The results are in
many cases poor, as they can be measurable by
Precision and Recall parameters.
Figure 2 shows a standard scheme of a generic
multimedia object. The object can be split in two
main different layers: the outer visible data layer and
the inner metadata layer. The metadata information
in the inner layer is very heterogeneous and spread
on a wide range of multimedia objects.
inner invisible layer
raw data
Metadata
outer visible layer
Classi cal Search Engine
Crawler's bite
New Search Engine
Crawler's bite
Object
Figure 2: Standard structure scheme of a multimedia
object and crawler’s bite.
A popular example of this metadata is ID3 tags in
the metadata layer of MP3 standard files
(www.id3.org). The ID3 tag contains many
information like the name of the author, the actual
name of the song (not necessarily matching the file
name!), the year, the genre, and so on. Then the
players or various applications can exploit this
information to manage the individual object or, in
many cases, complex objects collections. Likewise,
for some pictures file formats, it is possible to
manage the Exif metadata record layer
(www.exif.org) adopted by main digital cameras
systems. In Exif metadata layer can be stored many
other additional raw information as the technical
parameters setting: date, location by an integrated
GPS system, exposition time, white balancing, flash
and so on. Subsequently, different applications can
elaborate the Exif information to perform many
actions: to rotate a picture or to insert the date of the
shot in a clustering process or to use the white
balancing to apply some adjustment filter.
Nowadays the whole part of multimedia files is
equipped with additional information, termed “raw”
by their shortness and rather low level appearance;
this information is well enclosed in the kernel of the
file containing data objects. This work, combining
standard methods and new approaches, is aimed to
rip and manage data included in this raw information
layer. It’s remarkable that currently in the electronic
devices to fill the raw metadata layer are exploited
frequently automatic or partially automated and less
commonly hand-operated processes. However, even
in the fully automatic case, complex technologies
and new methodologies are employed to process
information with an increasingly important
significance level.
As a sufficiently pregnant example of this mix of
technologies and methodologies, mp3 audio file
meta information can be mentioned. A growing
amount of application software, such as players and
rippers, acquire accessory information directly by
one or more databases, for instance Winamp CDDB
(www.gracenote.com), FreeDB (www.freedb.org),
MusicBrainz (musicbrainz.org), Microsoft
Metaservices; next these accessory data can be
stored in the audio file meta-information layer. The
filling procedure is often completely hidden to the
user and meta-information itself constitutes an
increasingly relevant part of the information.
In any case, we point out that, in fact, up to now
there’s no fully automatic mechanism to produce a
complete metadata set. For an instance a big part of
the information content of a generic photographic
images gallery has to be edited directly by the users
in the Exif layer of the pictures. Therefore, even if
raw data may be incomplete and fragmented and
often have a low level look, it can be helpful to
consider a mechanism to evaluate the potential of
this metadata layer information, however small it
may be.
3 MODEL ARCHITECTURE
The project is therefore conceived to organize the
data extracted from the raw metadata layer, using a
double filter. The first stage grabs objects data by a
ripping function producing raw metadata. The
A NEW SUPPORT FOR OBJECTS CLASSIFICATION IN MULTIMEDIA INFORMATION RETRIEVAL
227
second stage summarizes the metadata extracted,
represents them by terms and abstracts a significance
representation. Finally, using a methodology
borrowed from the GIS, the filtered data are
submitted to a further analysis to gauge their
agglomeration and consistency level.
In summary, the basic idea of the whole project
is schematized in the four blocks of Figure 3:
Ripping, Bag of Words, Bag of Synsets and
Clustering and NNI analysis, described in more
detail later.
Objects
Raw
Metadata
Terms
Representation
Significance
Representation
Ripping
Bag of Words Bag of Synsets
Cluster ing
and NNI Analysis
Refined Clusters
Figure 3: Clusters database building: knowledge extraction
and analysis.
In the ripping stage it should be noted that the
organization and structuring of the data belonging to
the layer of raw metadata objects are neither
standard nor homogeneous. The Exif field of jpg
graphic format does not match the ID3 of mp3 audio
format, the exposure_time of a jpg hasn’t strong
correspondence with any of the metadata fields of a
pdf document and so on.
Conversely the following analysis and filtering
steps are characterized by the "quantization" of
information extracted in the preceding step. All the
terms previously obtained are in fact categorized
with a finite number of terms. Then these terms are
further "quantized" in categories so reducing the
number of final elements to be treated.
The last phase is the clustering. It assesses the
goodness and meaningfulness of the clusters
obtained, using an index of dispersion as the Nearest
Neighbour Index, NNI, in order to determine the
uniformity in spacing, by comparing the actual
pattern with a theoretical random pattern.
The operation sequence corresponding to the
scheme shown above can be traditionally split in two
steps: the first one, an offline stage, in which
documents are created, indexed and grouped. The
second one, an online step, in which a search engine
retrieves the documents matching a specific query.
3.1 Objects Ripping
The knowledge extraction process works on
information included in multimedia objects metadata
layer: in order to accomplish this task many free
tools can be exploited, like libextractor
(gnunet.org/libextractor/) and VersyPdf
(www.sybrex.com/products/development/versypdf/).
Libextractor represents a fine library for metadata
extraction of arbitrary type: it is organised to employ
helper-libraries to perform the actual extraction. It
can be possible to extend Libextractor trivially by
linking against external extractors for additional file
types.
Among the supported formats we mention html,
pdf, doc, xls, ppt, OpenOffice, dvi, mp3, wav, jpeg,
gif, png, tiff, deb, rpm, tar(.gz), zip, flv, riff (avi),
mpeg, qt and asf.
VersyPdf is a high-quality specialized pdf API
library, projected to work in many programming
languages; VersyPdf libraries are useful to write
stand-alone, cross-platform and reliable commercial
applications that can manage the metadata hidden in
pdf documents. It’s remarkable the necessity of a
modular development of extraction libraries. A good
library must be upgradable by new plugins (classes)
as soon as latest file formats are released. As already
discussed in section 2, metadata extraction is always
performed by ad hoc plugins, because a specific
metadata structure corresponds to each file format.
Therefore it isn’t possible to conceive a general
purpose extraction library, totally independent from
the particular file format.
1..*
DOC PDF
+getAuthor(pathFile: String): String
+getKeywords(p athFile: Stri ng): String
JP G
MetadataExtractor
+get Description(pa thFil e: String):Stri ng
+getText(pathFileInput: String, pathFileOutput: Stri ng): Boolean
MP3
Format
+getDescription(pathFile:String):String
+convert Text(pathFileInput: String, pathFileOutput: Stri ng): Boolean
+getFormat(): String
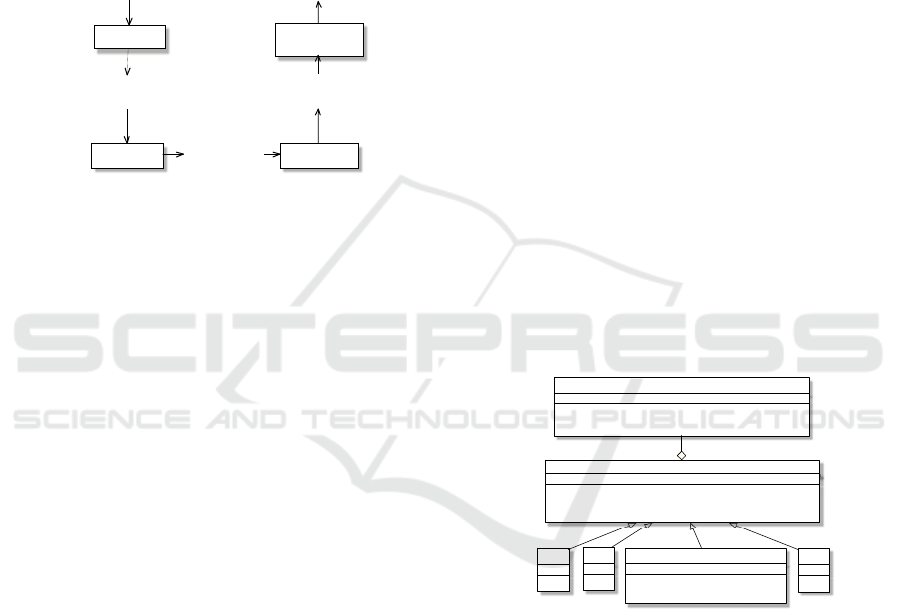
Figure 4: Metadata extraction of classes’ package scheme.
As shown in the Figure 4, MetadataExtractor and
Format are the main classes of the ripping module.
The methods of abstract class Format are
implemented in different classes, depending on the
specific file format containing metadata object: an
extension is required to achieve metadata extraction
from files not yet default supported by Format class.
MetadataExtractor class is the union of the instances
of the Format class. When Format class is invoked,
first plugins enclosed in FormatClass package are
loaded. In particular, the getDescription() method of
the MetadataExtractor class, inputs the path of the
WEBIST 2010 - 6th International Conference on Web Information Systems and Technologies
228

target multimedia object and outputs the required
metadata.
Plugin loading mechanism has been
implemented using the php _autoload() function:
function __autoload($class_name)
{
require_once $_SERVER[‘DOCUMENT_ROOT’] .
“/LIB/MetadataExtractorPackage/FormatsClass/“ .
$class_name . ‘.php’;
}
The execution of the code above allows the dynamic
fetching of plugins modules, correspondent to
processing known data types. This structure also
allows to easily introduce new plugins to deal with
new file format not yet released or defined.
3.2 Database Building
After the metadata ripping from multimedia objects,
a set of rules must be defined to determine which are
the elements relevant to the query using a vectorial
model from information retrieval methodologies
(Blanken H. M. et al., 2007). Each document is
represented in the term space, i. e. the set of all the
index terms found in the collection. A set of n
documents D = {d
1
, d
2
, …, d
n
}, containing m index
terms can be represented by n document vectors d
j
=
(w
j1
, w
j2
, …, w
jm
), where w
ji
is the weight of the term
t
i
in the document d
j
.
To improve the system performance, some
adjustments based on WordNet lexical database
(ccl.pku.edu.cn/doubtfire/Semantics/WordNet/Manu
al.html, wordnet.princeton.edu) have been
introduced to vectorial model.
3.2.1 WordNet-based Dictionary
The WordNet choice has been suggested by its
intrinsic organization, inspired by the psycho-
linguistic contemporary theories on human lexical
memory. The WordNet items are disposed by
significance instead by alphabetical criterion and are
divided in four syntactic categories: nouns, verbs,
adjectives and adverbs, grouped into sets of
cognitive synonyms (synsets), each expressing a
different concept. Synsets are correlated by
conceptual-semantic and lexical associations. It’s
important to note that each term can belong to more
than one synset and syntactic category.
WordNet lexical database can work fine to achieve a
multimedia object representation: dictionary terms
can play the role of the features to characterize every
multimedia object
Table 1: Conversion from Bag of Word to Bag of Synsets
example.
BAG OF WORD BAG OF SYNSET
FILE 1
query –
computer – apple
07094985 – 09741298
– 07633436
FILE 2
fruit – apple –
pear
12965125 – 07633436
– 07662144
FILE 3
interrogation –
calculator
07180731, 07095347,
07094985 – 09741298
In particular the objects metadata can be described
using a Bag of Words representation (Jurafsky D. et
al., 2000): the retrieving process consists simply in
the checking the bag of word collection for the
presence of the terms representing the multimedia
objects.
WordNet lexical database performs a semantic
function: the retrieving process must also take into
account the relationships between the terms, because
each word can’t be considered independent of the
others. The words’ semantic establishes a link
between them: for an instance the terms “Basset
Hound” and “Collie” are semantically linked
because both are “Dogs”, but the terms “Glasses”
and “Speed” haven’t any patent semantic links.
The mapping of the terms into their meanings
can be performed by WordNet synsets: the transition
from the Bag of Words to a Bag of Synsets allows
coding important speech knowledge, otherwise
hidden.
File 3
File 1
File 2
pear
12965125
07662144
apple
07633436
query
07094985
computer
09741298
apple
fruit
07180731
interrogation
calculator
07095347
Figure 5: Bag of Synset with database locator numbers.
The clustering algorithm takes an outstanding
advance by the introduction of a Bag of Synsets; it is
therefore straightforward the resolution of the
synonymy and polysemy issues: even the synonymic
terms are associated in the retrieving process. We
stress that the meanings are much more than the
terms, so the words’ mapping into the synsets
increases representation dimension and complexity.
The complexity idea is depicted in the example
above. The relation graph corresponding to the data
of Table 1 highlights the connection relations
A NEW SUPPORT FOR OBJECTS CLASSIFICATION IN MULTIMEDIA INFORMATION RETRIEVAL
229

established when the Bag of Synsets is introduced:
the files and their ripped metadata terms are shown
and they are linked to the corresponding meaning
codes. FILE1 and FILE3 wouldn’t be connected in a
Bag of Words representation, because they don’t
share any term, while a link between
FILE1 and
FILE2 would subsist, which don’t have in fact a real
relatedness; conversely, from a Bag of Synsets point
of view, some relations between
FILE1 and FILE3
exist and are stronger than the one between FILE1
and FILE2. This behaviour is more likelihood for a
correct model of the relations between objects. The
numeric codes describing the words’ meaning inside
the circles in Figure 5 are the Database Locations
updated to WordNet 3.0.
3.2.2 Terms Weighting
Two different methods have been used to weight so
the documents’ terms as the query’s terms: the first
ones are evaluated offline, while the second ones are
processed in real time with the aim to better collate
and rank the documents retrieved after a specific
query. Now we’ll first detail the documents’ terms
weighting method.
Once obtained a semantic representation of
multimedia objects as a string of digits standing for
their meaning, our further elaboration needs a
measurable index of the terms. The idea is to exploit
tf-idf, Term Frequency – Inverse Document
Frequency, (Salton et al., 1983), one of the most
robust and confirmed weighting systems for textual
analysis. The terms weight is calculated using the
following expression:
,
,
,
*log
max
ij
ij
llj i
freq
N
wtfidf
f
req n
==
(3.1)
where w
i,j
is the weight of the i-th term in the j-th
document, freq
i,j
is the i-th term frequency of in j-th
document, max
l
freq
l,j
is the number of occurrences
of the most frequent term in the j-th document, N is
the total number of documents in the collection and
n
i
is the number of documents containing the i-th
term.
We propose a revision to the algorithm above,
because in a Bag of Synsets each term in documents’
representation may be mapped in more than one
synset. We consider suitable to attribute heavier
weights to the terms with a lower number of
meanings, because their significance is considered
stronger than the significance of the terms with
many meanings. Therefore w
i,j
is related to the
number of its corresponding synsets.
As mentioned previously, a query’s weighting is
also necessary. It’d be acceptable the expression
suggested in (Salton, G. et al., 1988):
,
,
,
0.5*
0.5 *log
max
iq
iq
llq i
freq
N
w
f
req n
⎛⎞
=+
⎜⎟
⎜⎟
⎝⎠
(3.2)
where w
i,q
is the weight of the i-th term contained in
the query q, N is the number of the documents in the
collection and n
i
is the number of documents
containing i-th term. In this case we propose an
extension to the algorithm above, introducing a
correction factor F, justified by some experimental
observations and by the need of a better ranking of
system response. The terms’ order of a query is
often correspondent to the relevance assigned to
them so, to improve the ranking algorithm, we
introduce in (3.2) a factor
()
1
1
+
−
=
i
i
p
pc
F
, where p
i
is the position of the i-th term in the query and
c
[
]
1,0
∈
is a constant expressing the position
emphasis. Then, the weight
w
i,q
calculated in (3.2)
can be so updated:
'
,,
*
iq iq
wFw=
(3.3)
It’s easy to note that, if
c=0 then F=1 and
'
,,iq iq
ww= so the query’s weight is independent from
the term’s position; if
c=1 then
i
p
F
1
=
and
'
,,
1
*
iq iq
i
ww
p
= , so the query’s weight has an inverse
proportionality to the term’s position. A value
c=0.7
can be well-balanced to take into account of the
order of the terms in a query.
3.3 Clustering
A practical and ordinary method to reduce the
research complexity is to cluster database items in
many subsets, each represented by its centroid, on
which the preliminary research can be focused. In
this work
k-means partitional clustering technique
has been exploited (do Prado H. A., et al., 2008).
K-means (Mac Queen J.B., 1967) is a simple
unsupervised learning algorithm aimed to classify a
given data set through a fixed number of clusters.
This algorithm tries to minimize an objective
squared function:
()
2
11
∑∑
==
−=
k
j
n
i
j
j
i
cxJ
WEBIST 2010 - 6th International Conference on Web Information Systems and Technologies
230

where
()
2
j
j
i
cx −
is a distance measure between a
data points
()
j
i
x and the cluster centroids c
j
. Even if
it can be demonstrated that this procedure will
always end, the
k-means algorithm does not
necessarily locate the most optimal configuration.
The algorithm is also sensitive to the initial arbitrary
centroids. The
k-means algorithm can be run
multiple times to decrease this effect.
Beside
k-means algorithm, an analysis has been
performed based on
Nearest Neighbour Index, a
geospatial indicator borrowed by the Geographical
Information Systems tools. Further details and
references about NN algorithm can be found in the
section 3.4.
Here is a more detailed description of the
operating sequence of the classification algorithm.
After the computation of the terms’ and query’s
weights, the idea is to begin the process grouping
the data in a single omni-comprehensive set, labelled
as “crude”. This set is submitted to a Nearest
Neighbour algorithm to evaluate its aggregation
character. If the Nearest Neighbour Index doesn’t
exceed a prefixed threshold value, then the set is
marked “refined”, meaning that the data belonging
to this set are sufficiently clusterized, and the
elaboration stops. Otherwise, if the index outputed
by Nearest Neighbour algorithm is greater than the
fixed threshold, then the set becomes “crude” and
the
k-means algorithm is run with k=2. In this way
the original set is considered non sufficiently
clustered, it is divided into a couple of subsets with
distinct centroids and then the NN algorithm is
applied again to each of them. The subsets matching
the “clustering” condition are considered “refined”
and therefore no more processable. Conversely, the
subset not clustered are considered “crude” and then
at every step the
k-means algorithm with k=2 is
iteratively applied to each of this subsets. The
algorithm ends when the set of “crude” subsets is
empty. Finally, the resulting sets are considered
“clustered” and all the data can be represented by
their respective centroids, considerably improving
the searching efficiency.
The most important steps of process, described
above, are highlighted and synthetically depicted in
the flow chart in the following Figure 6.
In documents retrieving we deal with features
vectors, created starting from Bag of Synsets so that
the space considered is in fact a vector space and the
distances are actually inter-feature distances (Chou
G., 1997). Therefore, the retrieving is based on the
computation of the distances between adjacent point
features. In addition to this specification, in general
a similarity comparison claims similarity measures
(Kogan J., 2006).
NN Analysis
on each CRUDE set
CRUDE
sets
upgrade
End
Data set -> CRUDE set
NNI < Threshold
No
K-Means (k=2)
on each CRUDE set
REFINED
Clusters sets
upgrade
Yes
CRUDE
sets = = ø
NoYes
Figure 6: Classification algorithm flow chart.
3.4 Nearest Neighbour Analysis
Nearest Neighbour analysis considers the distances
between points and their closest neighbours. It is a
method of exploring pattern in data by a graphical
comparison with patterns theoretically expectable of
various hypothesized distributions, in particular
spatial randomness (Upton G. J. G. et al., 1985).
In order to simplify this measure of spacing here
will be made the hypothesis of populations on plane
surfaces. It is introduced a measure of the mode and
degree to which the distribution of individuals in a
population on a given area diverges from that of a
random distribution. The distance
A
d
from an
individual to its nearest neighbour is the base of this
measure and
E
d
, the mean distance to the nearest
neighbour that would be expected if the individuals
of that population were randomly distributed, is also
calculated (Fotheringham A.S. et al., 1994).
The Nearest Neighbour Index
(NNI) (Clark P. J.
et al, 1954) measures the degree of spatial
dispersion in a points distribution, based on the
distances between adjacent points: the effective
distances are compared to theoretical models of
spatial distributions (Boffi, M., 2008).
NNI index is calculated as the ratio between the
observed mean distance and the expected mean
distance: it is in fact a measure of departure from
randomness. If
N is the number of points, A is the
area of the considered region and
d
i
is the distance
from a given individual to its nearest neighbour, this
relation can be synthesized in the following
expression:
d
d
E
A
NNI =
where
N
d
A
N
i
i
d
∑
=
=
1
and
N
A
Ed *5.0=
A NEW SUPPORT FOR OBJECTS CLASSIFICATION IN MULTIMEDIA INFORMATION RETRIEVAL
231
If NNI > 1 the spatial distribution is considered
uniform. If
NNI ≈ 1 the spatial distribution is
considered random. If
NNI < 1 the spatial
distribution is considered clustered.
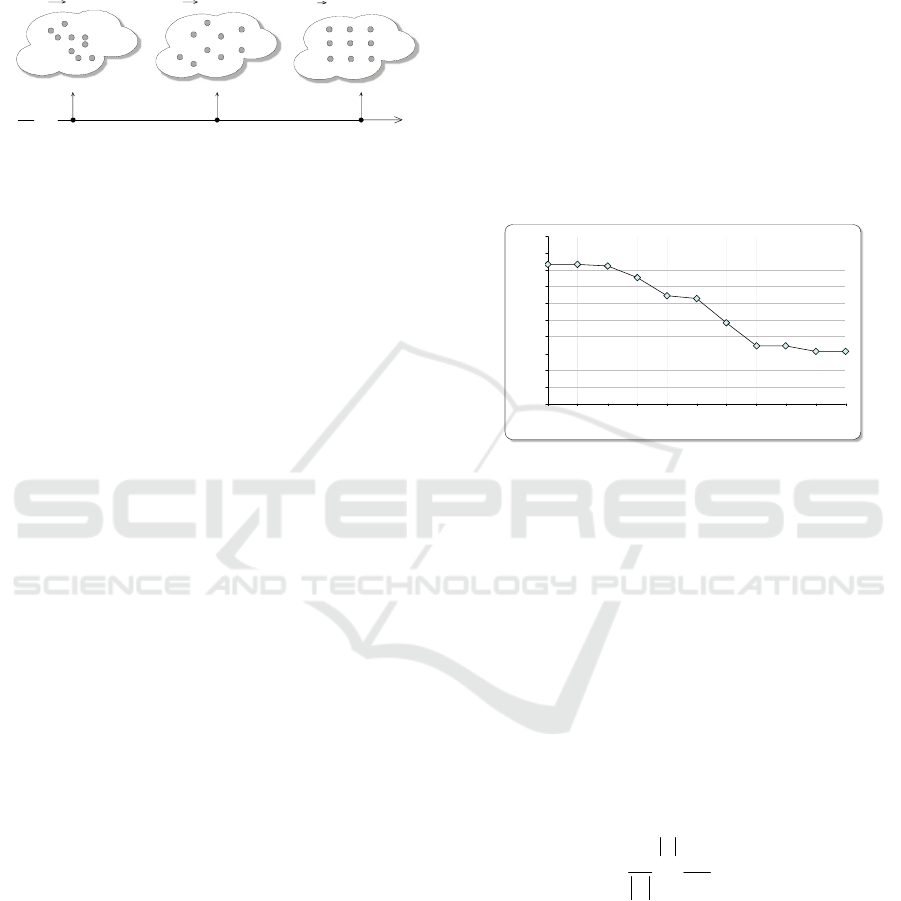
NNI
0 (Cluster)
NNI
1 (Random)
NNI
2.14 (Uniform)
NNI
0
1
2.1491
Figure 7: Theoretical models of points spatial distribution.
In our application NNI is calculated on features
vectors so as the features distances stand for spatial
distances and a threshold value 0.5 is employed to
detect the case of clustered data.
4 CASE STUDY
The elements needed to test the presented
Information Retrieval model effectiveness are a) a
proper multimedia collection, on which perform the
testing phase; b) a performance assessment tool set,
by which compare and evaluate the retrieving
system responses.
As a copious multimedia test collection our
choice has fallen on a revised version of the popular
Glasgow IDIOM Cranfield collection
(
ir.dcs.gla.ac.uk/resources/test_collections/cran/), formed
by 1,400 documents that deal with topics of
aerodynamics, 225 built-in queries with the
respective expected answers. This document
collection is constituted by only text files;
consequently it has been necessary for our testing
purposes, essentially oriented to multimedia
analysis, to enhance Cranfield collection with
multimedia items, inclusive of a layer of raw
metadata, as discussed in the preceding sections.
The well-known parameters Precision and Recall
used in IR systems have been used as assessment
tools over unordered sets of documents (Blanken H.
M., 2007). Precision-recall curves present a peculiar
saw-tooth shape: if the document retrieved isn’t
relevant then the Recall is the same, but Precision
has gone down. If it is relevant, then both Precision
and Recall increase, and the curve increases up and
to the right. It may be often better to eliminate these
irregularities and the standard way to do this is with
an interpolated precision: the interpolated precision
at a certain recall level is defined as the highest
precision found for any upcoming greater or equal
recall level.
An exploration of the precision-recall curve is
very instructive, but there is often a need to boil this
information down to a few point number. The usual
method of doing this is the 11
-point interpolated
average precision
. The interpolated precision is
measured at the 11 recall levels of 0.0, 0.1, 0.2, 1.0;
for each recall level, the arithmetic mean of the
interpolated precision at that recall level is
calculated for each query in the test collection. A
precision-recall diagram showing 11-points
interpolated average precision can then be graphed
on the base of the data collected in our experiment.
Figure 8 shows this diagram:
8
3
,
1
3
%
8
2
,
1
3
%
7
5
,
3
0
%
6
4
,
5
7
%
6
2
,
7
6
%
4
8
,
2
0
%
3
4
,
5
3
%
3
4
,
5
4
%
3
1
,
2
0
%
3
1
,
2
0
%
8
3
,
1
3
%
0%
10%
20%
30%
40%
50%
60%
70%
80%
90%
100%
0% 10% 20% 30% 40% 50% 60% 70% 80% 90% 100%
Recall
Precision
Figure 8: Precision-Recall diagram relating case study
experimental data.
Mean Average Precision (MAP) provides a measure
of quality across recall levels. Among evaluation
measures, MAP has been proved to have good
discrimination and stability. For a single query,
Average Precision is the average of the precision
value obtained for the set of
k top documents
existing after each relevant document is retrieved,
and this value is then averaged over queries number
Q. That is, if the set of relevant documents for a
query
q
j
∈ Q is
{
}
j
m
dd ,...,
1
and R
jk
is the set of
ranked retrieval results from the top until the
retrieval of document
d
k
, then:
MAP(Q)=
∑∑
==
j
m
k
jk
Q
j
j
Recision
mQ
11
)(Pr
11
(4.1)
The Precision-Recall graph of Figure 8 shows that
the range 0% -50% of Recall corresponds to high
Precision
values: in retrieving up to 50% of relevant
objects, there is a small presence of noise (i.e.
objects erroneously considered significant). From
50% forwards, the system undergoes a decrease in
terms of Precision performance: in an attempt to
recover further relevant objects, more items are
found not significant. This degradation widely
WEBIST 2010 - 6th International Conference on Web Information Systems and Technologies
232

depends by the fact that the queries submitted to the
system are expressed in natural language.
5 CONCLUSIONS
This work was aimed to create an information
retrieval system dedicated to the extraction of
multimedia objects from a collection. The system
performs the retrieval task, using a special spatial
index on multimedia objects metadata, considered as
feature vectors.
This approach allowed to overcome some of the
most common problems that afflict yet existing
retrieval systems, using a skin-deeper approach as
they do not generally "enter" into the object to
capture metadata. In the system development a
semantic representation has been proposed to better
define objects metadata with the support of the
WordNet lexical database, providing the machine
with knowledge, very helpful in particular to
manage the polysemy and synonymy issues. This
representation is suitable to improve the exploitation
of the relations between the synsets provided by
WordNet.
Finally, a clustering algorithm based on the well-
known
k-means has been proposed, trying to obtain
a partition of the collection as close as possible to
the optimum, using the dispersion indicator known
as Nearest Neighbour Index.
As a future development may be interesting to
project a metadata scheme aimed to find information
descriptor fields in multimedia files.
Secondly, in the transition from “Bag of Words”
to “Bag of Synsets” an exponential increasing of the
dictionary has been relieved, resulting in scalability
issues in testing IR system on Cranfield collection.
An upcoming analysis could be aimed to implement
a dictionary reduction strategy. In addition, the
semantic representation could be improved using the
numerous relation provided by WordNet.
Lastly, with reference to the assessment step, it
could be mandatory to extend the test to wider
collections and to compare the results to the yet
existing search engine outcomes.
REFERENCES
Barry, C.L., 1994. User-defined relevance criteria: An
exploratory study. Journal of the American Society for
Information Science 45, pp. 149–159.
Blanken H. M., de Vries A.P., Blok H. E., Feng L., 2007.
Multimedia Retrieval, Springer.
Boffi, M., 2008. Scienza dell'Informazione Geografica
(Introduzione ai GIS), Zanichelli. Bologna, 1
st
edition.
Chou, G., Teller S., 1997. Multi-Image Correspondence
Using Geometric and Structural Constraints,
Proc. Image Understanding Workshop, pp. 869-874.
Clark P. J., Evans F. C., 1954. Distance to nearest
neighbor as a measure of spatial relationship in
populations, Ecology, vol. 35.
Clark P. J., Evans F. C., 1979. Generalization of a Nearest
Neighbor Measure of Dispersion for Use in K
Dimensions, Ecology, vol. 60.
do Prado H.A., Ferneda E., 2008. Emerging Technologies
of Text Mining, Information Science Reference,
Hershey, PA.
Fotheringham A.S., Rogerson P.A., 1994. Spatial Analysis
and GIS. Taylor & Francis.
Jia, J., Wang, J. Z., 2003. Automatic linguistic indexing of
pictures by a statistical modelling approach. In IEEE
Transactions on Pattern Analysis and Machine
Intelligence, vol. 25, no. 9, pp. 1075-1088.
Jurafsky D., Martin J. H., 2000. Speech and Language
Processing. Prentice Hall.
Kogan J., Nicholas C., Teboulle M., 2006. Grouping
Multidimensional Data: Recent Advances In
Clustering. Springer.
Lu G., 1999. Multimedia Database Management Systems,
Artech House, Boston-London.
Mac Queen J. B., 1967.Some Methods for classification
and Analysis of Multivariate Observations,
Proceedings of 5-th Berkeley Symposium on
Mathematical Statistics and Probability, University of
California Press, Berkeley.
Salton, G., McGill M.J., 1983. Introduction to Modern
Information Retrieval. McGraw-Hill.
Salton, G., Buckley C., 1988. Term weighting approaches
in automatic text retrieval. In Information Processing
and Management, 24(5), 513-523.
Graham J. Upton, G. J., Fingelton B., 1985. Spatial Data
Analysis by Example. Volume 1: Point Pattern and
Quantitative Data. John Wiley & Sons, New York.
Thompson H. R., 1956. Distribution of distance to Nth in
a Population of Randomly Distributed Individuals,
Ecology, vol. 37.
Upton, G. J. G., Fingleton B., 1985. Spatial Data Analysis
by Example, Vol. 1. John Wiley, NY.
Van Rijsbergen, C.J., 1981. Information Retrieval, Dept.
of Computer Science, University of Glasgow.
Wang, J. Z., Jia, J., Wiederhold, G., 2001. SIMPLIcity:
Semantics-sensitive Integrated Matching for Picture
Libraries. In IEEE Transactions on Pattern Analysis
and Machine Intelligence, vol 23, no.9, pp. 947-963.
Wootton C., 2007. Developing Quality Metadata
, Focal
Press.
A NEW SUPPORT FOR OBJECTS CLASSIFICATION IN MULTIMEDIA INFORMATION RETRIEVAL
233
