
DISTRIBUTED VOLUME RENDERING FOR SCALABLE
HIGH-RESOLUTION DISPLAY ARRAYS
Nicholas Schwarz
Northwestern University, U.S.A.
Jason Leigh
Electronic Visualization Laboratory (EVL), University of Illinois at Chicago (UIC), U.S.A.
Keywords:
High-resolution display arrays, Direct volume rendering, Parallel rendering, Graphics systems and distributed
shared-memory.
Abstract:
This work presents a distributed image-order volume rendering approach for scalable high-resolution displays.
This approach preprocesses data into a conventional hierarchical structure which is distributed across the local
storage of a distributed-memory cluster. The cluster is equipped with graphics cards capable of hardware accel-
erated texture rendering. The novel contribution of this work is its unique data management scheme that spans
both GPU and CPU memory using a multi-level cache and distributed shared-memory system. Performance
results show that the system scales as output resolution and cluster size increase. An implementation of this
approach allows scientists to quasi-interactively visualize large volume datasets on scalable high-resolution
display arrays.
1 INTRODUCTION
The spatial resolution of data collected by scientific
instruments is increasing. Thus, the volume data
with which scientists work is increasing in size. For
example, bio-scientists use multi-photon microscopes
to image fluorescent structures deep in tissue at
unprecedented resolutions. Smaller image sections
collected from in situ or in vivo experiments group
together to form large image montages. Layers
of montages are stacked to form large volumes.
Although these volumes are shallow, useful insight
may be gained with free-form navigation and off-axis
projections.
Currently, scientists visualize such large datasets
on desktop displays that typically have only a few
million pixels. These displays constrain the way in
which scientists analyze spatially large volume data.
Scientists view either a low-resolution image that
represents the entire spatial extent of the data but
neglects detail, or small portions of the data in high-
resolution but loose spatial context.
Our experience shows that high-resolution
displays allow scientists to see their spatially large
data at or nearer its native resolution, and are
experiencing an increasing rate of adoption within
the scientific community. Most often, scalable
high-resolution displays are composed of an array
of liquid-crystal displays (LCDs) or projectors and a
commodity distributed-memory cluster of computers
with accelerated graphics hardware.
Scientists require a direct volume visualization
solution for commodity-off-the-shelf (COTS)
distributed-memory clusters that scales with respect
to large input data, i.e. data too large to conveniently
replicate across all processors, and produces high-
resolution output for high-resolution displays.
However, most parallel volume rendering research
concentrates on rendering large data at output
resolutions that are small in comparison to the
resolution provided by a high-resolution display
array. As shown in the next section, parallel volume
rendering research that specifically focuses on
producing high-resolution output employs data
replication, or requires the use of specialized
hardware.
This work presents a distributed image-order
volume rendering approach for scalable high-
resolution displays. It uses a unique multi-level
cache and distributed shared-memory system that
211
Schwarz N. and Leigh J. (2010).
DISTRIBUTED VOLUME RENDERING FOR SCALABLE HIGH-RESOLUTION DISPLAY ARRAYS.
In Proceedings of the International Conference on Computer Graphics Theory and Applications, pages 211-218
DOI: 10.5220/0002812902110218
Copyright
c
SciTePress

Table 1: Overview of direct volume rendering work in terms of output resolution and input data size.
†
Although
this architecture may potentially scale to support high-resolution display arrays, neither a theoretical nor a practical
implementation have shown the system’s ability to scale in terms of output resolution.
Data Size
Output Resolution
Low High
Small
(Cabral et al., 1994) (Grzeszczuk et al., 1998)
(Ikits et al., 2004) (Kruger and Westermann, 2003)
(Lacroute and Levoy, 1994) (Levoy, 1988)
(Pfister et al., 1999) (Rezk-Salama et al., 2000)
(Westover, 1990)
(McCorquodale and Lombeyda, 2003)
(Schwarz et al., 2004)
Large
(Bajaj et al., 2000) (Camahort and Chakravarty, 1993)
(Elvins, 1992) (Hsu, 1993)
(Ino et al., 2003) (Lombeyda et al., 2001)
(Palmer et al., 1998) (Peterka et al., 2008)
(Ma et al., 1994) (Marchesin et al., 2008)
(Mller et al., 2006) (Muraki et al., 2003)
(Lombeyda et al., 2001)
†
spans both GPU and CPU memory, along with a
conventional preprocessed hierarchical data structure
and hardware accelerated rendering to visualize large
input data on output displays connected to distributed-
memory clusters. Scientists successfully use an
implementation of this approach, Vol-a-Tile 2, to
visualize two large microscopy datasets, described
later, on two LCD arrays.
2 BACKGROUND
Volume renderers evaluate a common optical model.
A number of serial techniques have been developed
to accomplish this task that operate in software
(Levoy, 1988; Westover, 1990; Lacroute and Levoy,
1994), rely on hardware with texture mapping
capabilities (Cabral et al., 1994; Grzeszczuk et al.,
1998; Rezk-Salama et al., 2000), or use advanced
graphics-processing unit (GPU) methods (Kruger and
Westermann, 2003; Ikits et al., 2004). Additionally,
special purpose hardware, such as the VolumePro
graphics card (Pfister et al., 1999), have been
designed specifically for volume rendering.
Parallel techniques have been developed to
increase performance and render larger datasets.
The optimal choice of parallelization technique
and rendering method is heavily dependent on the
implementation architecture.
Parallel image-order techniques, also referred
to as sort-first techniques, break the output image
into disjoint regions and assign a processing unit
to render everything in that region. Image-order
implementations have been developed for shared-
memory systems (Palmer et al., 1998) as well as
distributed-memory systems (Bajaj et al., 2000).
Parallel object-order methods, also referred to
as sort-last methods, assign a processing unit to a
section of data regardless of where the data appears
in the final output image. After each section of
data is rendered, a compositing step based on the
theory described by Porter and Duff (1984) constructs
the final image. Much effort has been devoted
to developing efficient compositing methods (Hsu,
1993; Camahort and Chakravarty, 1993; Ma et al.,
1994; Ino et al., 2003). Object-order implementations
have been developed for distributed-memory clusters
(Elvins, 1992; Mller et al., 2006; Marchesin et al.,
2008) and modern supercomputers (Peterka et al.,
2008), and specialized hardware has been developed
that implements the binary-swap compositing method
(Lombeyda et al., 2001; Muraki et al., 2003).
Table 1 gives an overview of direct volume
rendering work in terms of output resolution and data
size. The left column shows some of the large body
of direct volume rendering work that renders low
output resolution images. The right column shows
that very little research exists specifically addressing
the production of output for high-resolution display
arrays.
According to Lombeyda et al. (2001), the Sepia-
2 hardware compositing architecture may potentially
scale to support high-resolution display arrays. The
Sepia-2 system uses a sort-last compositing approach
to assemble image portions produced by VolumePro
graphics cards on a distributed-memory cluster.
However, contrary to the name of the paper in which it
was published, this system uses proprietary hardware
components that are no longer available. In addition,
neither a theoretical nor a practical implementation
GRAPP 2010 - International Conference on Computer Graphics Theory and Applications
212
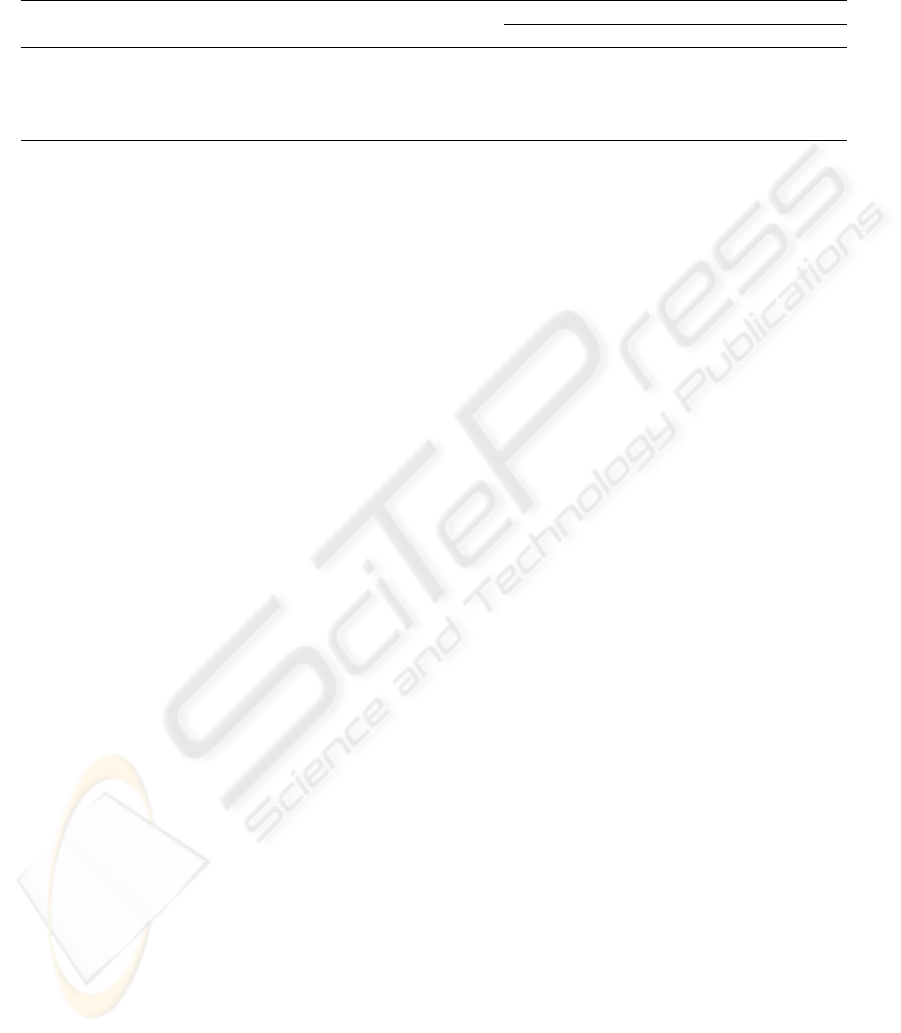
Table 2: Comparison of parallel high-resolution volume rendering systems with regard to large data, high-resoltuion output
and operating on commodity-off-the-shelf (COTS) distributed-memory clusters.
†
Neither a theoretical nor a practical
implementation have shown this system’s ability to scale in terms of output resolution, although the publication claims it
may potentially scale to support high-resolution display arrays.
System
Attribute
Large Data High-Resolution COTS
Sepia-2 (Lombeyda et al., 2001) 3 3
†
5
Volume Visualizer (McCorquodale and Lombeyda, 2003) 5 3 3
Vol-a-Tile (Schwarz et al., 2004) 5 3 3
Vol-a-Tile 2 3 3 3
has shown the system’s potential to scale in terms of
output resolution.
The TeraVoxel project produced Volume
Visualizer (McCorquodale and Lombeyda, 2003), a
solution for high-resolution displays. Using a cluster
equipped with four VolumePro cards, the system is
able to render a 256 x 256 x 1,024 volume to the
3,840 x 2,400 output window of a ten mega-pixel
IBM T221 LCD. This is accomplished by replicating
the entire dataset on all four nodes of the cluster.
Vol-a-Tile (Schwarz et al., 2004) is a direct
volume rendering application designed for scalable
high-resolution displays. Users roam through large
volume datasets that may be stored remotely, viewing
small regions-of-interest in full resolution. The
data within a region-of-interest is replicated on the
graphics card in every node where it is culled based
on view and rendered using 3D texture-mapping.
When the region changes, each node uploads identical
copies of the new data for the region.
Table 2 compares this work to current volume
rendering systems for high-resolution displays. This
work expands the capabilities of current systems
by providing a direct volume rendering solution
for high-resolution displays that operates on COTS
distributed-memory clusters and does not require data
replication.
3 METHODOLOGY
This system uses the parallel image-order data
decomposition approach illustrated in Figure 1. First,
data is preprocessed into a hierarchical data structure
and the view-frustum for each node is computed.
When the system is running, the user interactively
determines the view-transformation via a separate
user-interface. For each node, a list of visible bricks
is created and sorted. The rendering component
renders each brick, swapping buffers when it reaches
the end of each level-of-detail. The output image is
displayed in place on the node that rendered it. The
data management system uses a distributed shared-
memory system and a multi-level cache to distribute
and relocate data on the cluster according to the view-
transformation.
3.1 Hierarchical Data Structure
This system uses a conventional octree data structure
to represent volume data. Octrees are not new
(Knoll, 2006). They are used because they provide
the ability to progressively render data, allowing for
faster interaction. Each level of the tree is associated
with a different level-of-detail representation of the
original data. The leaf nodes are associated with the
original, highest resolution data. The root node is
associated with the coarsest resolution data. Octree
based representations have been used successfully to
manage large datasets (LaMar et al., 1999; Weiler
et al., 2000; Plate et al., 2002).
In the event that one of the dimensions of the data
is substantially smaller than the others, an octree may
not be appropriate. In this case, four leaf nodes are
left empty, producing a quadtree-like data structure.
Data along the short dimension is not subsampled at
each level like in the octree. Besides this, all other
algorithms function on both data structures without
modification.
3.2 Data Management
The data management system is critical to the
system’s ability to render large data on a distributed-
memory cluster. This approach uses a memory
system similar to distributed shared-memory
architectures. It keeps track of data bricks loaded in
RAM across all nodes of the cluster, and transfers
bricks between nodes when required.
A multi-level cache system keeps the most
recently used data bricks as close to the graphics
hardware as possible. The first level of the cache
resides in the texture-memory of each graphics card.
The second level exists in the main memory of each
DISTRIBUTED VOLUME RENDERING FOR SCALABLE HIGH-RESOLUTION DISPLAY ARRAYS
213
D
1
D
2
D
4
D
3
Node 1
VRAM
Texture-Memory
Cache
Memory System
Cache
RAM
NIC
Node 3
VRAM
Texture-Memory
Cache
Memory System
Cache
RAM
NIC
Node 2
VRAM
Texture-Memory
Cache
Memory System
Cache
RAM
NIC
Node 4
VRAM
Texture-Memory
Cache
Memory System
Cache
RAM
NIC
Distributed Shared-Memory
High-Resolution
2x2 Display Array
Figure 1: Parallel image-order volume rendering approach for a high-resolution display array. Bricks are rendered by the
nodes on which they appear. In this case, the leaf nodes of an octree three levels deep are shown on a 2x2 display array
and a four node cluster connected via a high-speed backplane. The shaded bricks are those rendered on Node 2. The data
management system, comprising of a two-level cache and a distributed shared-memory system, is responsible for rearranging
bricks on the cluster based on the view-transformation.
node. Both cache levels employ the least-recently-
used (LRU) replacement strategy. The number of
bricks in each cache is determined by the allotted
memory, set by the user, divided by the brick size.
The texture-memory cache keeps as many of the
most recently used data bricks as possible resident
in texture-memory. When the rendering component
requests a particular brick, the texture-memory cache
is the first place the data management system
searches. If the brick is found, it is moved to the
top of the cache and its texture data is reported to
the renderer. If the brick is not present, the data
management system continues its search at the next
level until it finds the brick and inserts it at the top
of the texture-memory cache. This process may push
LRU bricks out of the texture-memory cache.
The second cache level is the memory system
cache. This cache keeps as many of the most recently
used bricks requested by an individual node in the
local RAM of the requesting node as possible. The
data management system searches this cache when a
brick is not found in the texture-memory cache.
When the memory system cache receives a request
for a brick, it checks the bricks currently in the cache.
If the brick is present, it is moved to the top of the
cache and the data management system inserts the
brick in the texture-memory cache. If it is not present,
a query is made to the distributed shared-memory
system. Once the brick is retrieved, it is placed at the
top of the cache. This cache, like the texture-memory
cache, may push LRU bricks out.
The distributed shared-memory system keeps
track of all bricks loaded in each node’s memory
system cache. The system can query a brick using the
brick’s ID value stored along with the volume’s tree
metadata. If a node requires a brick present on another
node, the distributed shared-memory system transfers
it to the recipient node via the cluster’s high-speed
backplane. In the event that a brick is not present
in any memory system cache, the data management
system loads the data from the local disk on which it
resides, transfers it to the recipient node via the same
mechanism as the distributed shared-memory system
uses, and loads it in the recipient node’s cache.
Prior to running the system, the preprocessed
bricks are distributed in a round-robin, level-by-level
fashion among cluster nodes, where they are stored
on local disks. If there are too few bricks in a level
to place at least one brick on each node, the entire
level is replicated on every node. This replication is
feasible because typically only the first few levels are
replicated requiring very little overhead.
GRAPP 2010 - International Conference on Computer Graphics Theory and Applications
214
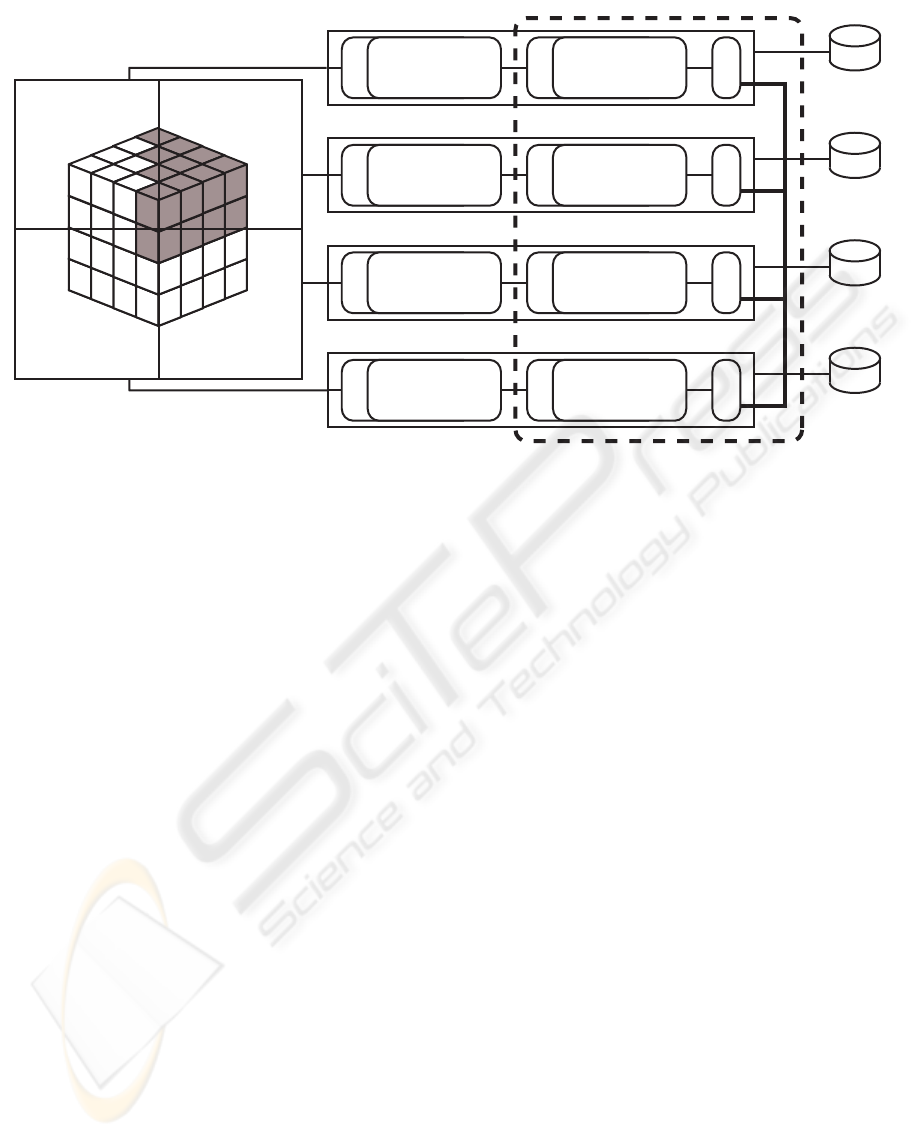
(a) Purkinje Neuron (b) Rat Kidney
Figure 2: Example datasets rendered on two high-resoution display arrays. (a) Researcher exploring the Purkinje neuron
dataset on a twenty-four megapixel tabletop display. (b) Scientist examining the rat kidney dataset on a 100 megapixel
display.
Table 3: Test properties and performance evaluation results for the Visible Human Female CT, Purkinje neuron, and rat kidney
datasets. The original dimensions and sizes are given for each dataset along with the brick dimensions, brick size, and total
size of each preprocessed tree. The rightmost column shows the speed-up factor relative to the lowest performing brick size.
Data Original Dimensions Original Size Brick Dimensions Brick Size New Size Speed-up
Human
512 x 512 x 2048
1 GB
64 x 64 x 256 2 MB
1.14 GB
2.3
16-bit 32 x 32 x 128 256 KB 1.0
Purkinje
2048 x 4096 x 128
16-bit
2 GB
128 x 256 x 128 8 MB
2.66 GB
1.0
64 x 128 x 128 2 MB 2.2
32 x 64 x 128 512 KB 1.9
Kidney 384 GB
256 x 256 x 128 8 MB
512 GB
1.0
32,768 x 32,768 x 128 128 x 128 x 128 6 MB 2.1
24-bit 64 x 64 x 128 1.5 MB 2.4
32 x 32 x 128 384 KB 1.9
3.3 Rendering and Interaction
Based on its frustum and the current view
transformation, each node independently creates
a list of visible bricks using a breadth-first search
algorithm to traverse the octree. Each node then uses
hardware accelerated 3D texture-mapping (Kniss
et al., 2001; Ikits et al., 2004) to render its visible list
of bricks. Each brick is rendered as its own individual
texture. The data management system ensures the
necessary textures are loaded in texture-memory. In
the case where data bricks cross tile boundaries, the
bricks are copied to each node where they are visible.
The opacity assigned at each sample point must
be corrected to account for the number of samples
taken and the current octree level. This situation
occurs when the user changes the sampling rate via
the user-interface, and when the renderer switches to
a different level-of-detail. This is especially important
when viewing a large, shallow volume from the side,
as the number of slices is much greater than when
viewed from the top.
The level-of-detail mechanism automatically
switches to using the coarsest resolution data
whenever the user interacts. This allows the user
instant feedback based on navigation without waiting
for a dataset to be fully rendered. When the user stops
navigation, the system progressively renders higher
resolution data from successive levels of the octree
giving the user an image of continuously increasing
detail.
DISTRIBUTED VOLUME RENDERING FOR SCALABLE HIGH-RESOLUTION DISPLAY ARRAYS
215

4 RESULTS
The system was tested on two microscopy datasets:
a Purkinje neuron sampled from a rat brain and
a rat kidney. For comparison to a widely known
dataset, the Visible Human Female CT dataset was
evaluated. Each dataset was tested with trees of
varying levels and brick sizes to determine which
brick size, and thus tree depth, produced the best
results. The number of voxels along each dimension
of a brick is a power of two in order to meet the texture
requirements of the graphics cards. Brick sizes
were increased until they exceeded the texture-size
limitation of the graphics hardware. The rendering
time was measured at increasing output resolutions
for each dataset using the best performing brick size
for each respective dataset. The number of rendering
nodes was increased along with output resolution to
suit the testbed’s hardware constraints.
The Purkinje dataset in Figure 2(a) is shown on
a six panel, twenty-four megapixel tabletop display.
The original raw data creates a 2,048 x 4,096 x 128
volume of 16-bit voxels. The real spatial extent
of the data is about 80 µm x 80 µm x 15 µm. The
display is run by a three node cluster where each
node is attached to two 2,560 x 1,600 LCDs. Each
cluster node has one AMD Athlon 64 FX-60 Dual
Core processor, 2 GB of RAM, and a PCI-E nVidia
GeForce 7900 GT graphics card with 256 MB of
texture-memory. The cluster is connected via a 10
Gbps Ethernet backplane with the MTU size set to
9,000 bytes.
The rat kidney dataset in Figure 2(b) is shown on
a fifty-five panel, 100 megapixel display. The original
raw data comprises a 32,768 x 32,768 x 128 volume
of 24-bit samples. The real spatial extent of the data
is about 8 mm x 5 mm x 1.5 mm. The display is run
by a twenty-eight node cluster where all but one node
is attached to two 1,600 x 1,200 LCDs. Each cluster
node has two AMD Opteron 246 processors, 4 GB of
RAM, 500 GB of local storage space, and an 8x AGP
nVidia Quadro FX 3000 graphics card with 256 MB
of texture-memory. The cluster is connected via a 1
Gbps Ethernet backplane with the MTU size set to
9,000 bytes.
The Visible Human Female CT dataset was tested
on the same tabletop display as the Purkinje neuron
dataset. The original 512 x 512 x 1,871 volume was
padded to form a 512 x 512 x 2,048 volume, and the
voxel resolution was increased from 12-bits to 16-
bits. This was done to satisfy the volume renderer’s
texture size requirements.
The system is written in C++ using the OpenGL,
Cg and MPICH libraries. All test computers are
running the openSUSE 10.2 Linux distribution.
Table 3 shows the average speed-up factor for
each brick size of the Visible Human Female CT
and Purkinje neuron datasets rendered at twenty-four
megapixels on three nodes. Table 3 also shows the
average speed-up factor for each of the rat kidney
dataset’s brick sizes when rendered at 100 megapixels
on twenty-eight nodes. The Visible Human Female
CT dataset performed best with a brick size of 64 x
64 x 256. The Purkinje neuron dataset performed best
when using a brick size of 64 x 128 x 128. The rat
kidney rendered fastest using a brick size of 64 x 64 x
128.
Preprocessing datasets into an octree or quadtree
increases the size of each dataset as new data is
generated for each level-of-detail. This process is
performed once for each dataset using an offline tool,
and stored for later use. The Visible Human dataset
was converted into an octree, while the Purkinje
neuron and rat kidney datasets were converted into
the quadtree-like structure described earlier due to
their relative flatness. The original dataset sizes as
well as the new sizes after preprocessing are shown
in Table 3. Because the data collection process is not
coupled with visualization and may take on the order
of days to weeks to complete, the additional time to
preprocess data is acceptable.
Table 4 shows the average time to render a single
frame of the Visible Human Female CT, Purkinje
neuron and rat kidney datasets. These results reflect
the average time taken to render and display all data
in all levels of the tree at various rotations. The results
show that as the output resolution increases along
with the corresponding number of rendering nodes,
the time taken to render each dataset decreases. Total
rendering time is also reduced when zooming in due
to culling data from the scene.
When the user changes the viewing parameters the
system switches to the lowest level-of-detail giving
the user a quasi-interactive experience. The lowest
level-of-detail is always the size of one brick. In
all test cases the lowest level-of-detail renders at
interactive rates.
5 CONCLUSIONS
A distributed image-order volume rendering
system for scalable high-resolution display
arrays was presented. The successful image-order
decomposition of data was made possible by using a
specialized data management system that manages
data across both GPU and CPU memory. Results
were presented showing the system’s performance
GRAPP 2010 - International Conference on Computer Graphics Theory and Applications
216
Table 4: Performance results for test datasets as output
resolution and cluster size increases using the best
performing brick size for each dataset.
Data Megapixels Nodes
Time/Frame
(seconds)
Human
8 1 2.1
16 2 0.6
24 3 0.3
Purkinje
8 1 3.4
16 2 1.7
24 3 0.5
Kidney
15 4 2625
30 8 1100
60 16 525
92 25 230
100 28 198
using different brick sizes on real datasets. The
results show that the system scales as output
resolution and cluster size increase. The increase
in performance observed as the output resolution
increases is due to the reduction in the number of
bricks each node must render as the cluster size also
increases. An increase in the number of rendering
nodes reduces the number of texture lookups along
the viewing direction, the amount of texture uploads
to the GPU, the amount data transfer among nodes
and the number of disk accesses. In the future we
hope to better evaluate the system’s performance and
suggest areas for improvement by analyzing cache
misses and rendering, network and I/O bottlenecks.
ACKNOWLEDGEMENTS
Biological datasets and insight graciously provided
by Rajvikram Singh, Thomas Deerinck, Hiroyuki
Hakozaki, Diana Price, Masako Terada and Mark
Ellisman of the National Center for Microscopy and
Imaging Research (NCMIR) at the University of
California, San Diego (UCSD).
Special thanks to Lance Long, Patrick Hallihan
and Alan Verlo for their expert advice and support.
Work at Northwestern University is supported
in part by Children’s Memorial Research Center,
Children’s Memorial Hospital, and from the National
Institute of Neurological Disorders and Stroke
(NINDS) grant 1 P30 NS054850-01A1.
The Electronic Visualization Laboratory (EVL) at
the University of Illinois at Chicago (UIC) specializes
in the design and development of high-resoltuion
visualization and virtual-reality display systems,
collaboration software for use on multi-gigbit
networks, and advanced networking infrastructure.
Work at EVL is supported by the National Science
Foundation (NSF), awards CNS-0420477, CNS-
0703916, OCI-0441094 and OCE-0602117, as
well as the NSF Information Technology Research
(ITR) cooperative agreement (OCI-0225642) to the
University of California, San Diego (UCSD) for
“The OptIPuter”. EVL is also supported by
funding from the National Institutes of Health, the
State of Illinois, the Office of Naval Research on
behalf of the Technology Research, Education, and
Commercialization Center (TRECC), and Pacific
Interface on behalf of NTT Optical Network Systems.
REFERENCES
Bajaj, C., Ihm, I., Park, S., and Song, D. (2000).
Compression-based ray casting of very large
volume data in distributed environments. In HPC
’00: Proceedings of the The Fourth International
Conference on High-Performance Computing in the
Asia-Pacific Region-Volume 2, pages 720–725.
Cabral, B., Cam, N., and Foran, J. (1994). Accelerated
volume rendering and tomographic reconstruction
using texture mapping hardware. In VVS ’94:
Proceedings of the 1994 symposium on Volume
visualization, pages 91–98.
Camahort, E. and Chakravarty, I. (1993). Integrating
volume data analysis and rendering on distributed
memory architectures. In PRS ’93: Proceedings of the
1993 symposium on Parallel rendering, pages 89–96.
Elvins, T. T. (1992). Volume rendering on a distributed
memory parallel computer. In VIS ’92: Proceedings of
the 3rd conference on Visualization ’92, pages 93–98.
Grzeszczuk, R., Henn, C., and Yagel, R. (1998). Advanced
geometric techniques for ray casting volumes. In
SIGGRAPH ’98: ACM SIGGRAPH 1998 courses.
Hsu, W. M. (1993). Segmented ray casting for data parallel
volume rendering. In PRS ’93: Proceedings of the
1993 symposium on Parallel rendering, pages 7–14.
Ikits, M., Kniss, J., Lefohn, A., and Hansen, C. (2004).
GPU Gems, chapter 39, pages 667–691. Addison
Welsey.
Ino, F., Sasaki, T., Takeuchi, A., and Hagihara, K. (2003).
A divided-screenwise hierarchical compositing for
sort-last parallel volume rendering. In IPDPS ’03:
Proceedings of the 17th International Symposium on
Parallel and Distributed Processing, page 14.1.
Kniss, J., McCormick, P., McPherson, A., Ahrens, J.,
Painter, J., Keahey, A., and Hansen, C. (2001).
Interactive texture-based volume rendering for large
datasets. IEEE Computer Graphics & Applications,
21(4):52–61.
Knoll, A. (2006). A survey of octree volume
rendering techniques. In Visualization of Large and
Unstructured Data Sets, pages 87–96.
DISTRIBUTED VOLUME RENDERING FOR SCALABLE HIGH-RESOLUTION DISPLAY ARRAYS
217

Kruger, J. and Westermann, R. (2003). Acceleration
techniques for gpu-based volume rendering. In VIS
’03: Proceedings of the 14th IEEE Visualization 2003
(VIS’03), pages 287–292.
Lacroute, P. and Levoy, M. (1994). Fast volume rendering
using a shear-warp factorization of the viewing
transformation. In SIGGRAPH ’94: Proceedings of
the 21st annual conference on Computer graphics and
interactive techniques, pages 451–458.
LaMar, E., Hamann, B., and Joy, K. I. (1999).
Multiresolution techniques for interactive texture-
based volume visualization. In VIS ’99: Proceedings
of the conference on Visualization ’99, pages 355–
361.
Levoy, M. (1988). Display of surfaces from volume data.
IEEE Computer Graphics and Applications, 8(3):29–
37.
Lombeyda, S., Moll, L., Shand, M., Breen, D., and
Heirich, A. (2001). Scalable interactive volume
rendering using off-the-shelf components. In PVG
’01: Proceedings of the IEEE 2001 symposium on
parallel and large-data visualization and graphics,
pages 115–121.
Ma, K.-L., Painter, J. S., Hansen, C. D., and Krogh, M. F.
(1994). Parallel volume rendering using binary-swap
compositing. IEEE Comput. Graph. Appl., 14(4):59–
68.
Marchesin, S., Mongenet, C., and Dischler, J.-M.
(2008). Multi-gpu sort-last volume visualization. In
Eurographics Symposium on Parallel Graphics and
Visualization (EGPGV08).
McCorquodale, J. and Lombeyda, S. V. (2003). The
volumepro volume rendering cluster: A vital
component of parallel end-to-end solution. Technical
report, California Institute of Technology.
Muraki, S., Lum, E. B., Ma, K.-L., Ogata, M., and Liu,
X. (2003). A pc cluster system for simultaneous
interactive volumetric modeling and visualization.
In PVG ’03: Proceedings of the 2003 IEEE
Symposium on Parallel and Large-Data Visualization
and Graphics, pages 95–102.
Mller, C., Strengert, M., and Ertl, T. (2006). Optimized
volume raycasting for graphics-hardware-based
cluster systems. In Eurographics Symposium on
Parallel Graphics and Visualization (EGPGV06),
pages 59–66.
Palmer, M. E., Totty, B., and Taylor, S. (1998). Ray
casting on shared-memory architectures: Memory-
hierarchy considerations in volume rendering. IEEE
Concurrency, 6(1):20–35.
Peterka, T., Yu, H., Ross, R., and Ma, K.-L. (2008).
Parallel volume rendering on the ibm blue gene/p. In
Eurographics Symposium on Parallel Graphics and
Visualization (EGPGV08).
Pfister, H., Hardenbergh, J., Knittel, J., Lauer, H., and
Seiler, L. (1999). The volumepro real-time ray-casting
system. In SIGGRAPH ’99: Proceedings of the
26th annual conference on Computer graphics and
interactive techniques, pages 251–260.
Plate, J., Tirtasana, M., Carmona, R., and Fr
¨
ohlich, B.
(2002). Octreemizer: a hierarchical approach for
interactive roaming through very large volumes. In
VISSYM ’02: Proceedings of the symposium on Data
Visualisation 2002, pages 53–60.
Porter, T. and Duff, T. (1984). Compositing digital images.
In SIGGRAPH ’84: Proceedings of the 11th annual
conference on Computer graphics and interactive
techniques, pages 253–259.
Rezk-Salama, C., Engel, K., Bauer, M., Greiner,
G., and Ertl, T. (2000). Interactive volume
rendering on standard pc graphics hardware
using multi-textures and multi-stage rasterization.
In HWWS ’00: Proceedings of the ACM
SIGGRAPH/EUROGRAPHICS workshop on
Graphics hardware, pages 109–118.
Schwarz, N., Venkataraman, S., Renambot, L.,
Krishnaprasad, N., Vishwanath, V., Leigh, J.,
Johnson, A., Kent, G., and Nayak, A. (2004). Vol-
a-tile - a tool for interactive exploration of large
volumetric data on scalable tiled displays. In VIS ’04:
Proceedings of the conference on Visualization ’04,
page 598.19.
Weiler, M., Westermann, R., Hansen, C., Zimmermann, K.,
and Ertl, T. (2000). Level-of-detail volume rendering
via 3d textures. In VVS ’00: Proceedings of the 2000
IEEE symposium on Volume visualization, pages 7–
13.
Westover, L. (1990). Footprint evaluation for volume
rendering. In SIGGRAPH ’90: Proceedings of the
17th annual conference on Computer graphics and
interactive techniques, pages 367–376.
GRAPP 2010 - International Conference on Computer Graphics Theory and Applications
218
