
A FRAMEWORK FOR DATA-DRIVEN PROGRESSIVE MESH
COMPRESSION
Gabriel Cirio
∗
, Guillaume Lavou
´
e
†
and Florent Dupont
∗
Universit
´
e de Lyon, CNRS, France
∗
Universit
´
e Lyon 1, LIRIS, UMR5205, F-69622, France
†
INSA-Lyon, LIRIS, UMR5205, F-69621, France
Keywords:
Progressive mesh compression, Associated properties, Data-driven, Kd-tree.
Abstract:
Progressive mesh compression techniques have reached very high compression ratios. However, these tech-
niques usually do not take into account associated properties of meshes such as colors or normals, no matter
their size, nor do they try to improve the quality of the intermediate decompression meshes. In this work, we
propose a framework that uses the associated properties of the mesh to drive the compression process, resulting
in an improved quality of the intermediate decompression meshes. Based on a kd-tree geometry compression
algorithm, the framework is generic enough to allow any property or set of properties to drive the compression
process provided the user defines a distance function for each property. The algorithm builds the kd-tree struc-
ture using a voxelisation process, which recursively separates the set of vertices according to the associated
properties distances. We evaluate our method by comparing its compression ratios to recent algorithms. In
order to evaluate the visual quality of the intermediate meshes, we carried a perceptive evaluation with human
subjects. Results show that at equal rates, our method delivers an overall better visual quality. The algorithm
is particularly well suited for the compression of meshes where geometry and topology play a secondary role
compared to associated properties, such as with many scientific visualization models.
1 INTRODUCTION
Nowadays, 3D models are widely used in many fields
involving 3D graphics such as scientific visualization,
engineering, virtual reality, gaming, e-commerce and
education. They are becoming as popular as other
media types like audio, image and video. In recent
years, due to improvements in three dimensional data-
acquisition, storing and display devices, the demand
for high resolution models has exploded. This in-
crease in the complexity of 3D models brought the
need to use efficient compression techniques in or-
der to satisfy the requirements of graphic applications
in terms of compact storage and fast transmission of
models. The increasing use of networked applica-
tions, low computational power devices (such as mo-
bile phones or PDAs) and huge size meshes calls for
progressive visualization of models through interme-
diate quality meshes.
A 3D mesh is made of geometry data and connec-
tivity data. However, in many cases there are prop-
erties associated to the mesh’s elements, most com-
monly to vertices. These properties can be colors,
normals, or, such as in the case of scientific visual-
ization, density or temperature values. Most recent
mesh compression algorithms focus only on geometry
and connectivity data compression. However, prop-
erty data can be as large or even larger in size than
geometry and connectivity data together, hence ded-
icated compression algorithms could greatly improve
coding efficiency. Moreover, existing techniques are
driven by geometry or connectivity, meaning that only
the geometry or the connectivity is taken into account
to optimize the compression, while associated prop-
erties play a secondary role.
In this work, we describe a framework that takes
into account vertex-bound associated properties for
the driving of the compression (the technique is there-
fore called data-driven), and that compresses the asso-
ciated properties together with the geometry and the
connectivity data. We believe that a compression pro-
cess driven by the associated properties will deliver
better results in terms of visual quality during decom-
pression, particularly for meshes where geometry and
topology play a secondary role compared to associ-
ated properties, such as with many scientific visual-
5
Cirio G., Lavoué G. and Dupont F. (2010).
A FRAMEWORK FOR DATA-DRIVEN PROGRESSIVE MESH COMPRESSION.
In Proceedings of the International Conference on Computer Graphics Theory and Applications, pages 5-12
DOI: 10.5220/0002813500050012
Copyright
c
SciTePress

ization models.
In the next section, we survey the existing tech-
niques for progressive mesh compression and asso-
ciated properties compression, and we describe the
few algorithms that take into account associated prop-
erties for data-driving. In section 3 we present our
algorithm for data-driven compression. In section 4
we compare our results with recent techniques and
present a perceptive evaluation of the quality of the
compressed meshes.
2 RELATED WORK
2.1 Progressive Mesh Compression
In this section, we briefly describe the different ex-
isting approaches for progressive mesh compression.
For a more comprehensive review, we refer the reader
to (Peng et al., 2005).
Connectivity-based approaches first process con-
nectivity data, with the vertices positions playing a
secondary role. (Hoppe, 1996) reported the first tech-
nique, where he simplifies the mesh by performing a
sequence of edge collapses. Later techniques focused
on improving the compression ratio by Vertex deci-
mation techniques, as in (Alliez and Desbrun, 2001),
or by extending single-rate methods to achieve pro-
gressivity such as in (Taubin and Rossignac, 1998).
More recent research has focused on geometry-
based approaches, achieving higher compression ra-
tios. (Gandoin and Devillers, 2002) proposed a kd-
tree space subdivision technique, where they recur-
sively subdivide the space in two cells and encode the
number of vertices contained in one of the child cells.
The geometry compression relies on the bit sharing
property, since grouping vertices in a common cell
makes them share the first high-level bits of their po-
sitions. (Peng and Kuo, 2005) improve the technique
by using an octree subdivision and efficient prediction
schemes, but at the cost of restricting the algorithm to
triangular meshes only. (Bordignon et al., 2006) ex-
tend (Gandoin and Devillers, 2002) algorithm by us-
ing a BSP-tree, in order to obtain child cells with the
same number of vertices and therefore maximize the
bit sharing property.
Other approaches for progressive mesh compres-
sion techniques exist, but are not well suited for our
requirements. (Karni and Gotsman, 2000) spectral
coding does not allow a local control of the com-
pression algorithm, making it inappropriate for data
driving. (Khodakovsky et al., 2000) wavelet based
compression requires special mesh properties, such as
regularity or piecewise regularity, and often a remesh-
ing pre-processing step. Since many applications can-
not afford these constraints, we do not consider these
techniques in our work.
2.2 Property Compression
The compression of mesh associated properties plays
a secondary role in recent compression schemes.
However, mesh properties can often be of greater size
than other mesh components: if we consider a color
3 floating-point value property attached to vertices,
both geometry and color data are equally important
in size. Here, we survey existing techniques that deal
with the progressive compression of these associated
properties.
(Waschbsch et al., 2004), while recursively con-
tracting pairs of neighboring vertices in point-clouds,
also contract their YUV color data. They encode the
color of the resulting point by delta coding with one
of the contracted points. The same method is ap-
plied for the coding of normals, using the normals
spherical coordinates. (Huang et al., 2008), with
their octree-based geometry compression data struc-
ture, further improve properties compression ratios
by using progressive normal quantization. The nor-
mal unit sphere, first represented by an octahedron,
is subdivided along the mesh, and each normal of the
intermediate mesh is mapped to a facet of the sub-
divided octahedron, which leads to a progressive in-
crease in precision. The normal of a cell is the av-
erage of the normals of the vertices inside the cell.
For color compression, they use an optimized custom
color frame and adaptive quantization. Each compo-
nent is encoded through delta coding.
2.3 Data-driven Compression
Little research has been conducted to exploit asso-
ciated property data to drive the compression of the
geometry, in order to achieve a higher quality of the
intermediate meshes. The aim has been improving
the compression ratios and not necessarily the decom-
pression quality. To the best of our knowledge, there
are few papers which make the first steps into data-
driven progressive mesh compression.
(Peng et al., 2006) recursively split the initial set
of vertices of the mesh into several child sets, through
the use of a distance metric applied on the geome-
try data and the normal property data. However, no
compression ratio is given. (Waschbsch et al., 2004),
as previously mentioned, recursively contract pairs of
neighboring points. In order to decide which pairs
will be contracted, and in order to obtain the best set
GRAPP 2010 - International Conference on Computer Graphics Theory and Applications
6

of pairs, they solve a minimum weight perfect match-
ing graph problem. The weight of each edge of the
graph is the sum of the distance between the two ver-
tices for each associated property, together with their
Euclidean distance. Each distance is given by a dis-
tance function that returns the difference between two
instances of the same property. In the examples given,
they use the normals as driving associated property,
and the distance between two normals is the cosine of
their enclosing angle. By taking into account normal
data, both techniques lead to an increased quality of
the intermediate levels of detail.
These algorithms show an initial concern for data-
driving the progressive compression of meshes. How-
ever, they do not provide a generic approach for
any kind of property or they exploit these properties
in a limited way. Inspired from (Waschbsch et al.,
2004) distance functions and based on (Gandoin and
Devillers, 2002) kd-tree compression technique, we
propose a framework for the data-driven progressive
compression of arbitrary meshes.
3 OUR DATA-DRIVEN
FRAMEWORK
The space subdivision techniques ((Gandoin and Dev-
illers, 2002) (Peng and Kuo, 2005) (Bordignon et al.,
2006)), while achieving high compression ratios, use
data structures that allow a certain flexibility in the
splitting of a cell: the position of the cutting plane.
Our algorithm exploits this degree of freedom by
choosing, similarly to the BSP-tree algorithm from
(Bordignon et al., 2006), the position of the cutting
plane for each cell subdivision. The position is se-
lected according to a set of variables which are, in
our work, the associated properties. Due to the or-
thogonality constraint in the kd-tree cutting planes, a
kd-tree structure is cheaper to code than a BSP-tree.
We chose the kd-tree over the BSP-tree in a trade-off
between degrees of freedom and data overhead, and
over the octree for flexibility reasons, since the oc-
tree requires cutting along each dimension iteratively,
while the kd-tree allows two or more consecutive cuts
along the same dimension.
The kd-tree structure is built by recursively split-
ting the cells in two, starting at the bounding box of
the mesh. The data-driven splitting algorithm, the
main contribution of our work, is described in sec-
tion 3.1. Then, in a bottom to top pass, connectivity
data is updated as described in (Gandoin and Dev-
illers, 2002). During the same pass, the associated
properties data are also updated, with each property
of the parent cell being the average of the correspond-
ing properties of the child cells. The property average
is computed through an average function associated
to each property type, as described in section 3.2. In
a third pass, from top to bottom, the data is encoded.
Along with the geometry and connectivity data en-
coding achieved in (Gandoin and Devillers, 2002), we
encode the cutting plane as described in section 3.3.
The associated properties data are encoded using delta
encoding.
3.1 Data-driven Cell Splitting
At each cell split we want to subdivide a set of ver-
tices into two sets through a plane orthogonal to an
axis of the reference frame. We define a discrete set
of equidistant planes orthogonal to each dimension of
the cell, and we compute a saliency value for each of
them. The saliency value represents the overall aver-
age weighted distance between the properties associ-
ated to the vertices on each side of the plane. We pick
the plane with the highest saliency value.
3.1.1 Local Voxelisation
The splitting process is represented in Figure 1 for
a 2D cell. We first voxelise the entire cell as a pre-
processing step. The boundaries of the voxels are
defined by the discrete set of planes for the cell, as
detailed in section 3.1.2. The properties of the ver-
tices inside each voxel are averaged so that each voxel
is represented by only one instance of each property.
Then, for each plane, each voxel in the plane neigh-
borhood is evaluated with its symmetric voxel with
respect to the plane, hence computing the distance of
every property for every pair of voxels. The saliency
value s of a plane is given by the average of the dis-
tance values d
i, p
j
for P properties p
0
to p
P
of the N
voxels on each side of its neighborhood:
s =
1
P
P
∑
j=0
(
1
N
N
∑
i=0
d
i, p
j
) (1)
This technique allows a local analysis of data,
which leads to a local vertex segmentation driven by
the associated properties. The plane with the high-
est saliency value is the one that captures the most
visible property difference according to the distance
criterion. Figure 2 compares the first two cuts of the
data-driven and the non data-driven compression of
an example model with a simple color distribution.
3.1.2 Adaptive Precision
When a cell is voxelised, the number of planes of the
discrete set on each dimension defines the number
A FRAMEWORK FOR DATA-DRIVEN PROGRESSIVE MESH COMPRESSION
7
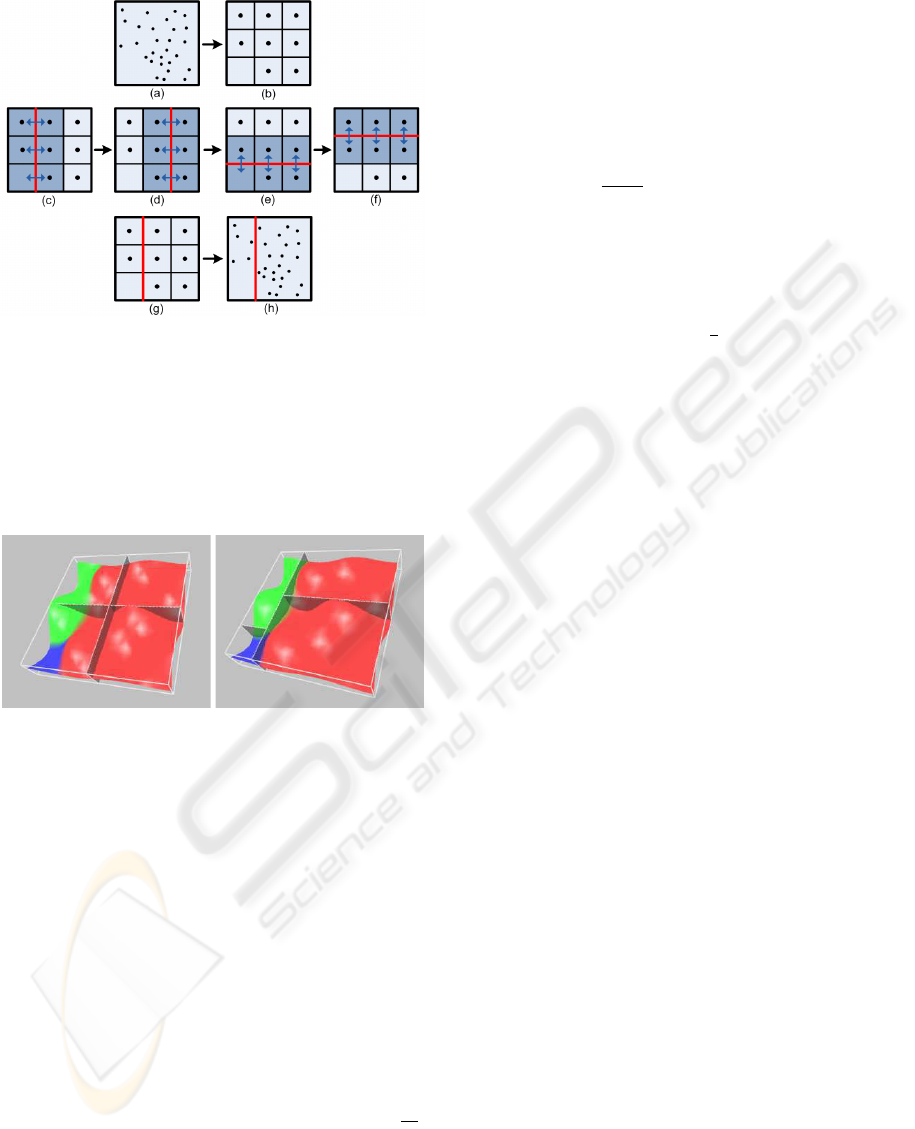
Figure 1: The cell (a) is voxelised (b) according to the dis-
crete planes, and each voxel averages the properties of the
vertices it contains. The algorithm iterates through the dis-
crete planes ( (c), (d), (e), (f) ), computing the property dis-
tances for every pair of symmetric voxels. The saliency
value of the plane is the weighted average of the average
property distances. The plane with the highest saliency
value is selected (g), and the cell is split according to the
selected plane (h).
Figure 2: Illustration of the first two cuts (4 cells) of a sim-
ple model for the non data-driven (left) and the data-driven
(right) versions of the algorithm. The non data-driven cuts
subdvide the parent cell into 2 equal children cells, while
the data-driven cuts follow the color borders.
of voxels in the cell. The size of a voxel and the
efficiency of the split are directly related to the
number of planes. This number is computed for each
cell, and for each dimension, following 2 criteria:
The Cell Size. For a constant number of planes,
the bigger the cell the larger the separation between
planes, and hence the lower the accuracy of the split.
A bigger cell requires a larger discrete set of planes.
If l
c
is the length of the longest side of a cell C and
l
bb
is the length of the corresponding side of the mesh
bounding box, the size criterion S is given by S =
l
c
l
bb
.
The Number of Vertices of the Cell. The higher the
number of vertices in a cell, the larger the number of
planes should be in order to accurately separate the
set of vertices in two. Hence, we need to quantize the
surplus or the lack of vertices for a given cell volume.
For that, we normalize the number of vertices with the
expected number of vertices of the cell, which is the
number of vertices the cell would have if the vertices
were homogeneously distributed inside the bounding
box. If V
c
is the volume of C, V
bb
is the volume of the
bounding box, P
c
is the number of vertices of C and
P
bb
is the total number of vertices, the ratio criteron R
is given by R =
P
c
∗V
bb
V
c
∗P
bb
.
The number of discrete planes N
c
of a cell C is
therefore given by the following formula:
N
c
= N
max
∗ S
α
∗ R
β
where N
max
is the maximum number of planes set by
the user. We choose α = β =
1
2
to obtain a stagnating
behavior of N
c
. N
c
is bounded by 1 and N
max
in or-
der to avoid particular cases of extreme out-of-range
values.
3.2 Distance and Average Functions
For each associated property, we need to define
a distance and an average function. The distance
function is used in the subdivision process, while the
average function is used in the encoding process.
Distance Function. The distance function compares
two instances of a property and returns a positive
value representing a difference between them. It is
used in Equation 1 to compute the plane saliency.
For the color property, we can define the distance
between two colors as their Euclidean distance in
the Luv space, as proposed in (Waschbsch et al.,
2004). The Luv space is better suited for human
perception of colors than the RGB space, since
distances between colors in the Luv space are closer
to distances perceived by a human eye than their
corresponding RGB space distances. Moreover, the
Luv space decorrelates color information redundant
in the RGB space, which improves coding efficiency.
Average Function. The average function should re-
turn a property instance that closely represents both
input instances. For the color property, an appropriate
average function is the 3-tuple of the averages of each
Luv space component.
3.3 Plane Coding
Two extra values need to be encoded for each non-
empty cell in order to recover the cutting planes dur-
ing the decompression process: the dimension to
which the cutting plane is orthogonal to, and the index
of the cutting plane among the discrete set of planes
GRAPP 2010 - International Conference on Computer Graphics Theory and Applications
8
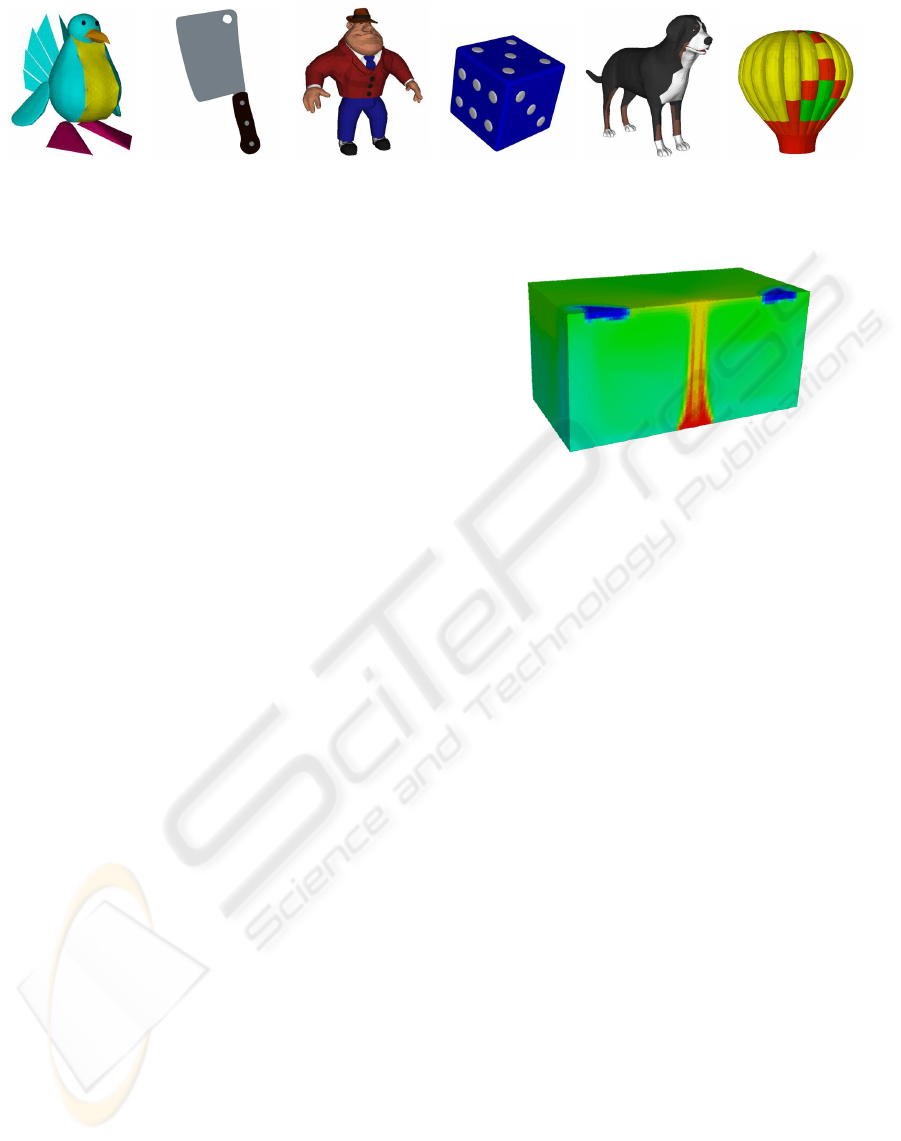
(a) (b) (c) (d) (e) (f)
Figure 3: Some models from the Princeton Shape Benchmark repository data set: birdy (a), cleaver (b), gangster (c), dice (d),
dog (e), montgolf (f).
of that dimension of the cell. The dimension is arith-
metically encoded, using the parent and the grand-
parent cutting planes dimension as context. This re-
duces the cost of coding the dimension by around
60%. Since the number of discrete planes N
c
is cell
dependent and can be computed at decompression
time, the index of the cutting plane is arithmetically
encoded with N
c
as context.
4 RESULTS
In the following section we quantitatively and qualita-
tively evaluate the compression ratios and decompres-
sion qualities of sets of colored meshes. We use the
color mesh property to drive the compression process
with the color distance and average functions previ-
ously described.
We quantitatively evaluate the geometric quality
of the intermediate levels of detail of several 3D
models using the METRO (Cignoni et al., 1998)
rate/distortion evaluation tool. However, this geomet-
ric distance does not reflect the perceptual visual qual-
ity of the meshes, which depends in part on the color
property. Therefore, we also carried perceptive eval-
uations through subjective experiments with human
subjects (experts and non experts) in order to compare
the results of our algorithm with its non data-driven
version. The non data-driven version splits cells at
their center, as in (Gandoin and Devillers, 2002).
A first set of colored meshes was chosen among
the original meshes of the Princeton Shape Bench-
mark repository (Shilane et al., 2004). We selected a
set of 8 heterogeneous models that we used through-
out our quantitative tests and subjective experiments.
Some of the models are shown in Figure 3. The num-
ber of vertices ranged from 4000 to 17000.
A second set of 8 colored meshes was provided
by EDF R&D (Energie de France Research and De-
velopment) division. The meshes are examples of
CAD machinery parts and scientific computation out-
puts of thermal flows. Unfortunately, this data set is
confidential, with the exception of the radiator sam-
Figure 4: The radiator, from the EDF R&D data set.
ple shown in Figure 4. The number of vertices of the
meshes of this data set ranges from 26000 to 322000.
This dataset was used during a perceptive evaluation
performed by EDF R&D experts.
4.1 Rate/Distortion
In order to evaluate the geometry quality of the in-
termediate meshes, we computed distortion values at
several bitrates. The geometry distortion value for a
particular bitrate is given by the Hausdorff distance
between the original (lossless) mesh and the inter-
mediate mesh at that particular bitrate. We used the
METRO (Cignoni et al., 1998) tool for the computa-
tions. Results are given in Figure 5, which show the
rate-distortion (R-D) curves of the data-driven and the
non data-driven compression of 3 different models of
the first set of meshes.
At low bitrates, the data-driven method performs
worse than the non data-driven version, in terms of
geometric distortion. This behaviour was expected,
since the algorithm is optimized for higher associated
properties quality, while the METRO tool judges ge-
ometry quality. At higher bitrates, we can notice that
both versions of the meshes are roughly equivalent in
geometry. It is interesting to point out that the distor-
tion difference remains small for the tested dataset,
meaning that the gain on the associated properties
side is achieved at a small cost. Since a purely ge-
ometric distance is not well suited to evaluate the vi-
sual quality of a mesh, particularly for colored meshes
where color may carry an important part of the visual
A FRAMEWORK FOR DATA-DRIVEN PROGRESSIVE MESH COMPRESSION
9
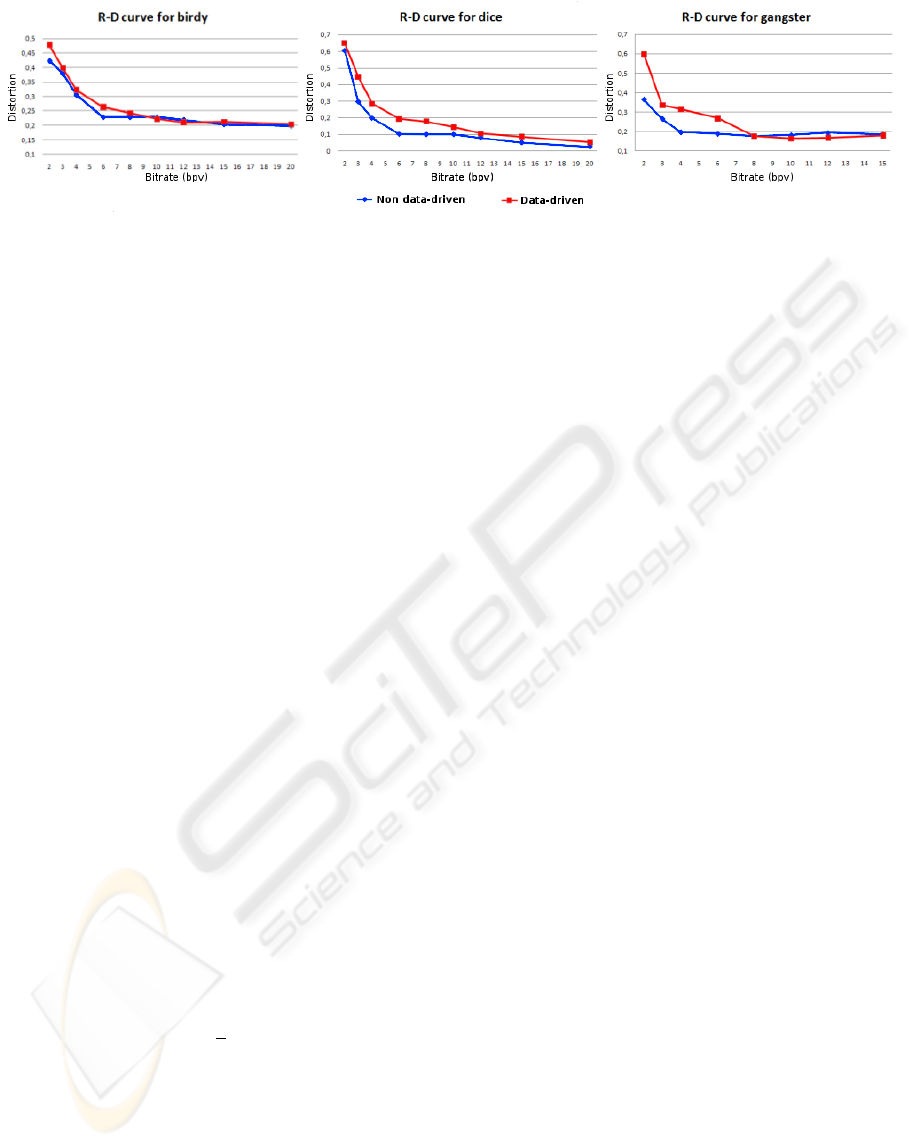
Figure 5: R-D curves for 3 of the evaluated meshes (birdy, dice and gangster). Abscissa: bitrates (in bits per vertex). Ordinates:
Hausdorff distances.
information, we proceeded to human perceptive eval-
uations through subjective experiments.
4.2 Perceptive Evaluation
In order to demonstrate that our data-driven method
increases the visual quality of the intermediate
meshes compared to its non data-driven counterpart,
we have conducted two subjective experiments using
human observers. These two experiments share the
same evaluation protocol. However, the data sets and
the expertise of the human observers are different.
4.2.1 Evaluation Protocol
The evaluation protocol was as follows: we presented
to each evaluator 4 intermediate meshes at a time, to-
gether with the original lossless model. The inter-
mediate meshes were composed of 2 data-driven in-
termediate meshes and their corresponding non data-
driven version of the same bitrates, in random posi-
tions. The evaluator could rotate, scale and translate
the models. A transformation applied to one of the
meshes was also automatically applied to all the other
meshes on the screen, in order to keep a consistent
point of view. The evaluator was asked to provide
a score for each object, reflecting the degree of per-
ceived visual similarity with the original, from 1 (no
similarity) to 6 (highest similarity). The Mean Opin-
ion Score (MOS) is then computed for each interme-
diate mesh of each model of each corpus:
MOS
i
=
1
n
n
∑
j=1
m
i j
where MOS
i
is the mean opinion score of the i
th
ob-
ject, n is the number of evaluators, and m
i j
is the score
(∈ [1, 6]) given by the j
th
evaluator to the i
th
object.
For each model of the data sets, we evaluated
4 different bitrates, which required 8 intermediate
meshes (4 data-driven, 4 non data-driven). Since only
4 intermediate meshes could be shown on the screen
at a time for a confortable visualization, each model
was fully evaluated in two independent steps: the low
step, with the 2 lower bitrates, and the high step, with
the other 2 bitrates. The high step immediately fol-
lowed the low step.
Since we noticed that, at high resolutions, our al-
gorithm performs roughly equally than the non data-
driven version, we believed it was more interesting to
compare the two algorithms at low bitrates. The color
property was compressed with 9, 6 and 6 bits per color
component (L, u and v) respectively. Geometry was
compressed with 14 bits per coordinate.
4.2.2 First Experiment: Princeton Shape
Benchmark Data Set
Eight color models from the Princeton Shape Bench-
mark repository data set (Figure 3) were evaluated
by 12 human subjects, from the research staff of the
LIRIS laboratory in Lyon, France, with different de-
grees of knowledge in the computational geometry
and computer graphics field. For this experiment, we
chose 4 fixed bitrates: 2, 3, 4 and 6 bits per vertex
(bpv). Hence our corpus was composed of 64 ob-
jects (8 models * (4 data driven version + 4 non-data-
driven version) ). Table 1 details the Mean Opinion
Scores (MOS) for the models of the dataset, accord-
ing to the bitrate and the method (data-driven vs. non
data-driven).
The results show a positive evaluation for most of
the meshes of the set, where the data-driven algorithm
is evaluated from roughly equal (no MOS difference)
to considerably better (more than 1 point in MOS dif-
ference) than its non data-driven counterpart. Clear
examples are the dog (Figure 6) and cleaver (Figure
7) models, where different color regions can be dis-
tinguished from an early stage in the data-driven ver-
sion, hence the overall visual quality is clearly im-
proved even if the geometric distorsion is higher than
for the non-data-driven version. However, for some
models (for instance montgolf) the geometric distor-
tion breaks the overall shape of the model, and there-
fore the data-driven version has lower MOS than its
non data-driven couterpart, regardless of the color vi-
GRAPP 2010 - International Conference on Computer Graphics Theory and Applications
10
sual quality of the data-driven model.
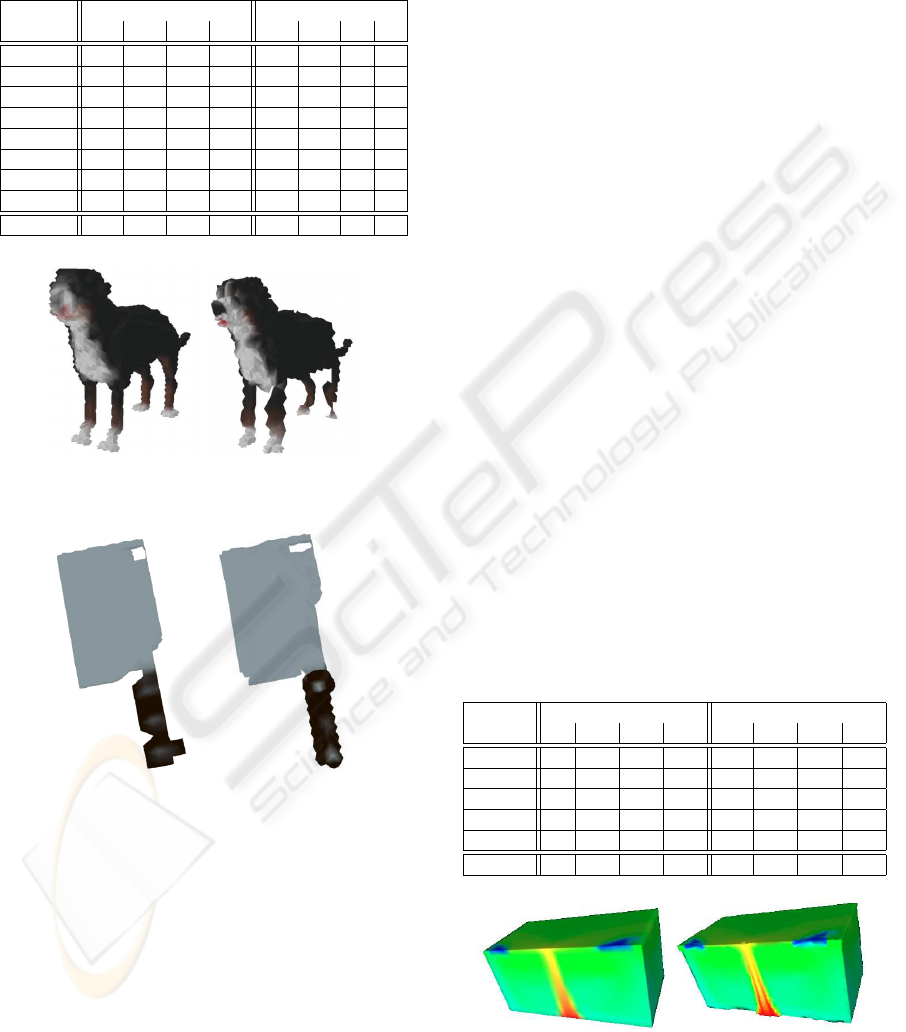
Table 1: Mean Opinion Scores for the models of the Prince-
ton Shape Benchmark data set, at all tested bitrates, for the
data-driven and the non data-driven algorithms.
Non data-driven Data-driven
2 3 4 6 2 3 4 6
dog 2.8 4.1 4 4.4 3 4.2 4.6 5.2
cleaver 4.1 4.5 4.1 4.3 4.5 4.6 4.6 5
montgolf 3.5 4 3.6 4 2.3 3 2.8 3.7
tuna 3.7 4.1 4.4 5.1 4.3 4.9 5 5.2
dice 2.3 2.7 3 3.5 2.9 3.3 3.4 3.8
gangster 3 3.5 3.4 3.9 3.3 3.4 3.7 4.1
chair 3.3 3.6 4 4.2 3.1 3.5 3.8 4
birdy 3.5 3.6 4.3 4.5 4 4.2 4.9 5
Average 3.28 3.76 3.85 4.24 3.43 3.89 4.1 4.5
Figure 6: The non data-driven (left) and the data-driven
(right) intermediate meshes for the dog model at 3 bpv.
Figure 7: The non data-driven (left) and the data-driven
(right) intermediate meshes for the cleaver model at 2 bpv.
For many of the models, the MOS at a particu-
lar bitrate with the data-driven algorithm was equal
or higher than the MOS of the next (higher) bitrate
with the non data-driven algorithm, like with bitrates
4 and 6 of the dog model, for instance. In such cases,
both the compression ratio and the visual quality are
improved by our method.
It is interesting to see that, even if our data-
driving algorithm exhibits a rate-distorsion compro-
mise slightly worse than the non data-driven one, on
the contrary the rate-quality compromise is greatly
improved.
4.2.3 Second Experiment: EDF Data Set
Five color models from EDF R&D Clamart were eval-
uated by 7 EDF physicists and 3D experts. There
were considerable differences in the number of poly-
gons among the models of this dataset. Therefore,
instead of using fixed bitrates for all the models, we
chose bitrates corresponding to 5, 10, 15 and 20%
of the file size of the non data-driven lossless com-
pressed model. Resolutions under 5% were usually
too coarse for any visual evaluation, and resolutions
higher than 20% were less interesting due to the close
ressemblance between the results of both algorithms.
For this experiment, we included the normal data in
the compression process, but only as encoded data,
not as a driving property. This produced intermediate
meshes of a higher rendering quality, for both algo-
rithms.
The data-driven algorithm produced higher qual-
ity intermediate meshes for 3 of the 5 models (higher
MOS), as shown in Table 2. The models where the
data-driven algorithm was rated lowerer than its non
data-driven counterpart were the radiator and a sec-
ond model where color regions were hard to distin-
guish even in its lossless version. For the case of the
radiator, the compressed version presented an impor-
tant visual distortion, due to its rough parallelepipedal
shape, with any break in the continuity of the con-
tours being easily noticeable, decreasing distortion
tolerance. Figure 8 compares the result of the algo-
rithms for a bitrate where the data-driven algorithm
was given a higher grade.
Table 2: Mean Opinion Scores for the models of the EDF
data set, at all tested bitrates, for the data-driven and the non
data-driven algorithm.
Non data-driven Data-driven
5% 10% 15% 20% 5% 10% 15% 20%
1 2.8 3.4 3.9 4.3 2.3 3.2 3.8 4.3
radiator 2.2 3.7 2.2 4 1.3 2.5 2.5 3.5
3 2.8 3.1 3 3.4 3.3 3.7 3.8 4
4 2.6 2.7 3 3.3 2.3 2.5 3 3.6
5 3.1 3.4 3.5 4.2 3.4 3.6 3.6 4.2
Average 2.7 3.26 3.12 3.84 2.52 3.1 3.34 3.92
Figure 8: The non data-driven (left) and the data-driven
(right) intermediate meshes for the radiator model at 6 bpv
(15%).
A FRAMEWORK FOR DATA-DRIVEN PROGRESSIVE MESH COMPRESSION
11

An interesting remark can be made based on the re-
sults of the evaluation. Two of the evaluators sys-
tematically gave a lower grade to the data-driven al-
gorithm, for every model at every evaluated bitrate.
Even in situations where all of the other evaluators
gave a significant advantage to the data-driven al-
gorithm, these 2 evaluators graded it lower. We
could therefore think that some individuals are or be-
come more sensitive to geometry distortion than oth-
ers. These two subjective experiments have shown
that driving the compression with attributes like color
can improve the rate-quality compromise, whereas
producing a slighty higher geometric distorsion. Of
course this improvement depends on the geometric
structure of the object and on the importance of the
attributes in its visual appearance: we have noticed
that it is more interesting to use our compression tech-
nique on objects where the important data is color,
instead of meshes where the geometry-color tradeoff
can dramatically deteriorate the overall visual quality.
5 CONCLUSIONS
We have presented a framework for the data-driven
progressive compression of meshes. It allows the use
of any associated property, and the behavior of the
compression process can be customized through a sin-
gle distance function per property. We showed an ex-
ample of color data-driving and compression of the
color property. At equal bitrates, it improves the vi-
sual quality of the decompressed meshes compared to
the non data-driven version. This algorithm is well
suited for the compression of meshes where geome-
try and topology play a secondary role compared to
associated properties, such as with scientific visual-
ization models. This work sets the bases for further
research around the concept of data-driven compres-
sion. The performance of the algorithm relies in part
on efficient distance functions. Other properties will
be considered for testing, such as normals. More
complex and efficient distance functions could be de-
fined for intrinsic properties such as curvature tensors
and connectivity data, in order to improve the geo-
metric shape of the intermediate meshes. Moreover,
a BSP-tree could be used to allow more flexible cuts.
However, special attention would have to be given to
plane coding and overall processing time.
ACKNOWLEDGEMENTS
This work has been supported by French National Re-
search Agency (ANR) through SCOS project (ANR-
06-TLOG-029) and COSINUS program (project
COLLAVIZ ANR-08-COSI-003). The authors would
like to thank R. Marc and C. Mouton from EDF for
their help regarding the perceptive evaluation.
REFERENCES
Alliez, P. and Desbrun, M. (2001). Valence-Driven connec-
tivity encoding for 3D meshes. Computer Graphics
Forum, 20:480–489.
Bordignon, A., Lewiner, T., Lopes, H., Tavares, G., and
Castro, R. (2006). Point set compression through BSP
quantization. In Proceedings of the Brazilian Sympo-
sium on Computer Graphics and Image Processing,
pages 229–238.
Cignoni, P., Rocchini, C., and Scopigno, R. (1998). Metro:
measuring error on simplified surfaces. Computer
Graphics Forum, 17:167–174.
Gandoin, P. and Devillers, O. (2002). Progressive loss-
less compression of arbitrary simplicial complexes.
In SIGGRAPH, pages 372–379, San Antonio, Texas.
ACM.
Hoppe, H. (1996). Progressive meshes. In SIGGRAPH,
pages 99–108. ACM.
Huang, Y., Peng, J., Kuo, C. C. J., and Gopi, M. (2008).
A generic scheme for progressive point cloud cod-
ing. IEEE Transactions on Visualization and Com-
puter Graphics, 14(2):440–453.
Karni, Z. and Gotsman, C. (2000). Spectral compression of
mesh geometry. In SIGGRAPH, pages 279–286. ACM
Press/Addison-Wesley Publishing Co.
Khodakovsky, A., Schr
¨
oder, P., and Sweldens, W. (2000).
Progressive geometry compression. In SIGGRAPH,
pages 271–278. ACM Press/Addison-Wesley Publish-
ing Co.
Peng, J., Eckstein, I., and Kuo, C. J. (2006). A novel
and efficient progressive lossless mesh coder. In SIG-
GRAPH Sketches, page 180, Boston, Massachusetts.
ACM.
Peng, J., Kim, C., and Kuo, C. J. (2005). Technolo-
gies for 3D mesh compression: A survey. Journal
of Visual Communication and Image Representation,
16(6):688–733.
Peng, J. and Kuo, C. J. (2005). Geometry-guided progres-
sive lossless 3D mesh coding with octree (OT) decom-
position. ACM Transactions on Graphics, 24(3):609–
616.
Shilane, P., Min, P., Kazhdan, M., and Funkhouser, T.
(2004). The princeton shape benchmark. In Proceed-
ings of the Shape Modeling International, pages 167–
178. IEEE Computer Society.
Taubin, G. and Rossignac, J. (1998). Geometric compres-
sion through topological surgery. ACM Transactions
on Graphics, 17(2):84–115.
Waschbsch, M., Gross, M., Eberhard, F., Lamboray, E., and
Wrmlin, S. (2004). Progressive compression of Point-
Sampled models. Proceedings of the Eurographics
Symposium on Point Based Graphics, pages 95–102.
GRAPP 2010 - International Conference on Computer Graphics Theory and Applications
12
